
Abstract
This paper examines the roles of parental social class and cultural capital in inequalities in English school qualifications. The analytical focus is the General Certificate of Secondary Education (GCSE). Integral to Bourdieu’s theory of cultural reproduction is the conception that inequalities in cultural capital explain the unequal scholastic achievements of pupils from different social class backgrounds. This paper is a novel investigation using data from Understanding Society and linked administrative education records from the National Pupil Database. The central empirical findings do not support the Bourdiuesian position, and there is no evidence that the substantial parental social class inequalities that are observed in school GCSE outcomes can be explained by inequalities in cultural capital. Engagement in reading related activities are mildly influential, but engagement in highbrow cultural activities are not influential. This is an important finding as the concept of cultural capital has become more prominent in Government education policy.
Introduction
The qualifications that British young people gain at school are consequential and affect their futures in both education and employment (Babb Citation2005, Banks et al. Citation1992, Furlong and Cartmel Citation2007, Jones, Joyce, and Thomas Citation2003, Raffe et al. Citation1998, Payne Citation2000, Sammons et al. Citation2014). Studies of the relationship between parental social class and young people’s outcomes in school qualifications report the overall finding that pupils from families in more advantaged social classes, on average, have more favourable outcomes (Connolly Citation2006, Demack, Drew, and Grimsley Citation2000, Drew, Gray, and Sime Citation1992, Drew Citation1995, Gayle, Berridge, and Davies Citation2003, Gayle, Murray, and Connelly Citation2016b, Gayle, Playford, and Connelly Citation2020, Playford and Gayle Citation2016, Playford et al. Citation2016, Stopforth, Gayle, and Boeren Citation2021, Strand Citation2014, Sullivan Citation2001). In a broader theory of cultural and social reproduction, Bourdieu argued that pupils from more advantaged social class backgrounds have greater stocks of cultural capital. Cultural capital is transmitted between generations within families, and it is converted into more favourable academic outcomes (Bourdieu Citation1973). In this study, we investigate the roles that both parental social class and cultural capital have on young peoples’ outcomes in British school qualifications.
The General Certificates of Secondary Education (GCSEs) are the main qualifications undertaken by pupils in England in school Year 11 (age 15-16). Outcomes in school GCSEs are investigated in this study. Despite the general trend of improvement in school GCSE outcomes in more recent cohorts, there are persistent parental social class inequalities (see Connelly, Murray, and Gayle Citation2013, Connolly Citation2006, Demack, Drew, and Grimsley Citation2000, Gayle, Murray, and Connelly Citation2016b, Playford and Gayle Citation2016, Strand Citation2014, Stopforth, Gayle, and Boeren Citation2021).
The Bourdieusian position is that differences in cultural capital provide a theoretical explanation of the ‘unequal scholastic achievements of pupils from different social class backgrounds’ (Bourdieu Citation1986: 47). Following Lamont and Lareau (Citation1988) and Breinholt and Jaeger (Citation2020), we theorise that cultural capital describes the accumulation of a set of skills, knowledge, attitudes, or behaviours which have been sanctioned by the ‘dominant’ classes in society, and which are then converted into more desirable educational outcomes. In empirical work, this is often considered as familial investment in certain ‘middle class’ activities, such as going to the theatre or reading for pleasure, which may aid scholastic achievement. Following Lareau and Weininger (Citation2003), we initially theorise that increased stocks of cultural capital can help pupils to access ‘scarce rewards’, such as the highest grades in school GCSEs. In this study, through multivariate statistical analyses, we investigate whether measures of cultural capital provide additional explanations of inequalities in school GCSE outcomes. It is theoretically plausible that the occupation-based social class inequalities that were observed in earlier studies may be attenuated when appropriate measures of cultural capital are included in multivariate analyses, and we evaluate this conjecture.
A major challenge when examining the roles of parental social class and cultural capital in children’s school qualifications is locating a large-scale nationally representative data source that includes the necessary measures. The British birth cohort studies 1946, 1958, and 1970 all pre-date the introduction of modern school qualifications (see Wadsworth et al. Citation2006, Power and Elliott Citation2006, Elliott and Shepherd Citation2006). The Longitudinal Study of Young People in England (LSYPE) is an important study but provides only a single cohort of data on young people who were aged 16 in 2006.Footnote1 The Youth Cohort Study of England and Wales (YCS) was a specialist data resource containing detailed information on young people (see Croxford, Ianelli, and Shapira Citation2007). The YCS was very well suited to studying young peoples’ experiences at school, in training, and the labour market. The YCS contained few candidate measures of cultural capital and did not collect data from parents. The YCS has since been discontinued.Footnote2 When undertaking these analyses, the Millennium Cohort Study (age 17 sweep) was not yet publicly available to researchers. However, the MCS has the potential to provide data suitable for replicating and extending the analyses in this paper.
Analysing administrative data is a potentially feasible strategy in the absence of suitable social survey data (Jones and Elias Citation2006). The National Pupil Database (NPD) and the Pupil Level Annual School Census (PLASC) provide important data on school qualifications in England (see Florian et al., Citation2004). The NPD and PLASC resources do not include measures that are suitable indicators of cultural capital. Indeed, it is common for administrative datasets to contain only a limited set of explanatory variables (Connelly, Gayle, and Lambert Citation2016b).
To address this issue, we take the innovative step of analysing data extracted from the National Pupil Database (NPD) which is linked to data from Understanding Society, the UK Household Longitudinal Study (UKHLS). The UKHLS is an ongoing large-scale, nationally representative study (Buck and McFall, Citation2012). The UKHLS collects panel data (i.e. via repeated contacts) on a broad range of subjects, from both adults and young people (Fumagalli, Knies, and Buck Citation2017).
The cardinal challenge in studies of cultural capital that uses existing survey data is the identification of survey variables that are candidate measures of cultural capital. Sullivan (Citation2002) warns of the difficulties of developing suitable indicators of cultural capital from existing survey datasets. The UKHLS is a general (or omnibus) study and collects an extensive portfolio of measures on the key domains of social and economic life (Platt et al. Citation2021). Developing a valid and reliable set of measures of cultural capital from data collected in the UKHLS is a sizeable undertaking. We navigate this important challenge by presenting results from two alternative methods of operationalising cultural capital.
Measuring cultural capital
A central challenge for this study is developing a valid and reliable set of measures of cultural capital from Understanding Society, the UK Household Longitudinal Study (UKHLS). Several authors have highlighted that Bourdieu’s original definition of cultural capital, and its subsequent measurement, lacked clarity (Lamont and Lareau Citation1988, Sullivan Citation2001, Davies and Rizk Citation2018, Breinholt and Jaeger, Citation2020). This presents a sizeable, and non-trivial, operationalisation challenge (Kingston Citation2001, Tan Citation2017). Sullivan (Citation2002) warns of the problems that follow Bourdieu’s lack of definitional clarity, and further comments that many studies appear to take the convenient course of defining cultural capital in relation to the measures that are most readily available within a research dataset.
In studies of cultural capital, a variety of observed (or manifest) measures have been used to operationalise the concept. Most notably, parental education level (Jonsson Citation1987, Jaeger and Holm Citation2007, Kraaykamp and Van Eijck Citation2010); highbrow cultural participation or cultural knowledge (Dimaggio Citation1982, De Graaf Citation1986, Katsillis and Rubinson Citation1990, Kalmijn and Kraaykamp Citation1996, Aschaffenburg and Maas Citation1997, Roscigno and Ainsworth-Darnell Citation1999, De Graaf, De Graaf, and Kraaykamp Citation2000, Sullivan Citation2001, Jaeger, Citation2009, Kraaykamp and Van Eijck Citation2010, Jaeger and Breen Citation2016); and reading behaviours (De Graaf Citation1986, Kalmijn and Kraaykamp Citation1996, De Graaf, De Graaf, and Kraaykamp Citation2000, Sullivan Citation2001, Dumais Citation2002, Jaeger and Holm Citation2007, Jaeger and Breen Citation2016, Breinholt and Jaeger, Citation2020).
It is rare for any two empirical studies to use precisely the same measures of cultural capital, and alternative forms of measurement are often used. This gives rise to the inevitable problem that the results are often inconsistent. For example, Dimaggio (Citation1982) operationalised highbrow cultural participation as a factor score of children’s participation in cultural activities like performing arts, visual arts, attending arts events or reading literature. The results demonstrated a strong, positive impact of cultural capital on high school grades in the USA. By contrast, Katsillis and Rubinson (Citation1990) found no association between a factor score of cultural participation (including attending theatres, lectures, museums, and galleries) and high school grades in Greece. Aschaffenburg and Maas (Citation1997) computed a dummy variable of ‘active investment’ in highbrow cultural participation, such as attending classes in music, visual arts, performance, art appreciation, or music appreciation. They computed separate dummy variables at three stages: before the age of 12, between the age of 12 and 17, and between the age of 18 and 24. The results suggested that cultural capital was strongly associated with school outcomes in the USA, but cultural capital did not have a cumulative effect across the educational life course. Other studies have focused on reading as a sole indicator of cultural capital. For example, Graetz (Citation1988) used a measure of the number of books in the home, which was positively, but mildly, associated with educational transitions net of the effects of social background.
Where studies have operationalised cultural capital as both highbrow participation and reading behaviours, the results have generally found that highbrow participation is not associated with educational outcomes, whereas reading behaviours are. Breinholt and Jaeger (Citation2020) operationalised cultural participation as three summated scales: first, performing arts classes (i.e. dance, music, art, performing arts, and drama classes); second, reading behaviours (i.e. frequency of reading outside of school and number of children’s books); and third, participation in organised clubs or recreational programmes and organised athletics. The authors found that reading behaviours had a direct, positive association with educational performance, whereas other elements of cultural capital did not. De Graaf, De Graaf, and Kraaykamp (Citation2000) derived scales of parental reading behaviours (such as whether parents read regional or historical novels; thrillers, science fiction, or war novels; Dutch literature; translated literature; or literature in a foreign language) in addition to measures of parental beaux arts participation (such as visits to art museums, historical museums, opera or ballet performances, classical music concerts, or theatre performances). The results demonstrated that parental reading behaviours were associated with children’s educational attainment (highest level of education), but cultural participation was not. Sullivan (Citation2001) developed more detailed measures of reading (i.e. the type of books and newspapers read, number of books read, and use of libraries), as well as separate indicators of highbrow cultural participation (i.e. attendance at art galleries, theatres, and concerts). In addition, Sullivan also developed measures of activities such as listening to music and playing an instrument, the types of television programmes watched, a test of cultural knowledge (testing knowledge of famous cultural figures), and language tests (active and passive vocabulary). The results reported that reading behaviours had the greatest effect on GCSE outcomes, and were also associated with cultural knowledge and linguistic tests.
In addition to using different measures, the focus on different analytical units also hinders comparability across studies of cultural capital and education. For example, De Graaf (Citation1986), De Graaf, De Graaf, and Kraaykamp (Citation2000), De Graaf (Citation1988), Jonsson (Citation1987), and Kalmijn and Kraaykamp (Citation1996) focused on parents’ cultural capital. Dimaggio (Citation1982), Graetz (Citation1988), Farkas et al. (Citation1990), Katsillis and Rubinson (Citation1990), Roscigno and Ainsworth-Darnell (Citation1999), Dumais (Citation2002) and Jaeger and Holm (Citation2007) focused on children’s cultural capital. Whereas, Aschaffenburg and Maas (Citation1997), Sullivan (Citation2001), Jaeger (Citation2009), Kraaykamp and Van Eijck (Citation2010), Jaeger and Breen (Citation2016) included measures relating to both parents and their children.
Despite the concept of cultural capital being widely deployed as an explanation for educational inequalities, this short review should illustrate that currently there is no consensus on the indicators that are valid and reliable measures of cultural capital. This short review should also highlight that empirical studies have focused on different components of cultural capital. In this study, we explore data from a battery of potential measures of cultural capital that are collected periodically from parents in the UKHLS adult survey and from young people in the UKHLS youth survey.
Data
We analyse data from Understanding Society, the UK Household Longitudinal Study (UKHLS) (University of Essex, Institute for Social and Economic Research, NatCen Social Research and Kantar Public Citation2018). The UKHLS is a major longitudinal study which follows participants over time, regularly collecting data about individuals and their households (Buck and Mcfall Citation2012). The UKHLS has a very large sample and therefore data collection requires a wide fieldwork window (see in Knies Citation2018). An important innovative feature of the UKHLS is that data from administrative education records have been linked to UKHLS individuals (Department for Education, University of Essex, Institute for Social and Economic Research and NatCen Social Research Citation2015).
Table 1. Indicators of parents’ and children’s cultural capital.
The administrative educational data linked to the UKHLS spans the school academic years 2009/10 to 2012/13. These data are for English state school pupils that are held in the National Pupil Database (NPD). This provides broad coverage as only a small percentage (approximately 7%) of English pupils attend independent schools (Department for Education Citation2019). A special license is required to access these data, and they must be analysed in a Secure Lab setting.Footnote3 These analyses are subject to Statistical Disclosure Control (SDC) which is the formal process by which the UK Data Service review work to ensure that results cannot be used to identify an individual respondent.Footnote4
In the UKHLS, there is a battery of potential measures of cultural capital that are collected periodically, as part of a rotating schedule of questions. From wave 2 these questions are asked at every other wave in the youth survey, and every three waves in the adult survey. We analyse the wave 2 responses for both the young person and their parents, and the young person’s subsequent GCSE outcomes from the administrative educational data. The analytical sample comprises 736 young people.
Measures
School GCSE outcomes
GCSEs were introduced in the 1980s, and remain the standard qualifications that are undertaken by pupils in England and Wales in school Year 11 (aged 15-16) (Department for Education Citation1985, Mobley et al. Citation1986, North Citation1987).Footnote5 GCSEs have historically been a mixture of assessed coursework and examinations (see Ashford, Gray, and Tranmer Citation1993). It is usual for pupils to study about nine GCSE subjects (Carroll and Gill Citation2017). The diet of subjects will include core subjects (e.g. English, Maths and Science) and a subset from a range of non-core subjects (e.g. History and French) (Jin, Muriel, and Sibieta Citation2011). Generally, each subject is assessed separately and a subject-specific GCSE is awarded. Grades are alphabetical, with the highest grade A* and the lowest grade G (Yang and Woodhouse Citation2001).Footnote6
It is common for researchers to score pupils’ school GCSE outcomes (see Croxford, Ianelli, and Shapira Citation2007, Gayle, Murray, and Connelly Citation2016b, Yang and Woodhouse Citation2001, Connolly Citation2006). Research using data that pre-dated or overlapped the introduction of the A* grade in 1994 tended to combine A* and A grades in their scoring system (Demack, Drew, and Grimsley Citation2000, Yang and Woodhouse Citation2001, Gayle, Murray, and Connelly Citation2016a). For the cohorts of young people in our analyses, the A* grade was well-established and therefore we distinguish between the A* and A grades in the points score. Yang and Woodhouse (Citation2001) reported that it is standard practice to assign 8 points to each A* grade. We assign an A* grade 8 points, an A grade 7 points, a B grade 6 points, a C grade 5 points, a D grade 4 points, an E grade 3 points, an F grade 2 points, and a G grade 1 point. Unclassified U grades are assigned 0 points. The educational outcome variable analysed in this study is the young person’s total school GCSE points.
Parental social class
In this study, we measure parental social class using the UK National Socio-Economic Classification (NS-SEC) (Pevalin and Rose Citation2002). NS-SEC is an occupation-based social class measure (Rose, Pevalin, and O’reilly Citation2005, Connelly, Gayle, and Lambert Citation2016). It is associated with three important aspects of individuals’ economic lives; their income security, their short-term income stability, and their longer-term income prospects (Goldthorpe and Mcknight Citation2004). NS-SEC is the official UK social class measure (Office for National Statistics Citation2010). A great deal of empirical testing has been directed towards developing this classification scheme, and there are agreed and documented standards for using the measure in social research (Office for National Statistics Citation2010).
Cultural capital
There are a variety of questions in the UKHLS which collect measures that can initially be considered as potential measures of cultural capital. There is a well-established distinction between components of cultural capital that indicate highbrow cultural participation, and other components that indicate reading behaviours (for example, see Mikus, Tieben, and Schober Citation2020, Breinholt and Jaeger, Citation2020, Sullivan Citation2001, De Graaf, De Graaf, and Kraaykamp Citation2000, Crook Citation1997). We have highlighted that previous studies have used different analytical units. Therefore, in this study we take the sensible precaution of identifying potential indicators of both parental and children’s engagement in highbrow culture, and both parental and children’s reading activities. The fourteen indicators are displayed in . The measures are included as dichotomous variables in the analyses that follow.
In these analyses, we measure parental education using a small number of broad categories that generally mirror qualification levels. Following Bukodi and Goldthorpe (Citation2013), we theorise parental education as a measure of socio-economic background which is distinct from parental social class. We are aware that a number of other studies have used parental education level as a proxy measure of cultural capital (e.g. Jonsson Citation1987, Jaeger and Holm Citation2007, Kraaykamp and Van Eijck Citation2010). It is a reasonable theoretical assumption that these broad education levels are likely to map onto levels of parental cultural capital. However, the associations between the levels of parental education and the manifest indicators of cultural capital are modest (i.e. values of Cramer’s V range from .01 to .38). We theorise that most British people complete their formal education in early adulthood. This leads us to conjecture that whilst parental education and cultural capital are linked, measures that reflect the activities that parents currently engage in are more important in understanding the effects of cultural capital in the pupil’s family environment. In this analysis, we examine both the effects of parental education and manifest cultural capital measures.
In the presence of multiple indicators of parental and children’s cultural capital, approaches to measurement that foster parsimony in statistically orientated data analyses are desirable. Robson (Citation2003) reminds us that the results of work operationalising the concept of cultural capital are directly contingent upon the way it is defined and measured. We investigate cultural capital using two distinctive methodological approaches. The first approach is the construction of a summated measure of participation in activities related to cultural capital (see Breinholt and Jaeger, Citation2020). For this approach, we employ a theoretical distinction between highbrow cultural activities and reading behaviours a priori, which is guided by previous empirical work. The second methodological approach is to reduce the dimensionality of the data using factor analysis (see, for example, Dimaggio Citation1982, Katsillis and Rubinson Citation1990, Hartas Citation2016). For this approach, we employ statistical methods to derive the alternative aspects of cultural capital from a set of manifest variables. Both methodological approaches have been used in previous empirical work, but they are seldom reported in the same study. An innovative feature of this study is that we compare and contrast both analytical approaches.
The first data analytical approach develops summated measures of activities related to cultural capital. Following the theoretical distinction between highbrow cultural activities and reading activities, we construct four summated measures (i) parental highbrow participation (ii) children’s highbrow participation (iii) parental reading activities (iv) children’s reading activities. These measures are the total number of highbrow activities (i.e. goes to the theatre, museum, or historic places) or reading activities (i.e. reads for pleasure, goes to the library, or discusses books) undertaken by either parent, or by the child.
The second analytical approach uses factor analysis. This provides a multivariate method for reducing dimensionality, where the information contained in the interrelationships of many variables can be conveyed, to a good approximation, by a much smaller set (Bartholomew, Knott, and Moustaki Citation2011). Factor analysis is common in analyses of cultural capital, but other latent variable models could also be used (for a review, see Bartholomew Citation2014). The factor analysis was undertaken using Stata version 15 (Statacorp Citation2017). The tetrachoric correlation matrix is reported in in the appendix.
The analysis produced a three factor solution.Footnote7 depicts the three factors, and reports the rotated factor loadings (see in the appendix for the full results). Factors 1 and 3 broadly match the conceptual distinction, prevalent in previous analyses, that distinguishes between measures which communicate culture or status (i.e. highbrow cultural participation), and measures which develop analytical and cognitive skills (i.e. reading behaviours) for parents (Crook Citation1997, De Graaf, De Graaf, and Kraaykamp Citation2000, Sullivan Citation2001, Breinholt and Jaeger, Citation2020). By contrast, the factor analytical model recovers a single factor that represents children’s cultural capital (Factor 2), and does not distinguish between highbrow cultural participation and reading behaviours.Footnote8 In the next stage of the analysis, we derived factor scores using the regression method (see Thomson Citation1951). The factor scores are standardised (mean = 0; standard deviation = 1).
Figure 1. Factor analysis of cultural capital measures (rotated factor loadings).
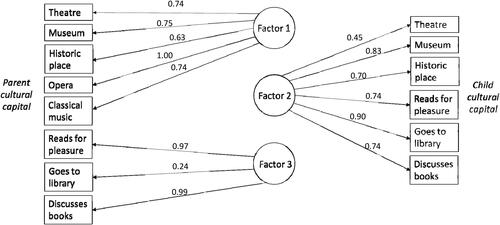
Table 2. Associations between parental social class (NS-SEC) and cultural capital measures.
Results
presents the associations between parental social class and the individual, manifest cultural capital measures. There are different levels of parental and children’s participation in highbrow cultural activities across the social class categories (NS-SEC). It is notable that there is not a significant relationship between children’s reading activities and their parental occupation-based social class. The respective associations between parental occupational social class (NS-SEC) and parental highbrow activities, children’s highbrow activities, and parental reading activities are moderate in strength (i.e. values of Cramer’s V from .16 to .42). Associations between parental NS-SEC and cultural capital activities are generally higher for parental measures than for children’s measures.
reports the summary statistics for pupils’ school GCSE scores by parental social class (NS-SEC) and the manifest cultural capital indicators. There are sizable occupation-based social class inequalities. For example, the mean GCSE score for pupils from families in NS-SEC 1.2 (Higher professional occupations) is 28 points higher than the mean for pupils from families in NS-SEC 7 (Routine occupations). Pupils that participate in highbrow cultural activities, or have parents who participate in highbrow cultural activities, have higher mean school GCSE scores. Similarly, pupils who engage in reading activities, or have parents who engage in reading activities, also have higher mean school GCSE scores.
Table 3. Summary statistics for parental social class (NS-SEC), cultural capital measures and school GCSE scores.
In the first stage of the multivariate analysis, we estimate a standard linear regression model on school GCSE scores. We then evaluate a series of nested regression models (see Allen Citation1997). In addition to assessing the variance explained, we also consider model parsimony using a Bayesian information criterion statistic (BIC) (see Raftery Citation1986, Treiman Citation2009). The UKHLS has a complex structure and sample (Lynn Citation2009). The complexity of the UKHLS data has been appropriately incorporated into the analyses using Stata’s survey data function (Kreuter and Valliant Citation2007). The regression model results (e.g. coefficients and standard errors) are derived from models that are adjusted for the complex survey design and selection strategy in the UKHLS. It is not currently possible to derive easily comparable goodness of fit and parsimony measures for regression models which have been adjusted for complex survey designs. Therefore, the goodness of fit and parsimony measures that we present compare unadjusted models.
Occupation-based parental social class (NS-SEC) explains 16% of the variance in school GCSE scores (see Model 1, ). The explanation is improved by the inclusion of additional explanatory variables; housing tenure, gender, ethnicity, age, and academic year (Adjusted R2 = .22; see Model 2, ). Including a measure of parental education provides a further parsimonious improvement (Adjusted R2 = .27; see Model 3, ). Therefore, parental education is an important additional socio-economic indicator in these analyses. We are aware that a number of other studies have used parental education level as a proxy measure of cultural capital. Comparing Model 2 and Model 3 in , it is notable that the inclusion of parental education does not attenuate the strong parental social class effects on school GCSE scores.
Table 4. Modelling school GCSE outcomes – goodness of fit and parsimony measures.
Table 5. Linear regression models of school GCSE outcomes.
The four summated cultural capital measures (parental highbrow participation; children’s highbrow participation; parental reading activities; children’s reading activities) each provide a marginal increase in the proportion of variance explained (see Models 4-7, ). However, parental highbrow participation and children’s highbrow participation are not statistically significant when parental reading activities and children’s reading activities are included in the model. The model of best fit (Model 11, ) notably includes occupation-based parental social class, parental reading activities, and children’s reading activities (Adjusted R2 .31 and BIC = 6542.46 at 28 degrees of freedom).
The three cultural capital factors (Factor 1 parental highbrow factor score; Factor 2 children’s factor score; Factor 3 parental reading factor score) each provide a marginal increase in the proportion of variance explained (see Models 8-10, ). Parental highbrow factor score (Factor 1) is not statistically significant when children’s factor score (Factor 2) and parental reading factor score (Factor 3) are also included in the model. The model of best fit (Model 12, ) notably includes occupation-based parental social class, children’s factor score (Factor 2), and parental reading factor score (Factor 3) (Adjusted R2 .32 and BIC = 6512.89 at 24 degrees of freedom).
The linear regression results for the four substantively important models (Models 2, 3, 11, and 12) are reported in . An examination of the coefficients and standard errors for parental NS-SEC indicate that the cultural capital measures do not attenuate the substantial parental social class inequalities in school GCSE outcomes. We note that the coefficients for the categories of parental social class (NS-SEC) are attenuated when parental education is also included in the model, however growing up in a family from a less advantaged social class position still has a large negative effect. There is no evidence that the occupation-based parental social class effects that were observed in earlier studies were only significant because occupational social class acted as a proxy in the absence of appropriate measures of cultural capital.
Occupation-based parental social class is an important element of these inequalities in school GCSE outcomes. The measures of cultural capital provide a small additional explanation of inequalities in school GCSE outcomes. Cultural capital is unequally distributed across the occupation-based social class categories, but the associations are relatively weak. Parental and children’s reading activities are significant, but they only explain an additional 4-5% of the variance in school GCSE outcomes. In a multivariate context, reading activities play a much less influential role than occupation-based social class in explaining social inequalities in school GCSE outcomes. Higher quantities of parental reading activity are beneficial, both when measured by a direct measure of reading activities or a latent factor. Children’s reading activities are also important. Engaging in two or three reading activities, on average, increases the pupil’s GCSE score by between seven and nine points. The size of this effect should not be overlooked since an extra GCSE pass at grade A* is worth eight points. Taken together, these results do not lend any support to the theoretical position that parental occupation-based social class inequalities in school GCSE outcomes are attenuated when detailed measures of cultural capital are included in the analyses.
Conclusions
The persistence of social class inequalities in school GCSE outcomes is disturbing because qualifications gained at school are consequential, and affect individual young people’s futures in both education and employment. Using multivariate statistical analyses, we investigated the role of both occupation-based social class and cultural capital, and conclude that measures of cultural capital provide little additional explanation of inequalities in school GCSE outcomes. A priori, it was theoretically plausible that the occupation-based social class inequalities that were observed in earlier studies may be attenuated when appropriate measures of cultural capital are included in multivariate analyses. This conjecture is not supported in these empirical analyses. The family’s location in the occupational class structure remains salient. As Bihagen and Lambert (Citation2018) remind us, the occupations that are located in more advantaged social classes tend to be more highly skilled and tend to have more highly educated incumbents.
The empirical analyses convey the important message that engagement in highbrow cultural activities is not important, but reading activities are influential. This finding chimes with other results on the effects of cultural capital on educational outcomes (Crook Citation1997, De Graaf, De Graaf, and Kraaykamp Citation2000, Mikus, Tieben, and Schober Citation2020, Sullivan Citation2001). Breinholt and Jaeger (Citation2020) reasoned that highbrow cultural participation might signal scholastic ability to teachers, but reading behaviours develop relevant educational skills. Sullivan (Citation2001, Citation2008) similarly noted that there is an important difference between language based activities (e.g. reading) and non-language based activities (e.g. highbrow cultural participation). Sullivan and Brown (Citation2015) argued that the ability to process language is a key skill in education, which has direct applications to scholastic work. The influence of parental reading behaviours may operate through ‘passive role modelling’ (Mikus, Tieben, and Schober Citation2020). It is plausible that children living in households in which adults actively engage in reading activities may be more likely to engage in reading activities themselves (De Graaf, De Graaf, and Kraaykamp Citation2000).
Many education and youth datasets include measures of parental education but do not have suitable measures of cultural capital. We consider that parental education level is a useful socio-economic indicator that reflects the educational milieu of the family, but we strongly argue it is not a suitable substitute for cultural capital. This is because a higher level of parental education does not automatically engender a greater stock of cultural capital. Cultural capital measures should reflect what parents and children do, not just the qualifications parents gained in early adulthood. In this study, the persistent significance of parental education, even when detailed measures of cultural capital are included in the models, persuades us that whilst parental education is associated with cultural capital, it should not be used interchangeably. Therefore, we warn against the uncritical use of parental education as a measure of cultural capital.
This study has directly addressed the challenges associated with operationalising measures of cultural capital from an existing data resource. On reflection, the use of survey data with linked educational administrative data has proved beneficial, and addressed the data challenges associated with studying parental social class, cultural capital, and educational outcomes. We are cognisant that the analytical sample is smaller than samples that are common in the older UK birth cohort studies and the discontinued Youth Cohort Study of England and Wales. Since undertaking these analyses, a new secure access dataset has been released linking English education data (including GCSE exam results) to the participants of the Millennium Cohort Study (Centre for Longitudinal Studies Citation2019). These data are likely to prove valuable for studying school qualifications for a larger cohort of school pupils. This current study provides a useful methodological blueprint which will inform our future analyses of the Millennium Cohort Study.
The results reported above make an important contribution to understanding the role of cultural capital in educational outcomes. Increasing levels of cultural capital is a positive valance concept, and it is beguiling to believe that increasing pupils’ levels of cultural capital will have a positive influence on school GCSE outcomes. It is tempting to theorise that visits to museums or historic venues might be helpful in igniting interests in history, and that visits to the theatre might similarly cultivate learning in drama. On deeper reflection, it is difficult to plausibly describe mechanisms by which the exposure to certain extracurricular activities would influence outcomes in other school GCSE subjects. Indeed, to our knowledge, educational commentators seldom (if ever) suggest that going to football matches or attending church has any positive effects on outcomes in GCSE Physical Education or GCSE Religious Studies. The equivocal theoretical claims about the mechanisms by which cultural capital might influence school GCSE outcomes, is contrasted by the far more conceivable theoretical view that young people engaging in reading behaviours is a mechanism that can develop educational skills that are pertinent to the wider portfolio of school GCSE outcomes.
The concept of cultural capital has made the transition from social science to educational policy. New guidance from the Office for Standards in Education, Children’s Services and Skills (Ofsted) states that ‘as part of making the judgement about quality of education, inspectors will consider the extent to which schools are equipping pupils with the knowledge and cultural capital they need to succeed in life’ (Office for Standards in Education Children’s Services and Skills, Citation2019: 10). Leading British sociologist John Goldthorpe commented that the ‘the whole passage [in the handbook] is so vacuous as to be quite innocuous’.Footnote9 The definitions in the policy are vague, and we are convinced that the assessment of cultural capital will be plagued by measurement problems.
This study reports a set of empirical findings that do not lend any support to the view that increasing cultural capital will reduce the size of social class inequalities in school GCSE outcomes. This is not to argue that activities that have sometimes been associated with increasing cultural capital should not be part of the school experience, for example extracurricular trips may contribute to educational enjoyment. However, if schools are serious about reducing educational inequalities, our empirical findings send a clear and actionable message for policy and practice. In order to support groups of pupils who may be projected to have lower school GCSE outcomes, schools would be better placed to concentrate on increasing reading activities. Our findings further demonstrate that this would be in addition to more directly targeted policy interventions to reduce the stark social class attainment gaps, which are consistently observed in school GCSE outcomes.
Acknowledgements
We thank the participants of the UK Household Longitudinal Study (Understanding Society). Understanding Society is an initiative funded by the Economic and Social Research Council and various Government Departments, with scientific leadership by the Institute for Social and Economic Research, University of Essex, and survey delivery by NatCen Social Research and Kantar Public. The research data are distributed by the UK Data Service. We also acknowledge the UK Data Archive for making these data available and the support provided by the Secure Lab staff at the UK Data Service. The authors alone are responsible for the interpretation and analyses of the data. We would also like to thank the two anonymous reviewers for their helpful comments on an earlier draft of this paper.
Disclosure statement
No potential conflict of interest was reported by the author(s).
Notes
1 See https://cls.ucl.ac.uk/cls-studies/next-steps/ accessed 6th October 2021.
2 See https://data.gov.uk/dataset/2521adc1-8f52-4fd5-a0f8-3bb0a0453acb/youth-cohort-study accessed 6th October 2021.
3 See https://ukdataservice.ac.uk/find-data/access-conditions/ accessed 6th October 2021.
4 See https://ukdataservice.ac.uk/help/secure-lab/securelab-faqs/#SDC accessed 6th October 2021.
5 Other qualifications are available but the majority of pupils study GCSEs (Gill, 2016).
6 Following reforms from 2016, a new GCSE grading system is in the process of being introduced in England. Grade 9 is the new highest grade and grade 1 the lowest (Ofqual, Citation2018). Wales has retained the A*-G grading system (see https://www.qualificationswales.org/english/qualifications/gcses-and-a-levels/gcses accessed 6th October 2021). In Northern Ireland, the grading system used varies by exam board (see https://www.nidirect.gov.uk/articles/gcses accessed 6th October 2021).
7 We present the results from a principal components analysis, but we also re-estimated the analysis using the principal factor method and the results are consistent.
8 Parent library use loaded weakly on all factors and child theatre attendance loaded similarly on factor 2 (0.44) and factor 3 (0.45). We re-estimated the analyses separately without these measures and the results were unchanged.
9 See https://www.theguardian.com/education/2019/sep/03/ofsted-plan-inspect-cultural-capital-schools-attacked-as-elitist accessed 6th October 2021.
References
- Allen, M. P. 1997. “Testing Hypotheses in Nested Regression Models.” Understanding Regression Analysis: 113–117.
- Aschaffenburg, K., and I. Maas. 1997. “Cultural and Educational Careers: The Dynamics of Social Reproduction.” American Sociological Review 62 (4): 573–587. doi:10.2307/2657427.
- Ashford, S., J. Gray, and M. Tranmer. 1993. “The Introduction of GCSE Exams and Changes in Post-16 Participation.” Employment Department Research Series YCS Reports 23. Sheffield: Employment Department.
- Babb, P. 2005. A Summary of Focus on Social Inequalities. London: Office for National Statistics.
- Banks, M., I. Bates, G. M. Breakwell, J. Bynner, N. Emler, L. Jamieson, and K. Roberts. 1992. Careers and Identities. N.J.: Open University Press.
- Bartholomew, D. J. 2014. “Old and New Approaches to Latent Variable Modelling.” In Latent Variable and Latent Structure Models. N.J.: Psychology Press.
- Bartholomew, D. J., M. Knott, and I. Moustaki. 2011. Latent Variable Models and Factor Analysis: A Unified Approach. N.J.: John Wiley & Sons.
- Bihagen, E., and P. Lambert. 2018. “Can Class and Status Really Be Disentangled?” Research in Social Stratification and Mobility 58: 1–10. doi:10.1016/j.rssm.2018.08.001.
- Bourdieu, P. 1973. “Cultural Reproduction and Social Reproduction.” In Knowledge, Education, and Cultural Change: Papers in the Sociology of Education, edited by R. K. Brown. London: Tavistock.
- Bourdieu, P. 1986. “The Forms of Capital.” In Handbook of Theory and Research for the Sociology of Education, edited by J. Richardson. Westport, CT: Greenwood.
- Breinholt, A., and M. M. Jaeger. 2020. “How Does Cultural Capital Affect Educational Performance: Signals or Skills?” The British Journal of Sociology 71 (1): 28–46. doi:10.1111/1468-4446.12711.
- Buck, N., and S. Mcfall. 2012. “Understanding Society: design Overview.” Longitudinal and Life Course Studies 3: 5–17.
- Bukodi, E., and J. H. Goldthorpe. 2013. “Decomposing ‘Social Origins’: The Effects of Parents’ Class, Status, and Education on the Educational Attainment of Their Children.” European Sociological Review 29 (5): 1024–1039. doi:10.1093/esr/jcs079.
- Carroll, M., and T. Gill. 2017. “Uptake of GCSE Subjects 2016.” In Statistics Report Series No. 114. Cambridge, UK: Cambridge Assessment.
- Centre for Longitudinal Studies. 2019. A Guide to the Linked Educational Datasets (First Edition). London: Institute of Education, University College London.
- Connelly, R., V. Gayle, and P. S. Lambert. 2016. “A Review of Occupation-Based Social Classifications for Social Survey Research.” Methodological Innovations 9: 205979911663800. 2059799116638003. doi:10.1177/2059799116638003.
- Connelly, R., S. J. Murray, and V. Gayle. 2013. “Young People and School GCSE Attainment: Exploring The ‘Middle.” Sociological Research Online 18 (1): 210–221. doi:10.5153/sro.2880.
- Connolly, P. 2006. “The Effects of Social Class and Ethnicity on Gender Differences in GCSE Attainment: A Secondary Analysis of the Youth Cohort Study of England and Wales 1997–2001.” British Educational Research Journal 32 (1): 3–21. doi:10.1080/01411920500401963.
- Crook, C. J. 1997. Cultural Practices and Socioeconomic Attainment: The Australian Experience. Westport, CT: Greenwood Press.
- Croxford, L., C. Ianelli, and M. Shapira. 2007. Documentation of the Youth Cohort Time-Series Datasets, UK Data Archive Study Number 5765. Colchester: Economic and Social Data Service.
- Davies, S., and J. Rizk. 2018. “The Three Generations of Cultural Capital Research: A Narrative Review.” Review of Educational Research 88 (3): 331–365. doi:10.3102/0034654317748423.
- De Graaf, P. M. 1986. “The Impact of Financial and Cultural Resources on Educational Attainment in the Netherlands.” Sociology of Education 59 (4): 237–246. doi:10.2307/2112350.
- De Graaf, P. M. 1988. “Parents’ Financial and Cultural Resources, Grades, and Transition to Secondary School in the Federal Republic of Germany.” European Sociological Review 4 (3): 209–221. doi:10.1093/oxfordjournals.esr.a036485.
- De Graaf, N. D., P. M. De Graaf, and G. Kraaykamp. 2000. “Parental Cultural Capital and Educational Attainment in the Netherlands: A Refinement of the Cultural Capital Perspective.” Sociology of Education 73 (2): 92–111. doi:10.2307/2673239.
- Demack, S., D. Drew, and M. Grimsley. 2000. “Minding the Gap: Ethnic, Gender and Social Class Differences in Attainment at 16, 1988‐95.” Race Ethnicity and Education 3 (2): 117–143. doi:10.1080/13613320050074005.
- Department for Education, University of Essex, Institute for Social and Economic Research and Research, N. S. 2015. Understanding Society: Wave 1, 2009-2011: Linked National Pupil Database: Secure Access. [data collection]. 2nd ed. UK Data Service. SN: 7642, doi:10.5255/UKDA-SN-7642-2.
- Department for Education. 1985. General Certificate of Secondary Education: A General Introduction. London: Her Majesty’s Stationery Office.
- Department for Education. 2019. Schools, Pupils and Their Characteristics. London: Department for Education.
- Dimaggio, P. 1982. “Cultural Capital and School Success: The Impact of Status Culture Participation on the Grades of U.S. High School Students.” American Sociological Review 47 (2): 189–201. doi:10.2307/2094962.
- Drew, D. 1995. “Race.” Education and Work: The Statistics of Inequality. Aldershot: Avebury.
- Drew, D., J. M. Gray, and N. Sime. 1992. Against the Odds: The Education and Labour Market Experiences of Black Young People. Sheffield, Training, Agency Research and Development Series. Sheffield: Department of Employment.
- Dumais, S. A. 2002. “Cultural Capital, Gender, and School Success: The Role of Habitus.” Sociology of Education 75 (1): 44–68. doi:10.2307/3090253.
- Elliott, J., and P. Shepherd. 2006. “Cohort Profile: 1970 British Birth Cohort (BCS70).” International Journal of Epidemiology 35 (4): 836–843. doi:10.1093/ije/dyl174.
- Farkas, G., R. P. Grobe, D. Sheehan, and Y. Shuan. 1990. “Cultural Resources and School Success: Gender, Ethnicity, and Poverty Groups within an Urban School District.” American Sociological Review 55 (1): 127–142. doi:10.2307/2095708.
- Florian, L., Rouse, M., Black‐Hawkins, K. and Jull,, S. 2004. What can national data sets tell us about inclusion and pupil achievement? British Journal of Special Education. 31: 115-121.
- Fumagalli, L., G. Knies, and N. Buck. 2017. Understanding Society, The UK Household Longitudinal Study, Harmonised British Household Panel Survey (BHPS) User Guide. Colchester: Institute for Social and Economic Research, University of Essex.
- Furlong, A., and F. Cartmel. 2007. Young People and Social Change: New Perspectives. Maidenhead: Open University Press.
- Gayle, V., D. Berridge, and R. B. Davies. 2003. Econometric Analysis of the Demand for Higher Education. Nottingham: Department for Education and Skills.
- Gayle, V., S. Murray, and R. Connelly. 2016a. “Young People and School General Certificate of Secondary Education Attainment: looking for the ‘Missing Middle.” British Journal of Sociology of Education 37 (3): 350–370. doi:10.1080/01425692.2014.935292.
- Gayle, V., S. Murray, and R. Connelly. 2016b. “Young People and School General Certificate of Secondary Education Attainment: Looking for the ‘Missing Middle.” British Journal of Sociology of Education 37 (3): 350–370. doi:10.1080/01425692.2014.935292.
- Gayle, V., C. J. Playford, and R. Connelly. 2020. “Social Class Inequalities in Scottish School Qualifications.” Contemporary Social Science. 16: 294–308.
- Gill, T. 2016. “Uptake of Level 2 Qualifications in English Schools 2015.” In Cambridge Assessment Statistics Report Series No.103. Cambridge: Cambridge Assessment.
- Goldthorpe, J. H., and A. Mcknight. 2004. The economic basis of social class (CASE Paper 80). http://eprints.lse.ac.uk/6312/1/The_Economic_Basis_of_Social_Class.pdf
- Graetz, B. 1988. “The Reproduction of Privilege in Australian Education.” The British Journal of Sociology 39 (3): 358–376. doi:10.2307/590483.
- Hartas, D. 2016. “Young People’s Educational Aspirations: psychosocial Factors and the Home Environment.” Journal of Youth Studies 19 (9): 1145–1163. doi:10.1080/13676261.2016.1145634.
- Jaeger, M. M. 2009. “Equal Access but Unequal Outcomes: Cultural Capital and Educational Choice in a Meritocratic Society.” Social Forces 87 (4): 1943–1971. doi:10.1353/sof.0.0192.
- Jaeger, M. M., and R. Breen. 2016. “A Dynamic Model of Cultural Reproduction.” AJS; American Journal of Sociology 121 (4): 1079–1115. doi:10.1086/684012.
- Jaeger, M. M., and A. Holm. 2007. “Does Parents’ Economic, Cultural, and Social Capital Explain the Social Class Effect on Educational Attainment in the Scandinavian Mobility Regime?” Social Science Research 36 (2): 719–744. doi:10.1016/j.ssresearch.2006.11.003.
- Jin, W., A. Muriel, and L. Sibieta. 2011. “Subject and Course Choices at Ages 14 and 16 Amongst Young People in England: Insights from Behavioural Economics.” In Research Report DFE-RR160. London: Department for Education.
- Jones, P., and P. Elias. 2006. Administrative data as a research resource: a selected audit. National Data Strategy, Available at https://eprints.ncrm.ac.uk/id/eprint/452/1/Admin%2520Data%2520selected%2520audit%2520Dec06.pdf.
- Jones, J., M. Joyce, and J. Thomas. 2003. Non-employment and labour availability. Bank of England Quarterly Bulletin, Autumn 2003. Available at SSRN: https://ssrn.com/abstract=706945.
- Jonsson, J., O. 1987. “Class Origin, Cultural Origin, and Educational Attainment: The Case of Sweden.” European Sociological Review 3 (3): 229–242. doi:10.1093/oxfordjournals.esr.a036451.
- Kalmijn, M., and G. Kraaykamp. 1996. “Race, Cultural Capital, and Schooling: An Analysis of Trends in the United States.” Sociology of Education 69 (1): 22–34. doi:10.2307/2112721.
- Katsillis, J., and R. Rubinson. 1990. “Cultural Capital, Student Achievement, and Educational Reproduction: The Case of Greece.” American Sociological Review 55 (2): 270–279. doi:10.2307/2095632.
- Kingston, P. W. 2001. “The Unfulfilled Promise of Cultural Capital Theory.” Sociology of Education 74: 88–99. doi:10.2307/2673255.
- Knies, G. E. 2018. Understanding Society the UK Household Longitudinal Study Waves 1-8 User Guide. Colchester: Essex Institute for Social and Economic Research, University of Essex.
- Kraaykamp, G., and K. Van Eijck. 2010. “The Intergenerational Reproduction of Cultural Capital: A Threefold Perspective.” Social Forces 89 (1): 209–231. doi:10.1353/sof.2010.0087.
- Kreuter, F., and R. Valliant. 2007. “A Survey on Survey Statistics: What is Done and Can Be Done in Stata.” The Stata Journal: Promoting Communications on Statistics and Stata 7 (1): 1–21. doi:10.1177/1536867X0700700101.
- Lamont, M., and A. Lareau. 1988. “Cultural Capital: Allusions, Gaps and Glissandos in Recent Theoretical Developments.” Sociological Theory 6 (2): 153–168. doi:10.2307/202113.
- Lareau, A., and E. B. Weininger. 2003. “Cultural Capital in Educational Research: A Critical Assessment.” Theory and Society 32 (5/6): 567–606. doi:10.1023/B:RYSO.0000004951.04408.b0.
- Lynn, P. 2009. “Sample Design for Understanding Society.”Understanding Society Working Paper Series No. 2009-01. Colchester: Institute for Social and Economic Research, University of Essex.
- Mikus, K., N. Tieben, and P. S. Schober. 2020. “Children’s Conversion of Cultural Capital into Educational Success: The Symbolic and Skill-Generating Functions of Cultural Capital.” British Journal of Sociology of Education 41 (2): 197–217. doi:10.1080/01425692.2019.1677454.
- Mobley, M., C. Emerson, I. Goddard, S. Goodwin, and R. Letch. 1986. All about GCSE. London: Heinemann Educational.
- North, J. 1987. The GCSE: An Examination. London: Claridge Press, in association with Education Research Trust.
- Office for National Statistics. 2010. Standard Occupational Classification 2010, Volume 3, the National Statistics Socio-Economic Classification: (Rebased on the SOC2010) User Manual. Southampton: Palgrave Macmillan.
- Ofqual. 2018. Grading new GCSEs [Online]. Accessed 27 November 2018. https://assets.publishing.service.gov.uk/government/uploads/system/uploads/attachment_data/file/719124/Grading_new_GCSEs25.6.2018.pdf.
- Payne, J. 2000. Progress of Low Achievers after Age Sixteen: An Analysis of Data from the England and Wales Youth Cohort Study. Nottingham: Department for Education and Employment.
- Pevalin, D., and D. Rose. 2002. “The National Statistics Socio-Economic Classification: unifying Official and Sociological Approaches to the Conceptualisation and Measurement of Social Class in the United Kingdom.” Sociétés Contemporaines 45–46 (1): 75–106. doi:10.3917/soco.045.0075.
- Platt, L., G. Knies, R. Luthra, A. Nandi, and M. Benzeval. 2021. “Understanding Society at 10 Years.” European Sociological Review 36 (6): 976–988. doi:10.1093/esr/jcaa031.
- Playford, C. J., and V. Gayle. 2016. “The Concealed Middle? An Exploration of Ordinary Young People and School GCSE Subject Area Attainment.” Journal of Youth Studies 19 (2): 149–168. doi:10.1080/13676261.2015.1052049.
- Playford, C. J., V. Gayle, R. Connelly, and S. Murray. 2016. “Parental Socioeconomic Influences on Filial Educational Outcomes in Scotland: patterns of School-Level Educational Performance Using Administrative Data.” Contemporary Social Science 11 (2–3): 183. doi:10.1080/21582041.2016.1172728.
- Power, C., and J. Elliott. 2006. “Cohort Profile: 1958 British Birth Cohort (National Child Development Study).” International Journal of Epidemiology 35 (1): 34–41. doi:10.1093/ije/dyi183.
- Raffe, D., A. Biggart, J. Fairgrieve, C. Howieson, J. Rodger, and S. Burniston. 1998. Thematic Review of the Transition from Initial Education to Working Life: United Kingdom Background Report. London: Department for Education and Employment.
- Raftery, A. E. 1986. “Choosing Models for Cross-Classifications.” American Sociological Review 51 (1): 145–146. doi:10.2307/2095483.
- Robson, K. 2003. “Teenage Time Use as Investment in Cultural Capital.” In Working Papers of the Institute for Social and Economic Research, Paper 2003-12. Colchester: University of Essex.
- Roscigno, V. J., and J. W. Ainsworth-Darnell. 1999. “Race, Cultural Capital, and Educational Resources: Persistent Inequalities and Achievement Returns.” Sociology of Education 72 (3): 158–178. doi:10.2307/2673227.
- Rose, D., D. J. Pevalin, and K. O’reilly. 2005. The National Statistics Socio-Economic Classification: origins, Development and Use. Basingstoke: Palgrave Macmillan.
- Sammons, P., K. Sylva, E. Melhuish, I. Siraj, B. Taggart, K. Toth, and R. Smees. 2014. Influences on Students’ GCSE Attainment and Progress at Age 16. London: Department for Education.
- Statacorp. 2017. Stata Statistical Software: Release 15. College Station, TX: StataCorp LLC.
- Stopforth, S., V. Gayle, and E. Boeren. 2021. “Parental Social Class and School GCSE Outcomes: two Decades of Evidence from UK Household Panel Surveys.” Contemporary Social Science 16 (3): 309–324. doi:10.1080/21582041.2020.1792967.
- Strand, S. 2014. “Ethnicity, Gender, Social Class and Achievement Gaps at Age 16: Intersectionality and ‘Getting It’for the White Working Class.” Research Papers in Education 29 (2): 131–171. doi:10.1080/02671522.2013.767370.
- Sullivan, A. 2001. “Cultural Capital and Educational Attainment.” Sociology 35 (4): 893–912. doi:10.1177/0038038501035004006.
- Sullivan, A. 2002. “Bourdieu and Education: How Useful is Bourdieu’s Theory for Researchers?” Netherlands Journal of Social Sciences 38: 144–166.
- Sullivan, A. 2008. “Cultural Capital, Cultural Knowledge and Ability.” Sociological Research Online 12 (6): 91. doi:10.5153/sro.1596.
- Sullivan, A., and M. Brown. 2015. “Reading for Pleasure and Progress in Vocabulary and Mathematics.” British Educational Research Journal 41 (6): 971–991. doi:10.1002/berj.3180.
- Tan, C. Y. 2017. “Conceptual Diversity, Moderators, and Theoretical Issues in Quantitative Studies of Cultural Capital Theory.” Educational Review 69 (5): 600–619. doi:10.1080/00131911.2017.1288085.
- Thomson, G. 1951. The Factorial Analysis of Human Ability. London: University of London Press.
- Treiman, D. J. 2009. Quantitative Data Analysis: Doing Social Research to Test Ideas. San Francisco: John Wiley & Sons.
- University of Essex, Institute for Social and Economic Research, Natcen Social Research and Public., K. 2018. Understanding society: Waves 1–7, 2009–2016 and Harmonised BHPS: Waves 1–18, 1991–2009 [data collection]. 10th Edition. UK Data Service. SN: 6614. doi:10.5255/UKDA-SN-6614-11.
- Wadsworth, M., D. Kuh, M. Richards, and R. Hardy. 2006. “Cohort Profile: The 1946 National Birth Cohort (MRC National Survey of Health and Development).” International Journal of Epidemiology 35 (1): 49–54. doi:10.1093/ije/dyi201.
- Yang, M., and G. Woodhouse. 2001. “Progress from GCSE to a and as Level: Institutional and Gender Differences, and Trends over Time.” British Educational Research Journal 27 (3): 245–267. doi:10.1080/01411920120048296.