
 ?Mathematical formulae have been encoded as MathML and are displayed in this HTML version using MathJax in order to improve their display. Uncheck the box to turn MathJax off. This feature requires Javascript. Click on a formula to zoom.
ABSTRACT
The current generation of geostationary Earth-observing satellites provide spectral bandpass, spatial resolution and imaging frequency characteristics well suited to near-continuous active fire detection and monitoring. The earliest of these systems-SEVIRI on-board EUMETSAT’s MSG series-has operated since 2004, and more recently the capability has been expanded globally with the ABI on-board NOAA’s GOES-16 and GOES-17 satellites, and the AHI on-board JMA’s Himawari-8 and Himawari-9. At present, the NOAA and EUMETSAT operational geostationary active fire products are available based on two different algorithms: the Fire Detection and Characterization (FDC) product operating with data from GOES-16 and −17, and FRP-PIXEL active fire products from GOES, Himawari and MSG. We have conducted a comprehensive accuracy assessment of these geostationary fire products across two seasons (1 January–31 March 2020 and 1 July–30 September 2020), based on comparison to Landsat active fire detections made simultaneously (±5 minutes of geostationary overpass time) with the geostationary data. Compared to Landsat we find (i) low false alarm rates, ranging between 4%–7% (FDC) and 2%-6% (FRP-PIXEL)- depending on the season and hemispheric-disk for high confidence pixels, (ii) a reduction in this false alarm rate for FDC due to algorithm changes made since our prior (2018) validation effort (48% false alarms in summer 2018 compared to 4% in summer 2020 for high confidence pixels), and (iii) comparable active fire pixel detection rates for the FDC product (high confidence fire pixel classes only) and the matching FRP-PIXEL product (all fire pixel confidence classes). Overall, the performance of these geostationary products is shown to be strong and complementary in that the FRP-PIXEL product has fewer false alarms but a lower detection rate, whereas the FDC product detects more fire pixels but with a much higher false alarm rate.
1. Introduction
The current generation of geostationary weather satellites, which include the NOAA Geostationary Operational Environmental Satellite (GOES) R-Series, the European Organization for the Exploitation of Meteorological Satellites (EUMETSAT) Meteosat Second Generation (MSG), and the Japan Meteorological Agency (JMA) Himawari platforms, now include explicit active fire monitoring capabilities in addition to generic refinements in spatial and temporal resolution as well as radiometric performance. The Advanced Baseline Imager (ABI) on-board the GOES-16, GOES-17 and GOES-18 satellites and the Advanced Himawari Imager (AHI) on-board the Himawari-8 and Himawari-9 satellites were designed with similar specifications, allowing for an easier intercomparison between the three hemispheric-disks, whereas the MSG Spinning Enhanced Visible and Infra-Red Imager (SEVIRI) sensor has been operating for considerably longer and has characteristics roughly between the previous generation GOES and ABI/AHI (/). MSG will be replaced by the even more capable Meteosat Third Generation (launched December 2022) within the next few years.
Figure 1. Spatial coverage and pixel area (km2) of the GOES-16, GOES-17, MSG, and Himawari disks. The pixel footprint increases systematically from each sensor’s sub-satellite point. At the time of analysis, the MSG-Indian Ocean Data Coverage (IODC) active fire product was not routinely available from the EUMETSAT LSA SAF (https://landsaf.Ipma.pt/en/) and so it is not included on this figure.
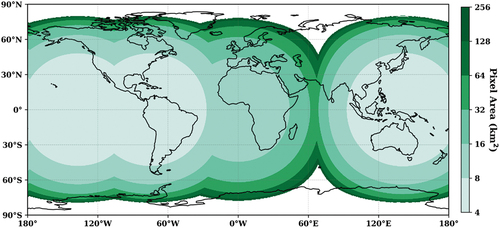
Table 1. Key advances in the latest generation of NOAA and EUMETSAT geostationary Earth observing satellites, compared to their predecessors. Table adapted from (Hall et al. Citation2019).
Active fire detections are one of the most frequently accessed Earth observation land products and are used in a wide range of applications, including emissions modelling (e.g. Li et al. Citation2019; Mota and Wooster Citation2018), land use/land cover mapping (e.g. Millones et al. Citation2017; Vetrita and Cochrane Citation2020), and disaster mapping (e.g. Davies et al. Citation2008; ESRI Citation2021). However, to date, polar-orbiting sensors have provided the active fire data for most fire research and many operational applications, primarily due to their global coverage and finer spatial resolution compared to geostationary sensors (e.g. Eva and Flasse Citation1996; Giglio, Schroeder, and Justice Citation2016; Schroeder et al. Citation2014; Wooster et al. Citation2021). However, despite their larger pixel sizes (), modern geostationary imaging now provides an unrivalled temporal sampling of fire activity. GOES ABI on-demand mesoscale imaging can cover a region as often as every 30 seconds. This capability offers considerable advantages in uses where near-continuous monitoring of the highly dynamic nature of fire activity throughout the day and night is required (Freeborn et al. Citation2009; Giglio Citation2007; Prins et al. Citation2001; Schmit et al. Citation2017; Wooster et al. Citation2021), and has shown significant benefits in both operational and research applications (e.g. Vosloo, Momberg, and Josephine Citation2010; Baldassarre et al. Citation2015; Roberts et al. Citation2015; Lindley et al. Citation2020; Mueller et al. Citation2020).
Multiple agencies produce active fire products from the geostationary sensors whose footprints are shown in . Here we focus on the GOES ABI Fire Detection and Characterization (FDC) product (Schmidt et al. Citation2020), which builds upon the heritage of the Wildfire Automated Biomass Burning Algorithm (WF_ABBA) first developed in the early 1990s, and the FRP-PIXEL product first generated for MSG SEVIRI with the Geostationary Fire Thermal Anomaly (FTA) algorithm (Roberts and Wooster Citation2008; Wooster et al. Citation2015), but now includes the ABI- and AHI-based versions of the FRP-PIXEL product generated using an adaptation of the FTA algorithm. The growing use of these data in online multi-satellite fire monitoring systems (e.g. NOAA’s Hazard Mapping System (HMS) [https://www.ospo.noaa.gov/Products/land/hms.html#maps] and NASA’s Fire Information for Resource Management System (FIRMS) US/Canada [https://firms2.modaps.eosdis.nasa.gov/usfs/]) makes it particularly important to document and compare the characteristics and performance of these data sets.
Here we evaluate the geostationary FDC and FRP-PIXEL active fire products against near-simultaneous Landsat active fire reference maps. A previous Landsat-based evaluation of the NOAA GOES-16/ABI FDC and the MSG SEVIRI FRP-PIXEL product performances was undertaken for the year 2018 over their respective hemispheric-disks (Hall et al. Citation2019). The results of our initial validation not only highlighted important issues regarding the respective detection algorithms, but also demonstrated nontrivial differences between the seemingly complementary FDC and FRP-PIXEL products. Since the 2018 validation effort, various changes were made to the GOES-16 FDC product in particular (see Section 2.1) that necessitate this updated product accuracy assessment, as well as the subsequent availability of the GOES-17 ABI FDC product (in August 2018) and operational FRP-PIXEL products for the GOES-16/17 and Himawari-8 disks (Xu et al. Citation2021).
We begin with an overview of the two active fire products (Section 2; Supplementary Table SA), followed by an updated seasonal validation and quality assessment over the GOES-16, GOES-17, and Himawari-8 hemispheric-disks (Section 3). Analysis of the ABI FDC product from the most recently launched GOES-18 satellite, positioned near the current GOES-17 orbital location, is not included in this study. Finally, we summarize our findings and conclude with future directions and provide guidance on using these geostationary data in a global context (Section 4).
2. Geostationary active fire products
2.1. Fire Detection and Characterization (FDC) Product
The 2-km NOAA ABI FDC product (Schmidt et al. Citation2020) is generated using an algorithm that builds on that first used to generate the GOES WF_ABBA products made fully operational in 2002 (Justice et al. Citation2002; Prins et al. Citation1998; Prins and Menzel Citation1992; Schmidt Citation2020). ABI FDC data are acquired every 10 minutes for the entire disk, every 5 minutes for the conterminous U.S. (CONUS; GOES-East) or Pacific US (PACUS; GOES-West) sectors, and every 30–60 seconds for the mesoscale sector (GOES-R Citation2021). Prior to April 2019 the temporal resolution of the full disk products was 15 minutes. Fire pixel locations are not terrain-corrected, but rely on the standard ABI navigation which utilizes a GRS80 ellipsoid (NOAA Citation2019). This introduces a positioning error relative to other platforms that can be on the order of several kilometres depending on terrain elevation and view zenith angle. For the assessment conducted herein we used the FDC 10-minute full disk product for both the GOES-16 and 17 satellites, and adjusted the matching distance to the reference Landsat-based active fire data to account for the data navigation offset (see Section 3.1).
The FDC product includes active fire pixel locations along with sub-pixel fire characteristic information (e.g. fire radiative power; FRP), and other pixel-level metadata. The pixel-level metadata classification system denotes the various levels of confidence as a function of the processing conditions as well as fire pixel persistence. Two mirroring sub-groups are identified in association with fire pixel classes 10–15 and 30–35 (). The former defines instantaneous (first/single) fire detections whereas the latter identifies temporally-filtered cases when two or more co-located detections are observed within a 12-hour interval when compared against a mask containing fires since NaN Invalid Date (Schmidt et al. Citation2020). The highest confidence fire pixels are assigned classes 10/30, whereas classes 11/31 identify a saturated fire pixel, and classes 12/32 define a potential cloud-contaminated fire pixel. The remaining fire pixel classes describe lower overall confidence levels, with decreasing probability of actual fire confirmation as we progress from classes 13/33 to classes 14/34 and 15/35 (Schmidt et al. Citation2020). The metadata also flags which pixels were not processed due to their surface type, the presence of opaque clouds, and/or block-out zones near the sub-solar point and near where the satellite and solar zenith angles are equal.
Table 2. FDC fire pixel class definitions (Schmidt Citation2020).
The product requirements for the FDC were driven by the needs of the WF_ABBA’s broad user base that utilizes the data in different ways and thus has varying requirements for accuracy and varying tolerances for false positives. In particular, lower probability active fire pixel classes (13/33–15/35) typically represent relatively weak and/or ambiguous fire signals, but can also include image features most commonly caused by reflections from clouds or the ambient land surface – leading to higher false alarm rates in those cases (see Hall et al. Citation2019 for examples).
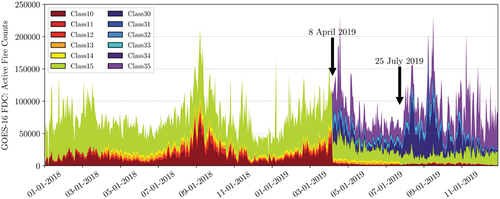
Since our previous accuracy assessment (Hall et al. Citation2019), several improvements have been made to the FDC algorithm. Readers are referred to (Hall et al. Citation2019) to understand the performance of the FDC product prior to April 2019, when the first change was applied to the data stream. The effects of this and additional subsequent changes can be seen in the time series of fire pixel classes (). At present, the FDC product has not been re-processed with the most up to date algorithm. The FDC product metadata unfortunately do not provide publicly interpretable information about product and algorithm changes (e.g. version number), thus users should be cautious when undertaking longer-term time series analysis with these data. For the GOES-16 FDC processing stream, the first distinct change occurred on 8 April 2019, when the temporally-filtered fire pixel classes 30–35 began appearing in the FDC product (previously such classes could not occur due to a software error). The next distinct change occurred on 25 July 2019 as a result of targeted algorithm tuning. On 23 October 2020, an additional GOES-17-specific update was implemented in the FDC product to mitigate the loop heat pipe (LHP) subsystem anomaly causing degradation of infrared channels on the ABI sensor. Given that this algorithm adjustment was made after our initial 2020 analysis, we opted to regenerate the affected GOES-17 FDC product using an internal-NOAA version of the FDC algorithm (August 2022) over our 2020 validation periods in order to capture the impact of the recently implemented changes. Until NOAA can reprocess the full ABI archive, there is no way to revalidate the current FDC product without amassing an entirely new Landsat-8 validation reference data set (see Section 3). Therefore, although this 2020-reprocessed version (hereafter referred to as 2020 R) is not the operational data product, it is still representative of its performance. Given the similarities in algorithm performance between the original 2020 FDC and the reprocessed 2020 R FDC outputs, the majority of the results will highlight the performance of the 2020 version (official operational algorithm) with the pertinent 2020 R results included in the supplementary material.
Figure 2. GOES-16 FDC algorithm changes resulted in two abrupt discontinuities in the FDC active fire product: 8 April 2019 and 25 July 2019. There were no noticeable discontinuities in the FDC classes after July 2019. See Table 2 for class definitions.
2.2. Fire radiative power (FRP-PIXEL) products
The EUMETSAT Satellite Application Facility for Land Surface Analysis (LSA-SAF) has generated the Meteosat FRP-PIXEL product operationally every 15 minutes across the full SEVIRI disk (see ) since early in the MSG mission. The product is produced using an updated and operational implementation of the Fire Thermal Anomaly (FTA) algorithm of Roberts and Wooster (Citation2008), described in Wooster et al. (Citation2015), and the archive of MSG SEVIRI data back to 2004 has also been reprocessed using the current operational FTA algorithm. These data are available from the EUMETSAT LSA-SAF (https://landsaf.ipma.pt/en/), along with a near real-time version generated from the MSG-8 Indian Ocean coverage data stream (not included here because of its non-operational status at the time of this work). The same FTA algorithm has been more recently adapted to operationally generate FRP-PIXEL products from both Himawari-8 AHI (see Xu et al. Citation2017) and GOES-16 and 17 ABI (see Xu et al. Citation2021). The AHI and ABI FRP-PIXEL products are available through the Copernicus Atmosphere Monitoring Service (CAMS) via a server at the Portuguese Institute for the Ocean and Atmosphere (IPMA): safmil.ipma.pt (193.137.20.100; email [email protected] for access).
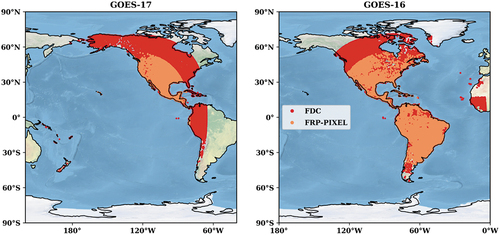
The key outputs included in the AHI and ABI FRP-PIXEL products are the same as those of the original MSG FRP-PIXEL product, except the spatial and temporal resolutions have improved from 3-km/15-minute full disk (MSG SEVIRI) to 2-km/10-minute full disk (ABI and AHI) [resolutions quoted at the sub-satellite points]. The product includes active fire characteristics (e.g. FRP) and quality metrics such as fire detection confidence levels ranging from 1–100% (see Wooster et al. Citation2015; Roberts et al. Citation2015 for full details). Here we classify FRP-PIXEL active fire pixels as either low (≤50%) or high (>50%) confidence. One key difference currently in the FRP-PIXEL products compared to the FDC product is the smaller (65° versus 80°) view zenith angle (VZA) cut-off. This prevents use of the very large area pixels that occur towards the edge of the geostationary disk within which it is difficult to detect active fires and where false alarm rates seem likely to increase. These different angular thresholds result in a smaller mapped area for the FRP-PIXEL products generated from GOES ABI compared to the matching NOAA GOES FDC product (see ).
Figure 3. July 2020 FDC (all classes) and FRP-PIXEL (all confidence) active fire points within the GOES-17 (left) and GOES-16 (right) hemispheric disks. The smaller mapping extent of the FRP-PIXEL product compared to the FDC product is accentuated over North America. Fire pixel symbology is enlarged for clarity.
A second key difference of the FRP-PIXEL products compared with FDC for the period of evaluation is the higher proportion of missing or corrupt data within the FRP-PIXEL product caused by occasional problems related to the input data acquisition by IPMA. At the time of writing, the Himawari-8, GOES-16 and GOES-17 FRP-PIXEL products have an extended data gap between 8 April 2020 and 13 May 2020. Comparing the FRP-PIXEL and FDC products for GOES-16 in 2020 for example, the FRP-PIXEL contained 13% missing/corrupt data compared to only 0.4% for FDC.
It is also worth considering the different philosophies underlying the FTA and FDC algorithms. As alluded to in Section 2.1, a distinct subset of operational FDC-product users wish to have every possible pixel in which an active fire might be present flagged in the product, even if this results in a high false alarm rate. Ideally such pixels would be identified as a ‘low probability’ FDC active fire pixel class (). This contrasts with the FTA algorithm, whose intention is to be sensitive to fires with as low an FRP as possible without inducing high levels of false alarms, even in the low confidence active fire pixel class. Furthermore, it is known that the cloud mask used by the Meteosat FRP-PIXEL product processing chain (the universal Meteosat SEVIRI cloud mask applied to all LSA SAF products) is rather cloud sensitive, and though a few tests have been de-activated for the active fire application (Wooster et al. Citation2015) of this mask, it is the source of some failed active fire detections in conditions where a detection could otherwise have successfully taken place (see Freeborn et al. Citation2014 for details). The FTA algorithm applied to the GOES ABI and Himawari AHI include internal cloud masking tests, which are simpler and less cloud-sensitive than that used in the MSG SEVIRI processing (see Xu et al. Citation2017, Citation2021). Thus, the ABI and AHI FRP-PIXEL products often contain active fire detections in comparatively cloud-free pixels that would likely be masked as cloud in the MSG version.
3. Coincident Landsat-8 validation
3.1. Landsat validation overview
As with the previous validation effort of Hall et al. (Citation2019), the reference active fire data for the geostationary product assessment were derived from 30-m near-coincident (±5 minutes of geostationary overpass time) Landsat-8 Operational Land Imager (OLI) imagery. Individual OLI scenes were processed to extract active fire information using the Schroeder et al. (Citation2016) Landsat-8 OLI automated fire detection algorithm. The algorithm is primarily driven by the fire-sensitive band 7 (shortwave infrared; 2.11–2.29 µm) with daytime retrievals incorporating OLI bands 1–6. Despite its proven use in active fire detection applications, existing Landsat-class sensors are largely unsuitable for FRP retrieval due to the limited dynamic range, leading to high fire-pixel saturation rates, and the inadequate spectral band placement. Therefore, this validation study focuses on the active fire detection and not FRP retrievals.
The validation was conducted over two time periods (based on the availability of the FRP-PIXEL products) to further understand any seasonally varying active fire detection performances: 1 January 2020–31 March 2020 (henceforth referred to as the northern hemisphere (NH) winter) and 1 July 2020–30 September 2020 (henceforth referred to as NH summer). The FDC product was available for the GOES-16 and GOES-17 disks over both seasonal periods, while the more recent FRP-PIXEL products for GOES and Himawari were only available for the GOES-16 disk over both seasonal validation periods and from 2 March 2020 for the GOES-17 and Himawari-8 disks. Therefore, the FRP-PIXEL was only validated over the NH summer period for GOES-17. Overall, 52338 reference Landsat-8 scenes were used in the seasonal validations ().
Table 3. Coincident Landsat-8 validation summary information.
For the purpose of this analysis, ‘fire pixels’ are defined as the active fire pixels each product reports as burning at the time the observation was made. Due to optical diffraction, the difference between the field of view of individual detector elements and the spacing between sampling, and the remapping applied to place ABI, AHI, and SEVIRI data onto a pre-defined navigational ellipsoid, the heat signatures for fires are typically visible in more pixels than the fire actually occupies on the ground.
As with our previous validation effort (Hall et al. Citation2019), a variable distance buffer (Equation 1) was applied to each validation fire pixel.
Where, a is fire pixel area. This threshold gave a more relaxed true positive definition, i.e. a fire pixel which contained either a reference fire pixel within the effective ABI or AHI pixel bounds or within the distance buffer d. A false alarm, or false positive, is an FDC or FRP-PIXEL fire pixel that did not contain any reference fire activity. For the geostationary product intercomparison, a view-zenith angle (VZA) threshold of 65° was applied to the FDC product to match that of the FRP-PIXEL products used herein. Validation analyses were also carried out over the full disk area when applicable. For example, we compare the results from this 2020 NH summer validation period with the previous 2018 validation effort (18 July and 30 September 2018; Hall et al. Citation2019) to quantify any improvements in the updated FDC product produced over the full GOES-16 disk (see Section 3.2.1).
3.2. Active fire detection curve
To facilitate the intercomparison between the FDC and FRP-PIXEL detection rates, it was assumed that each Landsat-8 OLI reference fire pixel corresponded to a 900 m2 active fire area (i.e. the OLI pixel is completely filled with fire). However, Landsat OLI can detect fires as small as ~1 m2 (Schroeder et al. Citation2016; theoretical probability of OLI channel 7), so many and perhaps most Landsat OLI detected fires have no chance of being detected by the geostationary products (for which detection require hundreds of square metres of burning vegetation). Nevertheless, whilst the assumption of a 900 m2 fire within the OLI pixel may not be correct in most cases, it does enable a basic metric of fire fractional area to be calculated based on the geostationary sensor’s effective pixel footprints (see Hall et al. Citation2019 for details). Quantifying the detection rate as a function of fire fractional area helps normalize the results from the differing geostationary active fire products (which have different pixel sizes).
3.2.1. FDC GOES-16 comparison with 2018 validation
We first examine the performance difference between the 2018 validation of GOES-16 and that found herein, thus highlighting the effect of the algorithm changes detailed in Section 2.1. shows the GOES-16 full disk area detection rate curves for the FDC 2018 NH summer validation (black/light grey), 2020 NH summer validation (red/dark grey), and the reprocessed 2020 R NH summer validation (blue line) active fire products. The detection rates are shown as a function of relative fractional area covered by active fire (as calculated from the OLI-derived active fire detections). Since an active fire pixel becomes feasibly detectable if the flaming fire covers around 1/10000th (0.1%) of the pixel area (Wooster et al. Citation2021) the graph in starts at this x-axis value. However, it should be remembered that in reality the Landsat OLI pixels themselves will mostly not be covered by active fire either – so in reality a value of 0.1% on the x-axis would represent a lower fire coverage in the geostationary active fire pixel.
Figure 4. GOES-16 full disk area active fire detection rates for the 2018 NH summer validation FDC (black line; Hall et al. Citation2019), the 2020 NH summer validation FDC (red line), and the reprocessed 2020 R NH summer validation FDC (blue line) active fire products as a function of the relative fractional area within each GOES-16 pixel that were mapped as fire by Landsat-8. It was assumed each individual Landsat-8 OLI reference fire pixel corresponded to a 900 m2 active fire area (i.e. the OLI pixel was completely filled by fire), which we accept is unlikely in many cases. The number of FDC pixels sampled are represented on a log scale by overlapping columns: 2018 (light grey) columns are in the foreground, while 2020 (dark grey) columns are in the background. For visualization purposes, the reprocessed 2020 R FDC pixels are not shown as the columns were essentially identical to the 2020 FDC pixels.
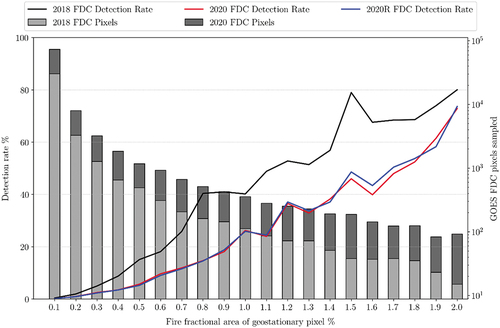
The detection rate curves shown in use all FDC active fire classes (Classes 10–15 and 30–35; see for class descriptions), and highlight the higher active fire omission error of the updated, and more conservative, FDC algorithm. Conversely, as shown in Section 3.3, the updated algorithm has led to lower false alarm rates compared to the 2018 analysis. Finally, the GOES-16 full disk 2020 and 2020 R FDC detection rates are very similar, which is unsurprising given the FDC algorithm changes only impacted GOES-17 detection rates.
Analysis of the proportional differences between the NH summer 2018 and NH summer 2020 periods shown in found a general tendency towards more non-fire FDC classes containing reference Landsat-detected active fire pixels in the updated product compared to 2018, which again was indicative of higher omission error rates. Specifically, the proportion of FDC non-fire pixels (class 100; defined as ‘processed region of image’ in Schmidt et al. Citation2020) with at least one coincident Landsat reference fire pixel increased by 4% from 2018 (84%) to 2020 (88%). Raising the minimum fire threshold to at least 75 coincident Landsat reference fire pixels found the number of FDC non-fire pixels with fire activity increase by 8% from 23% (2018) to 31% (2020).
3.2.2. FDC & FRP-PIXEL 2020 comparison
The GOES-16 seasonal validation () is the only analysis to contain FDC and FRP-PIXEL results for both time periods in 2020, since GOES-17 and Himawari-8 FRP-PIXEL product processing had not yet commenced during the NH winter validation period. Despite the decrease in the FDC detection rate compared to the 2018 results, across the matching disk areas the FDC product continues to identify more Landsat-8 reference fire pixels than the FRP-PIXEL product when including all classes and confidence levels, while exhibiting comparable detection rates when only using the high confidence FDC classes (classes 10/30 and 11/31; grey line). This difference however comes at the expense of higher false alarm rates than the FRP-PIXEL product (see Section 3.3).
Figure 5. 1 January–31 March 2020 (NH winter; top row) and 1 July–30 September 2020 (NH summer; bottom row) active fire detection rates for FDC all classes (red line), FDC high confidence classes (Class 10/30 and Class 11/31; grey line), and FRP-PIXEL all confidence (blue line) active fire products for GOES-16, GOES-17, and Himawari-8 disks as a function of relative fractional area covered by fire (according to the OLI-derived active fire data). The dashed red and grey lines indicate the range of fire fractions over which the GOES-17 detection rate was not well quantified due to a lack of samples. The detection rates have been calculated over the matching common mapped area processed by both products. It was assumed the individual Landsat-8 OLI reference fire pixels corresponded to a 900 m2 fire area. The reprocessed 2020 R FDC detection rates were essentially identical to the original 2020 version (red and grey lines) and are therefore not shown.
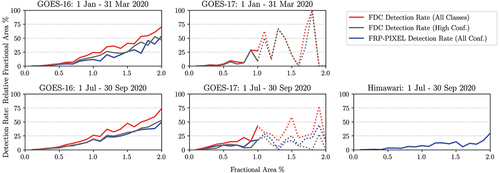
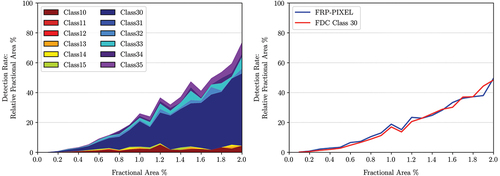
Partitioning the overall FDC detection rates by class and comparing with the FRP-PIXEL detection curve over their matching areas (<65° VZA) shows that differences in detection between the two active fire products are indeed related to FDC’s lower confidence fire pixel classes (). Specifically, the FRP-PIXEL active fire detection rate is almost identical to the FDC class 30 detection rate (; right). This is unsurprising, since the 2018 validation results found that the original FRP-PIXEL product over the MSG SEVIRI disk was more conservative than the GOES FDC product, albeit with a far lower active fire detection false alarm rate (Hall et al. Citation2019).
Figure 6. (Left) Breakdown of the GOES-16 NH summer detection rate as a function of relative fraction area by FDC class and; (right) a comparison between the FDC Class 30 (red line) with the GOES-16 FRP-PIXEL (blue line) detection rate over the commonly mapped area (ABI pixel area is less than 16km2 or <65° VZA). See for FDC fire pixel class descriptions.
Based on the detection rate analysis, we urge caution when using the FDC product before 25 July 2019. Although the detection rate is higher than later years, the earlier time period is subject to very high false alarm rates (Hall et al. Citation2019). Further, if users require a more conservative algorithm, then the FRP-PIXEL product or a filtered FDC product (high-confidence classes only) is recommended.
3.3. False alarm rates
The seasonal false alarm (active fire errors of commission) per disk over the < 65° VZA area are shown in (see Supplementary Tables SB , SC, and SD for full summary validation results). The FDC false alarm rates have been partitioned by class, and in addition grouped by confidence for easier comparison with the FRP-PIXEL confidence categories. Here All Classes combines all FDC fire classes, Low Conf Classes includes classes 12–15 and 32–35, and High Conf Classes includes classes 10–11 and 30–31.
Figure 7. GOES-16 FDC and FRP-PIXEL false alarms (commission error) over the < 65° VZA area: NH winter 2020 (1 January–31 March 2020; left) and NH summer 2020 (1 July–30 September 2020; right). See for FDC fire pixel class descriptions. High confidence active fire pixels dominate the FRP-PIXEL product output, and over the period of the study the FRP-PIXEL GOES-16 ABI product contained 7× more high confidence than low confidence pixels. Conversely, the FDC product contained 3× more low confidence fire pixels compared to the high confidence ones. The black bars highlight the FDC ‘All Classes’ and FRP-PIXEL ‘All Confidence’ false alarm rates.
In the updated FDC algorithm, the lowest confidence class (15/35) and cloud contaminated class (12/32) continue to show rather high rates of false alarms across both seasons and GOES disks (; see Figure S1 and S2 for 2020 R FDC results), although the number of class 15 pixels has markedly decreased since the 2018 validation. In Hall et al. (Citation2019), of the 4,182 class-15 active fire pixels included in the GOES-16 FDC product, almost all detections (95%) were in fact false alarms – whereas now the value is lower – albeit still the vast majority (68% for GOES-16 NH Summer 2020 [] and 56% for reprocessed GOES-16 NH Summer 2020 R [Figure S1b]). This decrease is also visible in . Directly comparing the FDC ‘All Classes’ false alarm rate to the FRP-PIXEL ‘All Confidence’ false alarm rate, we see a 1.8× higher false alarm rate for FDC in winter () and a 2.7× higher FDC false alarm rate in summer () compared to the FRP-PIXEL product.
Figure 8. GOES-17 FDC and FRP-PIXEL false alarms (commission error) over the < 65° VZA area: NH winter 2020 (1 January–31 March 2020; left) and NH summer 2020 (1 July–30 September 2020; right). FRP-PIXEL was unavailable for the NH winter 2020 validation. See section 2.1 for FDC fire pixel class descriptions. High confidence active fire pixels dominate the FRP-PIXEL product output, and over the period of the study the FRP-PIXEL GOES-16 ABI product contained 7× more high confidence pixels than low confidence ones. Conversely, the FDC product contained 20× more low confidence fire pixels compared to the high confidence ones. The black bars highlight the FDC ‘All Classes’ and FRP-PIXEL ‘All Confidence’ false alarm rates.
The GOES-17 disk contains mostly ocean, whilst the land coverage is primarily towards the disk edges. Thus, as expected, the GOES-17 FDC product contained fewer validation pixels compared to GOES-16, especially in the NH winter analysis. The FDC product also shows very high false alarm rates, higher than 50% for most classes (), albeit at small sample sizes since there are not that many detectable active fires at such high latitudes (see Supplementary Figure S2). The pixel sizes are also larger in the fire-prone regions that are imaged by both GOES-17 and 16 (e.g. California, U.S.A.) and thus fires are more likely to either be missed completely or misclassified. The FRP-PIXEL product for GOES-17 has a false alarm rate less than half that of the FDC product when considering all categories of active fire pixel, and around half that when just considering the high confidence FDC pixels ().
Based on additional analysis of the GOES-16 and GOES-17 FDC product, it was clear that the mid-morning Landsat-based reference validation samples did not capture all the possible viewing scenarios including sub-daily and/or seasonal variation in solar angles and land/water surface warning/cooling. For example, the low false alarm rates in FDC Class 13/33 were likely underrepresented (see Supplementary Figure S3), and therefore users are encouraged to visually examine the active fire pixels before analysis as class-specific filtering won’t necessarily remove all the false alarms.
The FRP-PIXEL product was the only available product over the Himawari-8 AHI disk and was only available for the NH summer analysis (). Since the peak fire activity within the AHI disk occurs in January and February, and the FRP-PIXEL product was not available during that period for 2020, the validation is quite possibly not representative of the major burning period. The false alarm breakdown by mapping confidence for the Himawari FRP-PIXEL product is very similar to the GOES FRP-PIXEL product results – with a high confidence (High Conf (51–100)) active fire pixel false alarm rate of ~ 4%.
Figure 9. Himawari-8 AHI FRP-PIXEL false alarms (commission error): NH summer 2020 (1 July–30 September 2020). The FRP-PIXEL product was unavailable for the NH winter 2020 validation. High confidence active fire pixels dominate the FRP-PIXEL product output, and over the period of the study the FRP-PIXEL AHI product contained 5× more high confidence than low confidence active fire pixels. The black bar highlights the FRP-PIXEL ‘All Confidence’ false alarm rate.
A comparison of the active fire pixel counts (; left) and the proportion of high confidence fire pixels (; right) within both FDC and FRP-PIXEL products across the three hemispheric disks showed that even after removing classes 15 and 35 from the FDC product (black line), the FRP-PIXEL product had consistently higher proportions of high confidence fire pixels than the FDC products (i.e. a greater proportion of the active fire pixels detected by the FTA algorithm were denoted as having ‘high confidence’ than the FDC fire pixels). Although some of the Low Conf (1–50) FRP-PIXEL active fire false alarm rates were quite high (e.g. 30% false alarm rate for the Himawari-8 AHI low confidence fires; ), the vast majority of FRP-PIXEL active fire detections are associated with high confidence classes (i.e. confidences over 50%).
Figure 10. Daily active fire pixel count (left) and the proportion of high confidence fire pixels (right) in 2020 for the GOES-16 (top), GOES-17 (middle), and Himawari-8 (bottom) FDC (red and black) and FRP-PIXEL (blue) products. The FDC product has been subdivided into all fire classes (red) and all fire classes excluding Class 15/35 (black) due to the high false alarm rate of the lowest confidence class – see for FDC fire pixel class descriptions. The high confidence fire pixels refer to FDC Class 10/30 and Class 11/31 and FRP-PIXEL fire confidence values 51%–100%. Note the log scale on the y-axis of the GOES-17 fire pixel count (middle left).
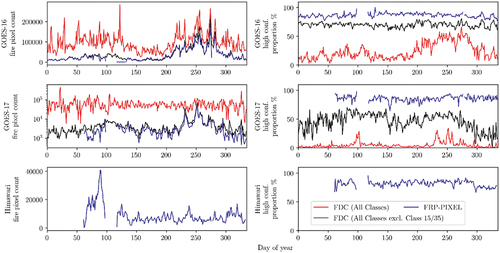
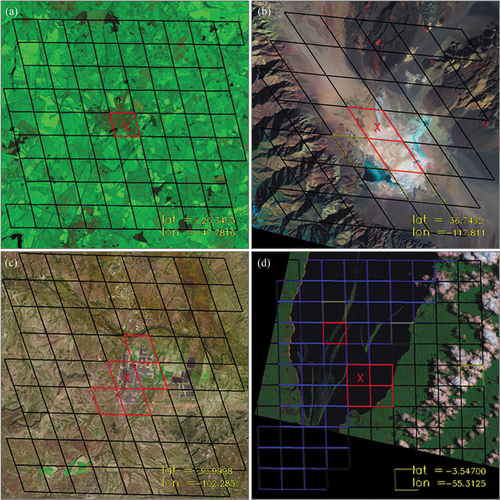
Figure 11. (a) FDC GOES-16 urban false alarm in Brazil; (b) FRP-PIXEL GOES-16 bare ground false alarm in California; (c) FDC GOES-16 solar farm false alarm in Texas; (d) FRP-PIXEL GOES-16 water mask false alarm in Brazil. Red grid cells represent pixels identified as fire, blue represents pixels identified as water/invalid ecosystems, white represents clouds, yellow represents blocked-out pixels, and black represents pixels identified as clear land. The coordinates of the pixel centre represent the grid cell marked with a red ‘×’.
Analysis of the active fire detection rates between the FRP-PIXEL and FDC products for GOES-16 and GOES-17 for 2020 resulted in convergence in the frequency of active fire detection between the two products once FDC classes 15 and 35 (which have, along with some other classes, high false alarm rates [) were removed (; left). This was especially true over the GOES-17 hemispheric disk. For users seeking the lowest false positive rate, we recommend excluding the lowest confidence classes from any analysis. Here, classes 15 and 35 were a primary focus as they contained a higher proportion of validation pixels compared to other low confidence classes. In addition, as seen in the 2018 validation analysis, the FRP-PIXEL product continues to show significantly lower levels of false alarms as compared to the FDC product when all classes from both products are considered ().
Finally, analysis of the FDC product in areas beyond the 65° VZA FRP-PIXEL cut-off found very low active fire detection rates (see Supplementary Figure S4) and very high false alarm rates in the small number of validation pixels available here (see Supplementary Tables SE – SG). The larger mapping extent of the FDC product compared to the FRP-PIXEL product () consequently does not yield significantly more active fire detections, and little useful information.
3.4. Land and cloud cover error analysis
To study the impact of land cover on the geostationary active fire product performance, the 2019 MODIS Vegetation Continuous Fields Collection 6 (DiMiceli et al. Citation2017; Hansen et al. Citation2002) data layer was used to estimate the average tree cover percentage for a 20 km × 20 km area centred on the corresponding geostationary active fire pixel location (see Hall et al. Citation2019 for details). A breakdown of the false alarms as a function of percentage tree cover alongside a visual inspection of the validation data output revealed several systematic issues within the FDC and FRP-PIXEL products (see Supplementary Figures S5 – S7). There has been a drastic improvement in the FDC false alarms compared to the 2018 validation. For example, in the 2018 validation, the GOES-16 FDC product suffered from large patches of daytime false alarms over bright desert soil, leading to an almost 100% commission error (out of 3340 validation pixels) in areas with 0–10% tree cover (Hall et al. Citation2019); under the present validation effort the commission error rate in this tree-cover category has dropped to 30% commission error (out of 46 validation pixels). The reduction in the number of pixels used in the analysis is a direct result of the lack of spurious fire pixels in the updated FDC product, however these large swaths of false alarms over desert regions are still present outside the temporal scope of this validation exercise.
Several patterns have also emerged during the visual analysis of the validation Landsat scenes across all three hemispheric disks. During the NH winter, the warmer urban areas triggered false alarms mainly within the FDC product (), whereas the FRP-PIXEL product misclassified some bare ground – although not to the same extent as the 2018 FDC NH summer product (). Late August through September saw an uptick in false alarms in both products, including confusion with solar farms (), while water mask issues were seen in both products throughout the NH summer (). A continued pattern seen in the 2018 validation was the Meteosat FRP-PIXEL’s overzealous cloud mask compared to the FDC product (see Supplementary Figure S8) – something noted by Freeborn et al. (Citation2014) and introduced in Section 2.2. Although the GOES-16, GOES-17, and Himawari-8 versions of the FRP-PIXEL products use their own internal cloud masks – designed to be less strict than the external SEVIRI-based mask used by all products generated by the LSA SAF (Freeborn et al. Citation2014) – even these internally-generated cloud masks sometimes restrict the ability of the FTA algorithm to map fires when applied to ABI and AHI data.
4. Summary and conclusion
We present a validation assessment of a series of key operational geostationary active fire products (GOES-16 and–17 FDC, and FRP-PIXEL from GOES-16 and–117, and Himawari AHI). Our reference data are coincident Landsat-8 OLI active fire detections over two seasonal time periods: 1 January 2020–31 March 2020 and 1 July 2020–30 September 2020. We validated the FDC product from 2020 and a more up-to-date internally reprocessed version (2020R FDC) over the GOES-16 and GOES-17 disks, and compared these results to our previous 2018 validation study (Hall et al. Citation2019). We also assessed the GOES-16, GOES-17, and Himawari-8 FRP-PIXEL products produced using the FTA algorithm that was originally developed for MSG SEVIRI (Wooster et al. Citation2015).
Our updated 2020 (and reprocessed 2020R FDC algorithm) validation shows a marked improvement in false alarm rates for the updated GOES-16 FDC product compared to the results obtained in 2018 for the former version. However, they have also demonstrated the difficulties associated with applying an algorithm designed for one hemispheric-disk to another. The 2018 and 2020 accuracy assessments however still suggest that FDC product classes 15/35 (low probability fire pixels) have very high active fire detection commission errors (i.e. very high rates of false alarms). Removal of FDC classes 15/35 resulted in convergence of the active fire counts and detection rates between the FDC and FRP-PIXEL products. We also found comparable false alarm rates derived from higher confidence pixels between the two products (4–7% FDC and 2–6% FRP-PIXEL), yet the FRP-PIXEL product contained 5–7× more high confidence fire pixels than low confidence fire pixels over the study period. Conversely, the FDC product was dominated by low confidence fire pixels with 2× (GOES-16) and 20× (GOES-17) more low confidence fire pixels then high confidence pixels. Further, analysis of the smaller mapping area (<65° VZA) of the FRP-PIXEL product compared to FDC found this restriction was not a detriment to mapping fire pixels, since the > 65° VZA area in the FDC product contained few active fire detections and many of them were false alarms.
The results of our validation effort have highlighted some important issues within both the FDC and FTA algorithms when applied to the geostationary data sources used herein. We have also demonstrated differences and complementarities for the FDC and FRP-PIXEL products generated from the same ABI source data. For example, if users require data with minimal false alarms then the more conservative FRP-PIXEL products generated from GOES-16 and −17 might be the better option than the FDC products, since even the low confidence FRP-PIXEL active fire pixels have rather low false alarm rates. However, users having a higher tolerance for false positives in the GOES disk may find that the FDC product is the better option (albeit with care being needed since some fire pixel classes have false alarm rates exceeding 50%), which also in the periods tested has fewer data dropouts, and exists with a longer time series (but noting the discontinuities apparent in ). Users wanting coverage outside of the area of the GOES disk (covering the America’s) should also opt for the FRP-PIXEL products, since these cover Africa, Europe and Asia as well as the Americas (see ).
The Landsat-based validation presented here ultimately needs to be extended to include the broad range of observing and environmental conditions impacting the performance of the products. Options include validation against opportunistic independent reference data from airborne or ground-based platforms and intercomparison with higher resolution fire products from operational polar orbiting satellites that sample different local times (e.g. VIIRS I-band products on the S-NPP and JPSS satellite series). Further, an intercomparison between MODIS and VIIRS FRP retrievals and the GEO data would provide additional insight into the respective geostationary active fire algorithms and is an important future step in understanding the strengths of each product.
Refinement of the operational NOAA GOES FDC product continues. Work is underway to implement explicit terrain correction and persistent anomaly flags in the output of the baseline product. Additional algorithm improvements are also tested and implemented to further reduce false alarm rates and omission errors. NOAA is also working on improving the delivery of the FDC fire information through customized and tailored products to maximize impact on decision making and to better serve user needs.
Supplemental Material
Download MS Word (1.5 MB)Acknowledgements
We thank the NASA FIRMS team for providing online product visualization and B. Quayle (US Forest Service) for assisting with product quality assessment. We also thank Dr. Weidong Xu (King’s College London) for his help accessing and understanding the FRP-PIXEL product.
Disclosure statement
The authors declare that they have no known competing financial interests or personal relationships that could have appeared to influence the work reported in this paper.
Data availability statement
The geostationary fire data used in this study are available from NOAA’s Comprehensive Large-array Data Stewardship System (CLASS; https://www.avl.class.noaa.gov/saa/products/welcome), NOAA’s Open Data Dissemination system (NODD; https://www.noaa.gov/information-technology/open-data-dissemination), and EUMETSAT’s LSA SAF (https://landsaf.ipma.pt/en/).
Supplementary material
Supplemental data for this article can be accessed online at https://doi.org/10.1080/01431161.2023.2217983.
Additional information
Funding
References
- Baldassarre, G., L. Pozzoli, C. C. Schmidt, A. Unal, T. Kindap, W. P. Menzel, S. Whitburn, et al. 2015. “Using SEVIRI Fire Observations to Drive Smoke Plumes in the CMAQ Air Quality Model: A Case Study Over Antalya in 2008.” Atmospheric Chemistry & Physics 15 (14): 8539–8558. doi:10.5194/acp-15-8539-2015.
- Davies, D. K., S. Ilavajhala, M. M. Wong, and C. O. Justice. 2008. “Fire Information for Resource Management System: Archiving and Distributing MODIS Active Fire Data.” IEEE Transactions on Geoscience & Remote Sensing 47 (1): 72–79. doi:10.1109/TGRS.2008.2002076.
- DiMiceli, C. M., M. L. Carroll, R. A. Sohlberg, C. Huang, M. C. Hansen, and J. R. G. Townshend. 2017, V. 006. https://modis.gsfc.nasa.gov/data/dataprod/mod44.php. Last accessed 1/18/2023.
- ESRI Disaster Response Program: “Wildfires”. 2021. https://www.esri.com/en-us/disaster-response/disasters/wildfires. Last accessed 1/18/2023.
- Eva, H., and S. Flasse. 1996. “Contextual and Multiple‐Threshold Algorithms for Regional Active Fire Detection with AVHRR Data.” Remote Sensing Reviews 14 (4): 333–351.
- Freeborn, P. H., M. J. Wooster, G. Roberts, B. D. Malamud, and W. Xu. 2009. “Development of a Virtual Active Fire Product for Africa Through a Synthesis of Geostationary and Polar-Orbiting Satellite Data.” Remote Sensing of Environment 113 (8): 1700–1711. doi:10.1016/j.rse.2009.03.013.
- Freeborn, P. H., M. J. Wooster, G. Roberts, and W. Xu. 2014. “Evaluating the SEVIRI Fire Thermal Anomaly Detection Algorithm Across the Central African Republic Using the MODIS Active Fire Product.” Remote Sensing 6 (3): 1890–1917. doi:10.3390/rs6031890.
- Giglio, L. 2007. “Characterization of the Tropical Diurnal Fire Cycle Using VIRS and MODIS Observations.” Remote Sensing of Environment 108 (4): 407–421. doi:10.1016/j.rse.2006.11.018.
- Giglio, L., W. Schroeder, and C. O. Justice. 2016. “The Collection 6 MODIS Active Fire Detection Algorithm and Fire Products.” Remote Sensing of Environment 178: 31–41. doi:10.1016/j.rse.2016.02.054.
- GOES-R. 2021. “Advanced Baseline Imager Scan Mode Information”. https://www.goes-r.gov/users/abiScanModeInfo.html. Last accessed 1/19/2023.
- Hall, J. V., R. Zhang, W. Schroeder, C. Huang, and L. Giglio. 2019. “Validation of GOES-16 ABI and MSG SEVIRI Active Fire Products.” International Journal of Applied Earth Observation and Geoinformation 83: 101928. doi:10.1016/j.jag.2019.101928.
- Hansen, M. C., R. S. DeFries, J. R. G. Townshend, L. Marufu, and R. Sohlberg. 2002. “Development of a MODIS Tree Cover Validation Data Set for Western Province, Zambia.” Remote Sensing of Environment 83: 320. doi:10.1016/S0034-4257(02)00080-9.
- Justice, C. O., L. Giglio, S. Korontzi, J. Owens, J. T. Morisette, D. Roy, J. Descloitres, S. Alleaume, F. Petitcolin, and Y. Kaufman. 2002. “The MODIS Fire Products.” Remote Sensing of Environment 83: 244–262. doi:10.1016/S0034-4257(02)00076-7.
- Lindley, T. T., A. B. Zwink, C. M. Gravelle, C. C. Schmidt, C. K. Palmer, S. T. Rowe, R. Heffernan, N. Driscoll, and G. M. Kent. 2020. “Ground-Based Corroboration of GOES-17 Fire Detection Capabilities During Ignition of the Kincade Fire.” Journal of Operational Meteorology 8 (8). doi:10.15191/nwajom.2020.0808.
- Li, F., X. Zhang, D. Roy, and S. Kondragunta. 2019. “Estimation of Biomass-Burning Emissions by Fusing the Fire Radiative Power Retrievals from Polar-Orbiting and Geostationary Satellites Across the Conterminous United States.” Atmospheric Environment 211: 274–287. doi:10.1016/j.atmosenv.2019.05.017.
- Millones, M., J. Rogan, B. L. Turner, B. Parmentier, R. Harris, and D. Griffith. 2017. “Fire Data as Proxy for Anthropogenic Landscape Change in the Yucatán.” Land 6 (3): 61. doi:10.3390/land6030061.
- Mota, B., and M. J. Wooster. 2018. “A New Top-Down Approach for Directly Estimating Biomass Burning Emissions and Fuel Consumption Rates and Totals from Geostationary Satellite Fire Radiative Power (FRP).” Remote Sensing of Environment 206: 45–62. doi:10.1016/j.rse.2017.12.016.
- Mueller, S., L. Tarnay, S. O’Neill, and S. Raffuse. 2020. “Apportioning Smoke Impacts of 2018 Wildfires on Eastern Sierra Nevada Sites.” Atmosphere 11 (9): 970. doi:10.3390/atmos11090970.
- NOAA. 2019. “GOES-R Series Product Definition and Users’ Guide (No. 416- R- PUG- L2 Plus- 0349 Vol 5).” https://www.goes-r.gov/products/docs/PUG-L2+-vol5.pdf. Last accessed 1/20/2023.
- Prins, E. M., J. M. Feltz, W. P. Menzel, and D. E. Ward. 1998. “An Overview of GOES-8 Diurnal Fire and Smoke Results for SCAR-B and 1995 Fire Season in South America.” Journal of Geophysical Research Atmospheres 103: 31821–31835. doi:10.1029/98JD01720.
- Prins, E. M., and W. P. Menzel. 1992. “Geostationary Satellite Detection of Biomass Burning in South America.” International Journal of Remote Sensing 13: 2783–2799. doi:10.1080/01431169208904081.
- Prins, E. M., J. Schmetz, L. P. Flynn, D. W. Hillger, and J. M. Feltz. 2001. “An Overview of Diurnal Active Fire Monitoring Using a Suite of International Geostationary Satellites. In Global and Regional Vegetation Monitoring from Space: Planning a Coordinated International Effort, edited byAhern, Frank, Goldammer, Johann, Justice, Christopher. Vol. 1, 145–170. 90-5103-140-8. The Netherlands: Kulger Publications.
- Roberts, G. J., and M. J. Wooster. 2008. “Fire Detection and Fire Characterization Over Africa Using Meteosat SEVIRI.” IEEE Transactions on Geoscience & Remote Sensing 46 (4): 1200–1218. doi:10.1109/TGRS.2008.915751.
- Roberts, G., M. J. Wooster, W. Xu, P. H. Freeborn, J. J. Morcrette, L. Jones, A. Benedetti, H. Jiangping, D. Fisher, and J. W. Kaiser. 2015. “LSA SAF Meteosat FRP Products–Part 2: Evaluation and Demonstration for Use in the Copernicus Atmosphere Monitoring Service (CAMS).” Atmospheric Chemistry & Physics 15 (22): 13241–13267. doi:10.5194/acp-15-13241-2015.
- Schmidt, C. 2020. “Monitoring Fires with the GOES-R Series.” In The GOES-R Series, 145–163. Elsevier. doi:10.1016/B978-0-12-814327-8.00013-5.
- Schmidt, C., J. Hoffman, E. Prins, and S. Lindstrom. 2020. “GOES-R Advanced Baseline Imager (ABI) Algorithm Theoretical Basis Document for Fire/Hot Spot Characterization”. NOAA NESDIS CENTER for SATELLITE APPLICATIONS and RESEARCH. https://www.star.nesdis.noaa.gov/goesr/rework/documents/ATBDs/Enterprise/GOES-R_AWG_ATBD_Land_FIRE_v2.7_Oct2020.pdf. Last accessed 1/26/2023
- Schmit, T. J. P., M. M. Griffith, J. M. Gunshor, S. J. Daniels, Goodman, W. Lebair, and S. J. Goodman. 2017. “A Closer Look at the ABI on the GOES-R Series.” Bulletin of the American Meteorological Society 98 (4): 681–698. doi:10.1175/BAMS-D-15-00230.1.
- Schroeder, W., P. Oliva, L. Giglio, and I. A. Csiszar. 2014. “The New VIIRS 375 M Active Fire Detection Data Product: Algorithm Description and Initial Assessment.” Remote Sensing of Environment 143: 85–96. doi:10.1016/j.rse.2013.12.008.
- Schroeder, W., P. Oliva, L. Giglio, B. Quayle, E. Lorenz, and F. Morelli. 2016. “Active Fire Detection Using Landsat-8/OLI Data.” Remote Sensing of Environment 185: 210–220. doi:10.1016/j.rse.2015.08.032.
- Vetrita, Y., and M. A. Cochrane. 2020. “Fire Frequency and Related Land-Use and Land-Cover Changes in Indonesia’s Peatlands.” Remote Sensing 12 (1): 5. doi:10.3390/rs12010005.
- Vosloo, H. F., A. Momberg, and I. T. Josephine. 2010. “Realtime Monitoring of the Transmission System”. Position IT, pp.55–61. https://www.ee.co.za/wp-content/uploads/legacy/EngineerIT%202011/engineerit%20august%202011_p46-49.pdf. Last Accessed 1/26/2023.
- Wooster, M. J., G. Roberts, P. H. Freeborn, W. Xu, Y. Govaerts, R. Beeby, J. He, A. Lattanzio, D. Fisher, and R. Mullen. 2015. “LSA SAF Meteosat FRP Products – Part 1: Algorithms, Product Contents, and Analysis.” Atmospheric Chemistry & Physics 15: 13217–13239. doi:10.5194/acp-15-13217-2015.
- Wooster, M. J., G. Roberts, L. Giglio, D. P. Roy, P. H. Freeborn, L. Boschetti, C. Justice, et al. 2021. “Satellite Remote Sensing of Active Fires: History and Current Status, Applications and Future Requirements.” Remote Sensing of Environment 267: 112694. doi:10.1016/j.rse.2021.112694.
- Xu, W., M. J. Wooster, J. He, and T. Zhang. 2021. “Improvements in High-Temporal Resolution Active Fire Detection and FRP Retrieval Over the Americas Using GOES-16 ABI with the Geostationary Fire Thermal Anomaly (FTA) Algorithm.” Science of Remote Sensing 3: 100016. doi:10.1016/j.srs.2021.100016.
- Xu, W., M. J. Wooster, T. Kaneko, J. He, T. Zhang, and D. Fisher. 2017. “Major Advances in Geostationary Fire Radiative Power (FRP) Retrieval Over Asia and Australia Stemming from Use of Himarawi-8 AHI.” Remote Sensing of Environment 193: 138–149. doi:10.1016/j.rse.2017.02.024.