
 ?Mathematical formulae have been encoded as MathML and are displayed in this HTML version using MathJax in order to improve their display. Uncheck the box to turn MathJax off. This feature requires Javascript. Click on a formula to zoom.
Abstract
Infrastructure maintenance and replacement decisions are subject to uncertainties such as regular asset degradation, structural failure, and price uncertainty. In the engineering domain, Markov Decision Processes (MDPs) typically focus on uncertainties regarding asset degradation and structural failure. While the literature in the engineering domain stresses the importance of addressing price uncertainties, it does not substantiate the observations of such uncertainties through optimization modeling. By contrast, real option analyses (ROAs) that originate from the financial domain address price uncertainties but generally disregard asset degradation and structural failure. Accordingly, this piece of current research brings both domains closer together and proposes an optimization approach that incorporates the flexibility to choose between multiple successive intervention strategies, regular asset degradation, structural failure and multiple price uncertainties. A practical result of the current research is a realistic approach to optimization modeling in which state space reduction is achieved by combining prices into portfolios. The current research obtains transition probabilities from existing price data. This approach is demonstrated using a case study of a water authority in the Netherlands and confirms the premise that price fluctuations may influence short-term maintenance and replacement decisions.
Introduction
Many infrastructure assets are ageing and reach the end of their useful life. Infrastructure asset owners are confronted with large scale replacements in the coming decennia (Park et al. Citation2012, Hall et al. Citation2016). Huge capital expenditures are involved and the planning and financing of these investments is an issue of great concern (Haffner and Gennady Citation2011, Power et al. Citation2016). The American Water Works Association states in a press release: “Renewal and replacement of infrastructure and financing for capital improvements top the list of water industry concerns for the 4th year running” (AWWA Citation2019). The US Federal Highway Agency warns for unprecedented challenges: “Ageing roads and bridges that carry greater traffic volumes and heavier loads than ever need extensive rehabilitation” (FHWA Citation2019). Similar concerns are shared among infrastructure asset owners worldwide (Stewart Citation2001, Klatter et al. Citation2009, Orcesi Citation2016).
Ageing infrastructure imposes the need for maintenance and replacement optimization (Frangopol Citation2011, Elcheikh and Michael Citation2017). Such optimization modeling is challenging for several reasons. First, acknowledging that uncertainties exist, the identification of the main uncertainty drivers is difficult given that such drivers can be related to the infrastructure integrity, the environment surrounding the infrastructure, and the costs associated with preserving the functions of the infrastructure (Ilg et al. Citation2017, Sinha et al. Citation2017, Lange Citation2018).
A second challenge is the identification of alternatives. Costs, uncertainty, changing societal demands and long technical life cycles of infrastructure assets favor lifetime extension by maintenance without compromising safety (Lange Citation2018). Generally, several activities with different cost and risk profiles are available to meet the required performance demands. Activities include, for example, regular maintenance, overhauls, major overhauls, and renewals as well as the numerous sequential combinations of these activities.
A third challenge is that uncertainty drives the need for managerial flexibility. A decision-maker will monitor uncertainty drivers and base future decision on the development of those drivers. This managerial flexibility has value that should be incorporated into replacement optimization (Lander and Pinches Citation1998, De Neufville and Scholtes Citation2011, Cardin et al. Citation2015).
The literature, which is reviewed in the following section, offers maintenance and replacement optimization approaches but none of them covers the aforementioned challenges in an integrative manner while in practice these challenges are often found in combination. More specifically, optimization approaches found in the literature have difficulties with quantifying uncertainty which is reflected in the substantiation of underlying transition probabilities and, price uncertainty is generally omitted.
Therefore, the aim of the current research is the development of an integrative approach towards infrastructure replacement optimization, which includes regular asset degradation, structural integrity, price uncertainty, multiple sequential options, and managerial flexibility. Such a model supports decision-making in practice and is interesting from a scientific perspective as it demonstrates the importance of addressing price uncertainty.
The outline of this article is as follows. The following section presents a literature review on the inclusion of uncertainty regarding asset integrity and prices in maintenance and replacement optimization modeling, which identifies the research gap. Hereafter the structure of the model is presented, including the motivation of the states, actions, transition probabilities, and rewards for the current research objective. The subsequent section presents in-depth motivation on the approach to modeling price uncertainty in relation to asset deterioration and structural failure. Hereafter the model is demonstrated in a case study, which is followed by a discussion and conclusions.
Literature review
The following literature review is structured along the lines of two key observations relevant for an integrative approach to maintenance and replacement optimization under uncertainty. The first observation is that uncertainty regarding asset integrity is often modeled with transition probabilities that are difficult to substantiate in practice when condition data are unavailable. A second observation is that price uncertainty is rarely addressed in maintenance and replacement optimization despite its importance as stressed by researchers.
Uncertainty regarding asset integrity
Optimizing multiple sequential intervention strategies under uncertainty leads to probabilistic approaches to maintenance and replacement optimization. A mainstream approach for optimizing sequential decision-making is the Markov Decision Process (MDP) (Frangopol et al. Citation2004, Baik et al. Citation2006, Kolobov and Kolobov Citation2012, Lin et al. Citation2019). An MDP is a stochastic serial decision model that incorporates uncertainty and the managerial flexibility to optimize future decisions or actions (Puterman Citation1994, Frangopol et al. Citation2004, Kolobov and Kolobov Citation2012). MDPs are widely used in the literature to address asset integrity uncertainties in bridge and pavement systems with respect to the maintenance and replacement optimization. For example, MDPs for optimizing bridge deck and road maintenance are presented by Costello et al. (Citation2005), Robelin and Madanat (Citation2007), Faddoul et al. (Citation2011), and Oliveira et al. (Citation2017). Similar, MDP approaches have been developed for wastewater systems (Wirahadikusumah et al. Citation1999, Baik et al. Citation2006, Lin et al. Citation2019).
In these MDP approaches, transition probability matrices define the probabilities for transferring from one condition state to other condition states. Moreover, the impact of maintenance activities on condition improvement is estimated.
Standardized visual inspections for bridge and pavement systems and CCTV assessments for sewer pipes provide such condition data, generally on a 1 to 5 scale. Transition probabilities are derived from this data. As an example, a dedicated solution for wastewater systems is proposed by Baik et al. (Citation2006), who propose an ordered probit model which estimates the transition probabilities as increments in condition based on a discretization of a continuous deterioration function. Condition data are required to validate such an approach.
Another approach to obtain transition probabilities from inspection data is proposed by Elcheikh and Michael (Citation2017) who suggest a PERT-distribution and Monte Carlo simulation to estimate the likelihood that an asset is in one of the condition states. Although the authors have a different modeling objective their approach for estimating the likelihood of an asset being in a certain condition state can be used to establish transition probabilities.
Nevertheless, when data are unavailable or unsuitable, the difficulties associated with estimating transition probabilities and the impacts of maintenance actions on the condition, limit the application of these MDP approaches. Lethanh et al. (Citation2017) identify several difficulties in data-driven approaches to find such probabilities. Challenges include the possible lack of data, inconsistencies with the data, and possible biases in the data. In response, solutions to deal with inadequate data are proposed such as mechanistic-empirical approaches (Lethanh et al. Citation2017), genetic algorithms (Almeida et al. Citation2015, Compare et al. Citation2015) or specific adaptation of the modeling to available data (Adey et al. Citation2018). Fuzzy sets theory, a rule-based expert knowledge system, is also known to be supportive to incorporate uncertainty (Elcheikh et al. Citation2013, Masteri et al. Citation2018). Mohanta et al. (Citation2005), for example, propose a fuzzy logic approach to establish transition probabilities in a Markov model for maintenance scheduling. Here, the knowledge of experts is used to define membership functions to address uncertainty.
Not all infrastructures have visible and measurable condition states like gravity sewers and pavements. For example, pump systems, the machinery of movable bridges or locks, swing bridges in wastewater treatment plants and aeration facilities fail occasionally, are repaired and put into service again. In these situations, deterioration is generally expressed as a rate of occurrence of failures (Ascher Citation2007).
Price uncertainty
Another observation is that most probabilistic MDP models for maintenance and replacement optimization do not address price uncertainty. Faghih Sayed Amir and Kashani (Citation2018) and Swei et al. (Citation2017) observe that although price fluctuations have an impact on future maintenance, rehabilitation and construction, such knowledge is generally ignored by researchers in the engineering domain. Similar conclusions are drawn by Mirzadeh et al. (Citation2014) and Yu and Ive (Citation2011), who emphasize the importance of proper assessments of price developments with respect to the Swedish road infrastructure and the UK construction industry, respectively. Rehan et al. (Citation2016) and Younis et al. (Citation2016) equally emphasize the importance of a proper assessment of price indices to forecast capital expenditures. These authors stress that unit prices and producer price indices are specific for sectors and geographical locations.
Additionally, Ilbeigi et al. (Citation2017) observe that even previous research devoted to forecasting future prices and cost indices does not quantify price uncertainty.
Despite the observation that price uncertainty is generally ignored in MDP models for maintenance and replacement optimization, price uncertainty is addressed in the domain of real options analysis (ROA). ROA stems from financial options. An option gives a holder the right but not the obligation to exercise a financial transaction at a future date. This right has value, the so-called option value (Black and Scholes Citation1973, Merton Citation1973, Cox et al. Citation1979, Brealey et al. Citation2017).
In a ROA, price uncertainty is often modeled as a Geometric Brownian Motion (GBM) (Mun Citation2006, Guthrie Citation2009, Younis et al. Citation2016, Farida Agustini et al. Citation2018). A GBM is a stochastic simulation process in which a price follows a random walk. Such random walk can be simulated with a Monte Carlo simulation or represented as a binomial lattice (Cox et al. Citation1979).
ROA applications dedicated to the maintenance and replacement optimization of ageing infrastructure are scarce but good ROA applications are found in related fields. Several authors have developed ROA applications for optimizing investment decisions in hydropower and flood defense while addressing price uncertainty influenced by climate change scenarios (Woodward et al. Citation2014, Kim et al. Citation2017). Another ROA application focused on investment decisions is presented by Martani et al. (Citation2018) who optimize urban real estate investments under uncertain future rental scenarios. Several ROA applications address risk allocation and regulation in public–private partnerships. In this field, Liu et al. (Citation2017) use ROA to establish a price mechanism for termination prices of public–private partnership projects. Other ROA models focus on an optimal (win-win) risk allocation of revenues and price cap regulation in public–private partnerships (Pellegrino et al. Citation2011, Carbonara and Pellegrino Citation2018). Power et al. (Citation2016) consider buyout, revenue sharing and minimum revenue guarantee as options in transportation public-private partnerships. ROA is also known to be a good instrument for valuing concessionaires in road toll projects (Ford et al. Citation2002, Feng et al. Citation2015, Buyukyoran and Gundes Citation2018).
An ROA application for the valuation of operation and maintenance contracts for gravity sewer systems is presented by Park et al. (Citation2012). Interesting about this research for the current objective is that an asset deterioration function is coupled with maintenance costs. A dedicated infrastructure replacement optimization ROA, given one variable for price uncertainty, is presented by Van den Boomen et al. (Citation2018).
Similar to MDP, the application of ROA has its challenges and its critiques. In contrast to MDPs, ROAs often do not address asset deterioration, nor multiple price uncertainties. A discrete approach to ROA will become complex when multiple uncertainties are involved. Like MDP, ROA quickly suffers from state explosion. For this reason, ROA applications found in the literature dealing with multiple uncertainties generally use a Monte Carlo simulation to combine several uncertainties into one and assume constant volatility. However, such approach provides limited insight in how distinct uncertainties contribute to the result.
Summarizing the literature, MDPs are emphasized in the engineering domain when considering asset integrity uncertainty, whereas price uncertainty is generally ignored. By contrast, ROAs emphasize price uncertainty, while generally ignore asset integrity. Moreover, both approaches quickly fall prey to state explosion. The current research aims to develop an integrative approach that incorporates a sequence of intervention strategies, multiple price uncertainties, structural integrity, and regular asset degradation.
Model formulation
The current research uses an MDP to model the optimization problem because an MDP optimizes sequential decisions under uncertainty (Puterman Citation1994, Frangopol et al. Citation2004, Hillier and Lieberman Citation2010). The current approach is a finite MDP but truncates the time-variant final states with a discounted value representing all expected future life cycle costs belonging to the final decision. Value iteration is used to find the optimal sequence of managerial decisions in each state. Groundwork explaining MDPs and algorithms to find optimal policies are provided by Puterman (Citation1994) and Kolobov and Kolobov (Citation2012). The value iteration algorithm is fed with transition probability matrices which contain the transition probabilities for transferring from each state to another for each action.
The following subsections first describe the modeling approach and motivate the choices made for the states, actions, transition probabilities and rewards. This approach is visualized in . The subsequent section motivates the in-depth approach to the modeling of price uncertainty, ageing and structural integrity. This modeling is the input for establishing transition probabilities and rewards.
Figure 1. MDP approach for the current model.
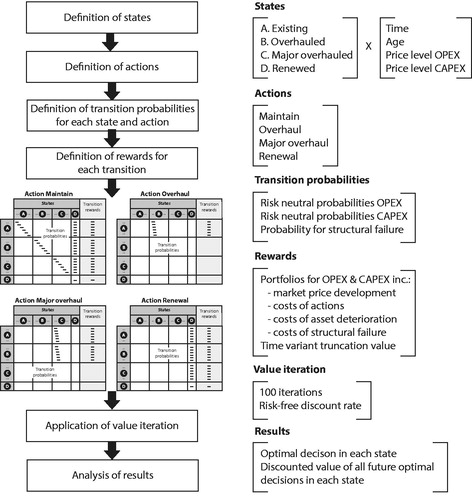
States
The state space is defined by five discrete and finite variables, namely, asset type, time, age, the price level of the operational expenditures (OPEX) and price level of the capital expenditures (CAPEX). The state-space contains the Cartesian product of these variables.
The asset types are an existing asset, an overhauled asset, a major overhauled asset, and a renewed asset. Time is a second variable, and the current modeling is nonstationary. Each asset has a certain age at a certain time and is bounded by a maximum life. The fourth and fifth variables are the levels for OPEX and CAPEX. These are discrete variables derived from forecasts based on analyses of long-term historic price indices as will be demonstrated in the case study section.
As an example, a state-designated as depicts an overhauled asset,
years after the overhaul (
= relative age) in the
year from now (
= absolute time). The overhauled asset consequently has been maintained for
years. The last two variables define the price levels in the
year which will be explained in the section on price uncertainty modeling. The OPEX and CAPEX price levels follow a binominal lattice and their positions are given by respectively
and
number of down moves in year
Actions
The four allowable actions depending on the state are to maintain, overhaul, a major overhaul or renew the infrastructure, as depicted in .
To maintain denotes providing regular maintenance and minimal repair. Such a strategy is often referred to as “minimal repair” or “as good as old” (Rigdon and Basu Citation2000, Ascher Citation2007).
To overhaul refers to substantially larger maintenance efforts such as revisions, rehabilitations, or partial replacements. An overhaul prolongs the remaining service life and may positively impact the failure rate. This strategy is also referred to as “imperfect repair” as it brings the asset to a better condition but not “as good as new” (Rigdon and Basu Citation2000). A major overhaul refers to a complete renovation, refurbishment, or reinforcement of the infrastructure. All these actions are substantial and will significantly prolong the remaining service life of the infrastructure and lower the failure rate (Pascual et al. Citation2006, Ascher Citation2007, Shafiee et al. Citation2011). Renewal designates a full replacement. Such a strategy is denoted as “perfect repair” or “as good as new” (Rigdon and Basu Citation2000, Ascher Citation2007).
Regular maintenance is valid for an existing asset, an overhauled asset, and a major overhauled asset. However, inherent in this action is the probability for structural failure, that is exceedance of a limit state. In such an event, the consequence is a penalized renewal because an unplanned renewal is generally more expensive than a planned renewal.
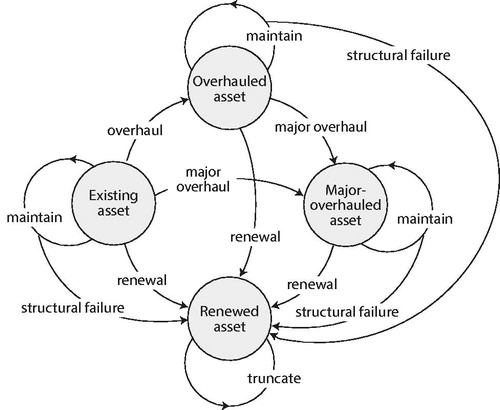
There is a sequence in possible intervention strategies. An existing asset can be maintained, overhauled, major overhauled and renewed, whatever is optimal under conditions like age and price levels for OPEX and CAPEX. An overhauled asset can be maintained, major overhauled, or renewed. A major overhauled asset can be maintained or renewed. Finally, a renewal brings the asset to a truncation state that estimates all time-variant expected future life cycle costs (infinite) after the action is taken.
A simplified representation of the MDP model is provided in , whereby the four states that represent the asset type (the grey circles), contain the states for time, age, OPEX, and CAPEX price levels.
Figure 2. Simplified representation of the actions and states of the MDP model.
Transition probabilities
Transition probabilities designate the probability of transferring from one state to another when a certain action is taken. The transition probabilities involved are the probabilities for arrival at a certain OPEX and CAPEX price level after an action is taken and the probability of a structural failure or reaching a limit state.
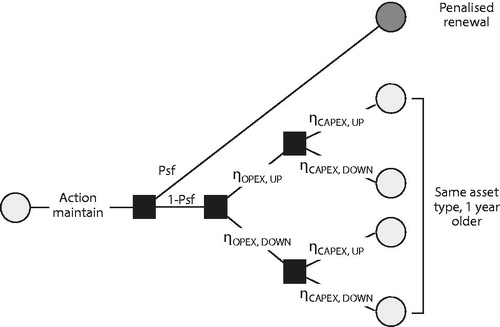
In contrast to MDP applications found in the literature such as Wirahadikusumah et al. (Citation1999), Faddoul et al. (Citation2011), and Oliveira et al. (Citation2017), who use condition data to estimate transition probabilities to move from one condition state to another, the current study proposes to express condition degradation in maintenance repair costs substantiated with a failure rate. The current study is focused on assets which occasionally fail and are allowed to fail, and for which condition data are scarce or unavailable. The subsequent uncertainty quantification of maintenance costs can be derived from existing price data.
Price uncertainty is modeled with underlying discrete binominal lattices which represent all possible price paths as explained in detail in the following section. Illustrative visualization of the action maintains with probabilities for one time step is presented in . A maintenance action results in the following probable outcomes. One decision epoch further ensures that the asset will be one-time epoch older if no structural failure occurs (). In such a case, the aged asset will be subject to four probable price level states, specifically, the price level of the operational expenditures will go up (
) or down (
) and the price levels of the capital expenditures will go up (
) or down (
). The fifth probable outcome is that the asset will reach its limit state (threshold for a structural failure with probability
). In that case the model truncates with a time-variant corrective renewal including all estimated future life cycle costs.
Figure 3. Schematized visualization of the action maintains and probabilities for transferring to successive states.
In each state, the appropriate OPEX prices are traced, based on the decision to maintain, and assessed against the possible CAPEX prices of the alternative CAPEX decisions, including all future life cycle costs. The actions, overhaul, major overhaul and renewal (CAPEX actions), will result in a transfer to another asset type with relative age 0 at the moment the action is taken. Hereafter maintenance starts again, for the other asset type.
The current model assumes all CAPEX prices follow the same price path directions. For example, when prices for overhauls are high at a certain time, the expectation is that renewal prices are proportionally high as both investment actions are related to the development of market construction prices.
In the current modeling, this assumption does not hold for operational expenditures when transferring from one asset type to another as a consequence of a CAPEX decision because a new asset type can have a totally different OPEX cost profile from the previous one (demonstrated in the case study section). Accordingly, the OPEX lattices of each asset type are not expected to be connected only by up or down moves. Rather, all possible nodes one decision epoch further are considered when transferring from one OPEX lattice to another.
Rewards
The immediate rewards of each action transferring from one state to another directly follow from the underlying OPEX or CAPEX cash flow lattices.
However, special attention is required regarding the rewards when transferring to the truncation state. This is a probable outcome of the maintenance action in the case of a structural failure or a direct outcome of the renewal action. The truncation value is a time-variant estimate of perpetuity of future life cycle costs of renewal as proposed by Guthrie (Citation2009) and Van den Boomen et al. (Citation2018). In the case of a structural failure, this truncation value is additionally penalized with a factor 1.5 for the first investment because an unplanned renewal is more expensive than a planned renewal.
Modeling price uncertainty, ageing and structural failure
The previous section formulates the overall MDP approach to optimize a sequence of maintaining, overhauling, and replacing decisions while taking multiple price uncertainties, ageing, and structural failure into account. The current section motivates the approach to assess the price uncertainties, ageing, and structural failure.
Price uncertainty
A common convention is to model price uncertainty using geometric Brownian motion (GBM) (Mun Citation2006, Guthrie Citation2009, Younis et al. Citation2016, Farida Agustini et al. Citation2018). A GBM is a continuous stochastic simulation process where prices follow a lognormal distribution with drift μ and a normally distributed shock ∊ with a volatility σ. The constants drift and volatility
are estimated based on historic prices by using the mean and standard deviation of the log-returns of the prices (Mun Citation2006, Guthrie Citation2009, Francis and Kim Citation2013).
A GBM can be expressed as a binomial lattice as in , which is the discrete form of the continuous stochastic simulation process. The magnitude of its up move and down move
are defined by volatility
and conform to EquationEquations (1)
(1)
(1) and Equation(2)
(2)
(2) (Cox et al. Citation1979) as following:
(1)
(1)
(2)
(2)
Figure 4. Cash flow development in a linear binomial lattice.
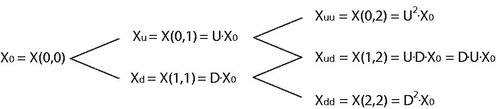
In , represents the cash flow at decision epoch
having experienced
number of down moves.
Cox et al. (Citation1979) propose to use drift and volatility
to derive the actual probability
for an up move and
for a down move, respectively, according to EquationEquations (3)
(3)
(3) and Equation(4)
(4)
(4) as following:
(3)
(3)
(4)
(4)
As the current research will introduce asymmetric option payoffs, estimating the actual probabilities, as in EquationEquations (3)(3)
(3) and Equation(4)
(4)
(4) , is not sufficient (Copeland and Antikarov Citation2003, Guthrie Citation2009). Rather, the interest lies in the certainty equivalent probabilities, designated as risk-neutral probabilities for up and down moves, that is,
and
respectively. To obtain the risk neutral probabilities from the market data, the certainty equivalent of the capital asset pricing model is followed in EquationEquations (5)
(5)
(5) and Equation(6)
(6)
(6) (Guthrie Citation2009) as follows:
(5)
(5)
(6)
(6)
where
is the risk-neutral probability of an up move;
is the risk-neutral probability of a down move; and
is the risk-adjusted growth factor of the expected cash flows.
The actual probabilities and
are correlated to the risk-neutral probabilities
and
respectively, by the risk-adjusted growth factor
which, for one decision epoch to the next, is defined as (Guthrie Citation2009) following:
(7)
(7)
The first term on the right side of EquationEquation (7)(7)
(7) represents the expected growth factor of an underlying market price variable where
is the price of this price variable at the beginning of the time step,
and
The second term represents the well-known market risk premium and the
and subtracts a risk premium from the expected growth of the underlying market price variable.
Anticipating the modeling of the current research, two direct equations are required to arrive at the predicted cash flows and their probabilities for each node where
is the number of down moves and
is the time. The cash flow
follows from:
(8)
(8)
and the overall probability for arriving at any node
from node
is as following:
(9)
(9)
where
represents the standard binomial coefficient. graphically represents the relation between the stepwise risk-neutral probabilities and the overall probabilities for arriving a node
for two-time steps.
Figure 5. Risk neutral probabilities and overall probabilities for arriving at node (d,t) in a stationary binomial lattice.
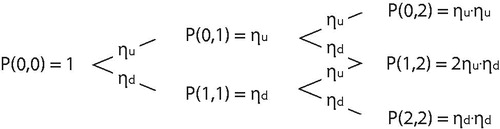
Modeling price uncertainty for each price in a ROA separately with its own binominal lattice, as depicted in and , will quickly lead to state explosion as prices result in
future possibilities for price levels. This illustrates the major challenge for modeling price uncertainty in a ROA and leads the current research to another domain in finance, namely, the portfolio theory. The portfolio theory was introduced by Markowitz (Citation1952) and targets at diversification of risk by combining financial securities into a single portfolio. The portfolio theory of Markowitz (Citation1952) allows for combining these financial securities in a single portfolio with a new portfolio drift
and portfolio volatility
The portfolio mean
is defined by EquationEquation (10)
(10)
(10) as follows:
(10)
(10)
where
is the number of constitutions in portfolio
is the proportional weight of constitution
in the portfolio; and
is the mean of constitution
The portfolio volatility
is defined by EquationEquation (11)
(11)
(11) as follows:
(11)
(11)
where
and
EquationEquation (11)
(11)
(11) expresses portfolio volatility as a function of the proportion of constitutions in a portfolio, the separate volatilities of the constitutions, and the correlations of the constitutions.
The GBM and binominal lattice are founded on log-returns of prices and arithmetic mathematical operations over time, while the portfolio theory builds on compounded simple returns (the non-log version of returns), mathematical geometric operations over time and arithmetic operations over assets (Francis and Kim Citation2013). For a strict interpretation, a proper mathematical conversion from log return to simple return values is required when combining both theories. These mathematical transformations follow the relationship:
The portfolio theory allows for merging different market prices and their underlying binominal lattices in a single portfolio binominal lattice. This significantly reduces the required state space in the current ROA modeling.
Asset degradation
A challenge in the current modeling is the ageing of repairable infrastructure. In the absence of sufficient condition and failure data, the current research proposes an approach which builds on failure rates and maintenance repair costs. A similar line of reasoning is proposed by Park et al. (Citation2012) for a situation where condition data are limited.
The power law process is a popular model applied in practice for ageing repairable assets (Ascher and Feingold Citation1984, Rigdon and Basu Citation2000, Ascher Citation2007). As such, it provides a relationship for the rate of occurrence of failures, here designated as in EquationEquation (12)
(12)
(12) as follows:
(12)
(12)
where
is the asset age and
are shape and scale parameters, respectively, that are derived from failure data or expert judgment.
While ageing leads to more repairs and affects operational expenditures, it does not affect the development of market prices of the constitutions defined by and
It will, however, affect how many units of a certain price constitution are used. Therefore, ageing directly affects the weights
in a portfolio. This imposes a difficulty as it introduces time variance into the portfolio binominal lattice. The time-variant portfolio lattice characteristics as defined by EquationEquations (1)
(1)
(1) through Equation(7)
(7)
(7) are derived from
and
for each time step, but they cannot be used to describe the move from one decision epoch to another in the combined portfolio binominal lattice. This is because these characteristics describe the next move under the assumption that each characteristic remains unchanged, which is not the case. Rather, the expected price at a successive decision epoch depends on the constitutions’ price developments in the market and the proportion in which they are used, not on the current levels and proportions of operation and maintenance expenditures.
For this reason, the approach followed herein uses the estimated future market prices (EquationEquation (8)(8)
(8) ) and their overall arrival probabilities (EquationEquation (9)
(9)
(9) ) as constraints and derives the corresponding combined portfolio risk-neutral probabilities
and
as detailed in EquationEquation (13)
(13)
(13) . Although this approach has similarities with the implied binomial tree approach as introduced by Rubinstein (Citation1994), it differs in that Rubinstein (Citation1994) only had the future exercise prices as constraints, while the current research has all future prices as constraints. The application and validity of EquationEquation (13)
(13)
(13) are demonstrated in Supplemental material.
(13)
(13)
Structural integrity
Structural integrity denotes the probability of a total collapse or end of life failure. The European reference design code for new structures (NEN-EN Citation1990) prescribes a reliability index as a design parameter for structures, which is also referred to as limit state. The reliability index is derived from load-resistance interference (Leira Citation2013, Sánchez-Silva and Georgia-Ann Citation2016). The probability of structural failure is defined by
where
denotes a cumulative normal standard distribution.
In the Netherlands, mandatory renewed structural safety assessments are required as soon as infrastructures reach their design life or in the case of reconstructions (NEN 8700 Citation2011). Reliability indices for disapproval levels range from 1.8 to 3.3 corresponding with failure probabilities of 0.036 to 4.83E-04, respectively.
Case study
This case study builds on a case study presented in Van den Boomen et al. (Citation2019). The current modeling acknowledges multiple price uncertainties, asset degradation following a power law process and structural failure following interference theory. The inclusion of multiple uncertainties requires a different and more complex model setup and follows the approach described in the previous sections.
The case study is an old pumping station with diesel engines owned by a water authority. There are still a significant number of such diesel pumping stations in the Netherlands. These diesel engines are replaced by electrical engines upon a major overhaul. Although diesel is a relatively cheap source of energy, diesel engines run on fossil energy, are labour-intensive in their maintenance and require specialized maintenance engineers. The question of interest is to optimize this replacement from a cost perspective to support a wider managerial decision framework. The approach followed is applicable to similar case studies that deal with multiple successive options, several price uncertainties, asset degradation modeled with a failure rate and a probability for structural failure.
Cost data
The cost data obtained in belong to a pumping station with a capacity of 4200 L/min and a head of 2 m. The cost data are based on registered historic costs and future estimates by maintenance engineers.
Table 1. Cost data in Euros.
Financial market parameters
The risk-free interest rate, market risk premium and are obtained from a study of the Dutch Authority for Consumer and Market (ACM Citation2017) and provided in .
Table 2. Financial market parameters.
Price uncertainty
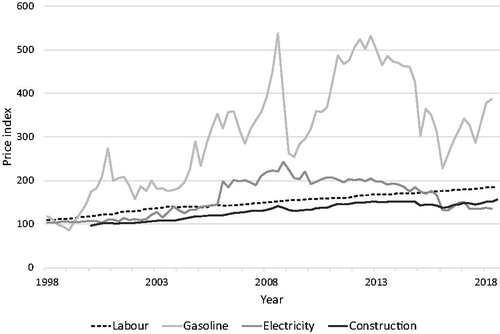
The drift and volatility of the prices are obtained from historic prices between 1996 and 2018 and presented in . A clear explanation of how to obtain drifts and volatilities from market prices assuming a GBM is provided by Francis and Kim (Citation2013), Mun (Citation2006), and Guthrie (2009). The Dutch Central Bureau for Statistics (CBS) provides aggregated historic price indices for civil engineering works among which is included construction for water projects (CBS Stateline Citation2018). The historic price indices for maintenance (labour), gasoline and electricity are obtained from CROW (Citation2018). Conversion from log return values to simple return values is required for the following application of the portfolio theory (Francis and Kim Citation2013). illustrates that conversion is only significant for higher drifts and volatilities (approximately >10%).
Table 3. Annualized drift and volatility derived from historical price indices 1996–2018.
displays the historic price developments of the cost components showing energy costs to be more volatile than construction costs and labour.
Figure 6. Historic development of price indices for construction, labour, gasoline and electricity.
Anticipating the combining of maintenance costs in two portfolios, the covariance of labour and gasoline and the covariance of labour and electricity is derived from the log-returns of the prices and presented in . A positive covariance indicates that the log-returns of the prices move in the same direction, whereas a negative covariance indicates an opposite movement. Again, for precision, a transformation to simple return-based values is performed.
Table 4. Covariances of operational prices.
Failure rate and structural failure
In the absence of sufficient long-term failure data, the current research, in addition to trend analysis, used a pragmatic expert judgment approach for estimating the scale and shape parameters for β and θ of the power-law process as depicted in EquationEquations (14)(14)
(14) and Equation(15)
(15)
(15) in the following text:
(14)
(14)
(15)
(15)
where
is the expected number of failures in year
is the expected number of failures in year
is year
and
is year
Expert judgment from the water authority was also used to estimate the maximum remaining service lives () of different asset types. Such estimates are based on a maximum allowable number of failures per year with respect to the impact on society. For example, a pumping station that fails too often may result in negative publicity and reputation damage for a water authority. All data are presented in and graphically depicts the estimated failure rates if the asset types are retained for their maximum remaining service lives.
Figure 7. Estimates of priority 1 failure rates for the aged assets when successively maintained for their maximum remaining service lives.
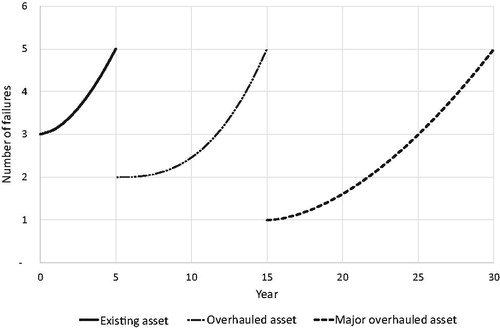
Table 5. Parameter estimation for β and θ based on expected future failures per year.
The last column in provides the rounded estimated probabilities for a structural failure (non-repairable) based on the legally demanded reliability indices for existing structures in the Netherlands.
Combined portfolio lattices
The data in the previous sections are used to establish the combined OPEX and CAPEX binominal lattices for the price developments of each asset type. The CAPAX lattices are straightforward as they are built on aggregated construction price indices. The parameters that describe the CAPEX binominal lattices are presented in .
Table 6. Parameters describing the binominal lattice of construction prices.
Future CAPEX prices follow EquationEquation (8)(8)
(8) with the volatility for construction prices as depicted in . An illustration in depicts the first 5 years of the probable development of the future prices of an overhaul.
Table 7. Price development of an overhaul with characteristics from in Euros (reference EquationEquation (8)(8)
(8) ).
The OPEX lattices are not straightforward because distinct operational prices are combined in a single binominal lattice and because ageing (the failure rate) causes the proportions of price constitutions to change with time. As explained in the previous sections, we propose an implied binomial tree approach to construct a time-variant combined binominal lattice. While the difficulty shifts to the construction of combined binominal lattices, hereafter it allows for using the convenient characteristic of recombining branches in the MDP model, which significantly reduces state space.
Two forces drive the development of maintenance costs, namely, ageing, which is age-dependent, and market price development, which includes inflationary forces and is time-dependent.
First, ageing is considered. For ageing, price increases are related to the failure rate, which is a function of the age of the asset after an action is taken. This age is designated as with a maximum remaining life of
Price increases caused by ageing are modeled to conform to the power-law process:
(16)
(16)
where
are yearly maintenance costs at age
at the current price level,
are the maintenance costs just after the instalment of an asset at the current price level,
are the costs of a priority 1 failure,
and
are the shape and scale parameters describing the power law process and
is the age.
The second operational cost component is energy, specifically, diesel for the existing and overhauled asset and electricity for the major overhauled asset. As no immediate changes are foreseen in energy consumption for each asset type, the expected price of diesel at the current price level remains constant. The impact of price increases and uncertainty caused by inflationary market forces are accounted for when establishing the binominal lattices.
As an example, the proportion of maintenance expenditures and energy expenditures at the current price level are calculated for the existing asset and combined to forecast future prices ( and 9). A detailed calculation example for the values depicted in and 9 is provided as Supplemental material.
Table 8. Parameters describing the distinct binominal lattices that combine operational prices for labour and gasoline at current price levels.
The bottom part of provides the characteristics of six separate binominal lattices that are now returned to one binominal lattice using the implied binominal lattice approach explained in the modeling section and shown in . EquationEquation (8)(8)
(8) provides the expected prices, EquationEquation (9)
(9)
(9) provides the expected overall probabilities for arrival at each node, and EquationEquation (13)
(13)
(13) is used to derive the non-stationary risk-neutral probabilities
of the combined lattice as a function of time and down moves.
Table 9. Lattice characteristics for combined labour and gasoline prices (combined portfolio).
Comparing the recombined risk-neutral probabilities in with the nonrecombined risk-neutral probabilities in reveals no significant differences for the current case study in the first 5 years. However, over time or with higher volatilities and increased failure rates, these differences become more explicit.
Transition probabilities and rewards
The nonstationary OPEX transition probabilities are obtained from the lattices built in the first step of the modeling and are dependent on the state, which is a function of asset type, time, age, down move position for OPEX prices and down move position for CAPEX prices (i.e. ).
The CAPEX transition probabilities up and down are straight forward because these lattices are stationary (i.e. ). Rewards at position are similarly obtained from the preconstructed cash flow lattices (OPEX, i.e. ) or directly calculated from CAPEX using EquationEquation (8)
(8)
(8) .
Optimization
The model is programmed in Matlab, and the optimal policies are found by using value iteration (Puterman Citation1994). The value iteration algorithm uses the transition probability matrices of the four actions (maintain, overhaul, major overhaul, and renewal), their corresponding rewards and the risk-free discount rate.
The maximum service lives of the existing, overhauled, major overhaul and renewed assets are resp. 5, 10, 15, and 80 years for the case study as depicted in .
The value iteration algorithm calculates the optimal decision in each state. The case study has approximately 80,500 states resulting from the combinations of the state variables: asset type, time, age, price level OPEX, and price level CAPEX. One hundred iterations are performed with an error rate of 4.4E-7 and a calculation time of fewer than 10 s.
Results
The result of the calculations is a table that depicts the best decision for each state along with the discounted costs of all optimal future actions from that state forward. This includes the calculation of optimal service lives corresponding with future best decisions under future circumstances for all price levels, failure rates, and probabilities for structural failures.
presents the states of the first 5 years of the current asset, thus providing management information for the immediate decision. The optimal decision for the existing asset is found in the last column of . The best current decision is to maintain the existing asset until at least year 4. In year 4, the best decision depends on the development of prices. When the operational expenditures of the existing asset are in lattice position = (0,4) while the capital expenditures are in lattice position (2,4), (3,4), or (4,4), the best decision is to overhaul the existing asset. Although prices cannot be compared individually (as all optimal future decisions are incorporated as well), and provide an intuitive indication that an overhaul would be optimal in this situation. reveals that the operational expenditures have risen to €421,769 at
= (0,4), whereas the costs of a major overhaul () at nodes
= (2,4), (3,4) and (4,4) have decreased to €350,000, €327,337 and €306,141.
Table 10. Results for the existing asset.
In year 5, at the maximum remaining life of the existing asset, all states indicate an overhaul to be the optimal decision.
If a decision-maker wants to look further, a state can be traced into the future. For example, state indicates an overhaul. This would transfer the existing asset one decision epoch further (
) to a 1-year-old (
) overhauled asset. The possible down moves for the new OPEX lattice position are 0,1, 2, 3, 4, or 5. The possible down moves for the new CAPEX lattice are up (2 + 0) or down (2 + 1). This results in 12 probable subsequent states, which are depicted in . In each of these states, the optimal decision would be to maintain the overhauled asset for another year. Similarly, all states of interest can be traced.
Table 11. Results of a 1-year-old overhauled asset in year 5.
Navigating through the table of results (i.e. ), based on realistic data, demonstrates that optimal decisions are dependent on price developments.
Discussion
The inclusion of uncertainty in maintenance and replacement optimization is an area under investigation. Frangopol (Citation2011), Ilg et al. (Citation2017), and Scope et al. (Citation2016) classify core challenges as identifying the right sources of uncertainty and selecting appropriate methods to incorporate uncertainties. These authors also conclude that uncertainty modeling remains case-specific depending on type of data and quality of data.
A source of uncertainty which is still overlooked in maintenance and replacement optimization is price uncertainty (Park et al. Citation2012, Rehan et al. Citation2016, Younis et al. Citation2016, Ilbeigi et al. Citation2017). An important direction for further research is price forecasting, quantifying price uncertainty and the integration of these in maintenance and replacement optimization modeling.
Adding price uncertainty quickly complicates existing MDP maintenance and replacement optimization models because such models fall prey to state explosion. As a solution, Monte Carlo simulation could be applied to merge multiple uncertainties into one aggregated uncertainty (Pellegrino et al. Citation2011). However, the current research opted for an analytical solution which allows for tracing distinct price uncertainties in separate portfolios.
The current research adds to the body of knowledge on several points. First, it includes multiple price uncertainties in an MDP approach. State explosion is prevented by merging several market prices into portfolios for operational and capital expenditures by using portfolio theory (Markowitz Citation1952, Francis and Kim Citation2013).
Second, price uncertainty is applied to actions like regular maintenance, overhaul, major overhaul and renewal whereas the action regular maintenance incorporates repairs and a probability for reaching a limit state resulting in a subsequent unplanned renewal. Condition improvement is achieved after an overhaul, major overhaul or renewal.
The proposed approach follows a line of reasoning presented by Park et al. (Citation2012) who integrate a condition deterioration rate in a ROA application to value operation and maintenance expenditures for sewer systems. Hereafter, these authors apply a sensitivity analysis to account for uncertainty in the condition deterioration rate. Instead of condition rate the current study uses failure rate. Both studies deal with a situation were limited data on asset deterioration are available. Further, the current study optimizes a chain of actions.
Although the current approach includes multiple probabilistic price uncertainties, it does not incorporate probabilistic uncertainty on condition deterioration. When sufficient condition data are available, such uncertainty is often modeled with transition probability matrices, which express the probability of transferring from one condition state to another (Wirahadikusumah et al. Citation1999, Baik et al. Citation2006, Lethanh et al. Citation2017). Depending on the availability of data and type of data, other approaches to uncertainty modeling of condition deterioration exist such as Monte Carlo simulation (Elcheikh and Michael Citation2017, Lin et al. Citation2019), fuzzy logic techniques (Masteri et al. Citation2018) and sensitivity analysis (Park et al. Citation2012, Scope et al. Citation2016).
The current study deals with infrastructure for which condition data are not available and failure data are scarce. Therefore, the current research proposes a deterministic approach to address asset deterioration related uncertainty (Scope et al. Citation2016, Ilg et al. Citation2017) combined with the probabilistic approach to model price uncertainties. An interesting direction for future research is the inclusion of a probabilistic uncertainty modeling of the failure rate. Such direction could follow a Non-Homogeneous Poisson distribution (Rigdon and Basu Citation2000). The consequence, however, is the addition of states to the already impressive state space. In such case, it would be interesting to investigate the applicability of more advanced algorithms to find optimal policies in large MDP models (Puterman Citation1994, Kolobov and Kolobov Citation2012).
Alternatively, partial observable MDP (POMDP) is a direction to proceed when limited data on condition states or failure rates are available. In a POMDP a decision-maker cannot fully observe the states nor the impact of decisions. A decision-maker will use his beliefs and update his believes when information becomes available (Faddoul et al. Citation2011, Walraven and Spaan Citation2018).
Another important direction for future research is how to obtain useful long-term managerial decision information from results for all future uncertainty states. First year’s optimal decisions under uncertainty are easily obtained and based on long-term optimal decisions. However, extracting these long-term optimal decisions from the results is hard because the inclusion of uncertainty provides an exponentially increasing number of possible paths with their own probabilities. Instead of a decision tree type of visualization the current research proposes to investigate methods which provide a more compact representation of the optimization problem such as influence diagrams, and their results (Lander and Pinches Citation1998, Maier et al. Citation2018). One more interesting direction is presented by McGregor et al. (Citation2017) who developed a visual interface for a specific MDP model.
Conclusions
Huge capital expenditures are involved in the renewal of ageing infrastructure. Emphasis is put on lifetime extension of infrastructure and optimizing a sequence of possible intervention strategies before renewal. Such optimization is challenging as infrastructure is subject to asset deterioration, structural failure and price uncertainties.
Current maintenance and replacement optimization models generally ignore price uncertainty despite researchers stressing its importance.
The current study developed an approach to include multiple price uncertainties in maintenance and replacement optimization for repairable infrastructure assets which occasionally fail and are allowed to fail. This model includes the flexibility to choose between multiple successive intervention strategies subject to asset degradation and structural failure.
State explosion is prevented by combining multiple price uncertainties into portfolios and exploiting the convenient characteristics of recombining binomial lattices. Whereas structural failure is modeled by interference theory, asset degradation follows a time-variant failure rate obtained expert judgment or trend testing, and transition probabilities are derived from available price data.
The model is demonstrated on an existing infrastructure case study with intervention strategies to maintain, overhaul, major overhaul and renew. The results indicate that price uncertainty indeed influences the first year’s optimal decision-making.
Hence, the current research validates the observations of previous researchers regarding the importance of addressing price uncertainty with respect to maintenance and replacement decisions. The forecast and inclusion of price uncertainty in current maintenance and optimization modeling deserve more attention in further research and professional practice.
The main managerial implication of the current research is that price uncertainty may influence optimal decision-making on maintenance and renewal. The approach developed benefits infrastructure asset owners and service contractors in accurate, short- and midterm decision-making under uncertainty while taking long-term optimal decision-making into account. Accurate short- and mid-term decision-making and planning is very important for capital intensive infrastructure with long design lives after renewal.
However, the current model is not without limitations. Although the results contain all future optimal decisions, this long-term planning information is difficult to extract from the results because of the many uncertainty states. As future research, the current research proposes to develop methods for a more compact visualization of results. Other directions for further research are method to reduce state explosion and inclusion of a probabilistic approach to asset deterioration modeling.
Supplemental Material
Download MS Word (76.4 KB)Acknowledgements
We owe much gratitude to Wouter van Vuuren, Ron van de Wiel, Wim Milder, Dert van Ree, and their colleagues from Water Authority Rivierenland for their valuable input: a case study with cost data, failure data and intervention strategies, and for their verification of the usefulness of the results.
Disclosure statement
No potential conflict of interest is reported by the authors.
Data availability statement
The data of construction prices that support the findings of this study are openly available in CBS Statline at https://opendata.cbs.nl/statline/#/CBS/en/dataset/81139eng/table?ts=1547989906393
The data on maintenance and energy prices that support the findings of this study are available at https://www.crow.nl/publicaties/indexen-risicoregelingen-gww.
Related Research Data
References
- ACM., 2017. WACC drinkwater 2018-2019 (WACC drinking water 2018–2019). The Hague, The Netherlands: Authority for Consumers and Markets.
- Adey, B.T., Burkhalter, M., and Lethanh, N., 2018. Determining an optimal set of work zones on large infrastructure networks in a GIS framework. Journal of infrastructure systems, 24(1), 04017048.
- Almeida, J.O., Teixeira, P.F., and Delgado, R.M., 2015. Life cycle cost optimization in highway concrete bridges management. Structure and infrastructure engineering, 11, 1263–1276.
- Ascher, H., 2007. Different insights for improving part and system reliability obtained from exactly same DFOM “failure numbers. Reliability engineering & system safety, 92, 552–559.
- Ascher, H., and Feingold, H., 1984. Repairable systems reliability. New York, NY: Marcel Dekker, Inc.
- AWWA., 2019. 2018 State of the water industry report reveals long-term trends. Available from: https://www.awwa.org/Portals/0/AWWA/Development/Managers/2018_SOTWI_Report_Final_v3.pdf [Accessed 30 July 2019].
- Baik, H.-S., Seok Jeong, H., and Abraham, D.M., 2006. Estimating transition probabilities in Markov chain-based deterioration models for management of wastewater systems. Journal of water resources planning and management, 132, 15–24.
- Black, F., and Scholes, M., 1973. The pricing of options and corporate liabilities. Journal of political economy, 81, 637–654.
- Brealey, R.E., Myers, S.C., and Allen, F., 2017. Principles of corporate finance. 12th ed. New York, NY: McGraw-Hill Education.
- Buyukyoran, F., and Gundes, S., 2018. Optimized real options-based approach for government guarantees in PPP toll road projects. Construction management and economics, 36, 203–216.
- Carbonara, N., and Pellegrino, R., 2018. Revenue guarantee in public-private partnerships: a win-win model. Construction management and economics, 36, 584–598.
- Cardin, M.-A., Neufville, R., and Geltner, D.M., 2015. Design catalogs: a systematic approach to design and value flexibility in engineering systems. Systems engineering, 18, 453–471.
- CBS Stateline, 2018. Civil engineering works; input price index 2000 = 100, from 1979 [online]. The Netherlands, CBS. Available from: https://opendata.cbs.nl/statline/#/CBS/en/dataset/81139eng/table?ts=1547989906393 [Accessed 20 January 2019].
- Compare, M., Martini, F., and Zio, E., 2015. Genetic algorithms for condition-based maintenance optimization under uncertainty. European journal of operational research, 244, 611–623.
- Copeland, T., and Antikarov V., 2003. Real options. A practitioner's guide. London, UK: The Penguin Group.
- Costello, S.B., et al., 2005. Stochastic model for strategic assessment of road maintenance. Proceedings of the institution of civil engineers - transport, 158, 203–211.
- Cox, J.C., Ross, S.A., and Rubinstein, M. 1979. Option pricing: a simplified approach. Journal of financial economics, 7, 229.
- CROW., 2018. Indexen risicoregelingen GWW [online]. The Netherlands, CROW. Available from: https://www.crow.nl/publicaties/indexen-risicoregelingen-gww [Accessed 30 July 2019].
- De Neufville, R., and Scholtes, S., 2011. Flexibility in engineering design. Cambridge, MA: Massachusetts Institute of Technology.
- Elcheikh, M., Al Sheikh, D., and Burrow, M.P.N., 2013. Project appraisal of rail projects using fuzzy sets theory. International journal of railway technology, 2, 32–62.
- Elcheikh, M., and Michael, P.N.B., 2017. Uncertainties in forecasting maintenance costs for asset management: application to an aging canal system. ASCE-ASME journal of risk and uncertainty in engineering systems, part A: civil engineering, 3, 04016014.
- Faddoul, R., Raphael, W., and Chateauneuf, A., 2011. A generalised partially observable Markov decision process updated by decision trees for maintenance optimization. Structure and infrastructure engineering, 7, 783–796.
- Faghih Sayed Amir, M., and Kashani, H., 2018. Forecasting construction material prices using vector error correction model. Journal of construction engineering and management, 144, 04018075.
- Farida Agustini, W., Affianti, I.R., and Putri, E.R.M., 2018. Stock price prediction using geometric Brownian motion. Journal of physics: conference series, 974, 012047.
- Feng, Z., Zhang, S.-B., and Gao, Y., 2015. Modeling the impact of government guarantees on toll charge, road quality and capacity for build-operate-transfer (BOT) road projects. Transportation research part A: policy and practice, 78, 54–67.
- FHWA. 2019. Conditions and performance [online]. Washington, DC, FHWA. Available from: https://www.fhwa.dot.gov/policy/2013cpr/chap12.cfm [Accessed 30 July 2019].
- Ford, D.N., Lander, D.M., and Voyer, J.J., 2002. A real options approach to valuing strategic flexibility in uncertain construction projects. Construction management and economics, 20, 343–351.
- Francis, J.C., and Kim, D., 2013. Modern portfolio theory: foundations, analysis, and new developments + website. Hoboken, NJ: Wiley.
- Frangopol, D., 2011. Life-cycle performance, management, and optimization of structural systems under uncertainty: accomplishments and challenges. Structure and infrastructure engineering, 7, 389–413.
- Frangopol, D.M., Kallen, M.-J., and van Noortwijk, J.M., 2004. Probabilistic models for life-cycle performance of deteriorating structures: review and future directions. Progress in structural engineering and materials, 6, 197–212.
- Guthrie, G., 2009. Real options in theory and practice. Oxford, UK: Oxford University Press.
- Haffner, J.D., and Gennady, E.M., 2011. Water infrastructure issues. New York, NY: Nova Science Publishers.
- Hall, J.W., et al., 2016. The future of national infrastructure: A system-of-systems approach. Cambridge, UK: Cambridge University Press.
- Hillier, F.S., and Lieberman, G.J., 2010. Introduction to operations research. Boston, MA: McGraw-Hill.
- Ilbeigi, M., Castro-Lacouture, D., and Joukar, A., 2017. Generalized autoregressive conditional heteroscedasticity model to quantify and forecast uncertainty in the price of asphalt cement. Journal of management in engineering, 33, 04017026.
- Ilg, P., Scope, C., Muench, S., and Guenther, E., 2017. Uncertainty in life cycle costing for long-range infrastructure. Part I: leveling the playing field to address uncertainties. The international journal of life cycle assessment, 22, 277–292.
- Kim, K., Park, T., Bang, S., and Kim, H., 2017. Real options-based framework for hydropower plant adaptation to climate change. Journal of management in engineering, 33, 04016049.
- Klatter, L., Vrouwenvelder, T., and van Noortwijk, J., 2009. Societal and reliability aspects of bridge management in the Netherlands. Structure and Infrastructure Engineering, 5, 11–24.
- Kolobov, M., and Kolobov, A., 2012. Planning with Markov decision processes: an AI perspective. San Rafael, CA: Morgan and Claypool.
- Lander, D.M., and Pinches, G.E., 1998. Challenges to the practical implementation of modeling and valuing real options. The quarterly review of economics and finance, 38, 537–567.
- Lange, D.A., 2018. The relevance of ageing for civil infrastructure: The profession, the politics, the classroom. In: v.B. Klaas, D. Koleva, and T. van Beek, eds., The ageing of materials and structures: towards scientific solutions for the ageing of our assets. Cham, Switzerland: Springer International Publishing.
- Leira, B.J., 2013. Optimal stochastic control schemes within a structural reliability framework. New York, NY: Springer International Publishing.
- Lethanh, N, Hackl, J., and Adey, B.T., 2017. Determination of Markov transition probabilities to be used in bridge management from mechanistic-empirical models. Journal of bridge engineering, 22(10), 4017063.
- Lin, P., Yuan, X.‐X., and Tovilla, E., 2019. Integrative modeling of performance deterioration and maintenance effectiveness for infrastructure assets with missing condition data. Computer-aided civil and infrastructure engineering, 34, 677–695.
- Liu, J., Gao, R., and Yuen, J.C.C., 2017. Pricing mechanism of early termination of PPP projects based on real option theory. Journal of management in engineering, 33, 04017035.
- Maier, S., Polak, J.W., and Gann, D.M., 2018. Valuing portfolios of interdependent real options using influence diagrams and simulation-and-regression: a multi-stage stochastic integer programming approach. Computers and operations research, 104505. doi:10.1016/j.cor.2018.06.017
- Markowitz, H., 1952. Portfolio selection. The journal of finance, 7, 77–91.
- Martani, C., Cattarinussi, L., and Adey, B.T., 2018. A new process for the evaluation of the net-benefit of flexible ground-floor ceiling in the face of use transition uncertainty. Journal of building engineering, 15, 156–170.
- Masteri, K., Venkatesh, B., and Freitas, W., 2018. A fuzzy optimization model for distribution system asset planning with energy storage. IEEE transactions on power systems, 33(5), 5114–5123.
- McGregor, S., et al., 2017. Interactive visualization for testing Markov Decision Processes: MDPVIS. Journal of visual languages & computing, 39, 93–106.
- Merton, R.C., 1973. Theory of rational option pricing. The Bell journal of economics and management science, 4, 141–183.
- Mirzadeh, I., Butt, A.A., Toller, S., and Birgisson, B., 2014. Life cycle cost analysis based on the fundamental cost contributors for asphalt pavements. Structure and infrastructure engineering, 10, 1638–1647.
- Mohanta, D.K., Sadhu, P.K., and Chakrabarti, R, IEEE PES Power Systems Conference, and GA USA Exposition Atlanta., 2005. Fuzzy Markov model for determination of fuzzy state probabilities of generating units including the effect of maintenance scheduling. IEEE transactions on power systems, 20(4), 2117–2124.
- Mun, J., 2006. Real options analysis. Tools and techniques for valuing strategic investment and decisions. Hoboken, NJ: Wiley Finance Series - Wiley & Sons.
- NEN-EN., 1990. Eurocode: Basis of structural design. Delft, The Netherlands: Normalisatie Instituut.
- NEN 8700., 2011. Beoordeling van de constructieve veiligheid van een bestaand bouwwerk bij verbouw en afkeuren - Grondslagen (Assessment of existing structures in case of reconstruction and disapproval - Basic Rules). Delft, The Netherlands: Normalisatie Instituut.
- Oliveira, J.R.M., et al., 2017. Two-Stage multiobjective optimization of maintenance scheduling for pavements. Journal of infrastructure systems, 23(3). doi:10.1061/(ASCE)IS.1943-555X.0000355
- Orcesi, A., 2016. CEDR transnational road research programme: re-gen risk assessment of ageing infrastructure. Brussels, Belgium: CEDR Transnational Road Research Programme.
- Park, T., Kim, B., and Kim, H., 2012. Impact of deterioration and negotiation on sewer system O&M contracts from the real option perspective. Water resources management, 26, 2973–2989.
- Pascual, R., Ortega, J.H., and Qualita, N.F., 2006. Optimal replacement and overhaul decisions with imperfect maintenance and warranty contracts. Reliability engineering & system safety, 91, 241–248.
- Pellegrino, R., et al., 2011. A real options-based model to supporting risk allocation in price cap regulation approach for public utilities. Construction management and economics, 29, 1197.
- Power, G.J., et al., 2016. Valuation of strategic options in public-private partnerships. Transportation research Part A: policy and practice, 90, 50–68.
- Puterman, M. L., 1994. Markov decision processes: discrete stochastic dynamic programming. New York, NY: Wiley.
- Rehan, R., et al., 2016. Development of unit cost indices and database for water and wastewater pipelines capital works. Journal of cost analysis and parametrics, 9, 127–160.
- Rigdon, S.E., and Basu, A.P., 2000. Statistical methods for the reliability of repairable systems. New York, NY: John Wiley & Sons, Inc.
- Robelin, C.-A., and Madanat, S.M., 2007. History-dependent bridge deck maintenance and replacement optimization with Markov decision processes. Journal of infrastructure systems, 13, 195–201.
- Rubinstein, M., 1994. Implied binomial trees. The journal of finance, 49, 771–818.
- Sánchez-Silva, M., and Georgia-Ann, K., 2016. Reliability and life-cycle analysis of deteriorating systems. New York, NY: Springer International Publishing.
- Scope, C., Ilg, P., Muench, S., and Guenther, E., 2016. Uncertainty in life cycle costing for long-range infrastructure. Part II: guidance and suitability of applied methods to address uncertainty. The international journal of life cycle assessment, 21, 1170–1184.
- Shafiee, M., Finkelstein, M., and Chukova, S., 2011. Burn-in and imperfect preventive maintenance strategies for warranted products. Proceedings of the institution of mechanical engineers, part O: journal of risk and reliability, 225, 211–218.
- Sinha, K.C., Labi, S., and Agbelie, B.R.D.K., 2017. Transportation infrastructure asset management in the new millennium: continuing issues, and emerging challenges and opportunities. Transportmetrica A: transport science, 13, 591–606.
- Stewart, M.G., 2001. Reliability-based assessment of ageing bridges using risk ranking and life cycle cost decision analyses. Reliability engineering & system safety, 74, 263–273.
- Swei, O., Gregory, J., and Kirchain, R., 2017. Probabilistic approach for long-run price projections: case study of concrete and asphalt. Journal of construction engineering and management, 143, 05016018.
- Van den Boomen, M., et al., 2018. Untangling decision tree and real options analyses: a public infrastructure case study dealing with political decisions, structural integrity and price uncertainty. Construction management and economics, 37, 24–43.
- Van den Boomen, M., van den Berg, P.L., and Wolfert, A.R.M., 2019. A dynamic programming approach for economic optimization of lifetime-extending maintenance, renovation, and replacement of public infrastructure assets under differential inflation. Structure and infrastructure engineering, 15(2), 193–205.
- Walraven, E.M.P., and Spaan, M.T.J., 2018. Column generation algorithms for constrained POMDPs. Journal of artificial intelligence research, 62, 489–533.
- Wirahadikusumah, R., Abraham, D.M., and Castello, J., 1999. Markov decision process for sewer rehabilitation. Engineering, construction and architectural management, 6, 358–370.
- Woodward, M., Kapelan, Z., and Gouldby, B., 2014. Adaptive flood risk management under climate change uncertainty using real options and optimization. Risk analysis: an official publication of the society for risk analysis, 34, 75–92.
- Younis, R., et al., 2016. Forecasting the unit price of water and wastewater pipelines capital works and estimating contractors’ markup. Journal of cost analysis and parametrics, 9, 46–68.
- Yu, M.K.W., and Ive, G., 2011. Orders and output in UK construction statistics: new methodology and old problems. Construction management and economics, 29, 653.