
 ?Mathematical formulae have been encoded as MathML and are displayed in this HTML version using MathJax in order to improve their display. Uncheck the box to turn MathJax off. This feature requires Javascript. Click on a formula to zoom.
Abstract
Implementing a comprehensive and globally adaptable assessment approach for causes of low construction productivity has proven to be a contemporary challenge. This prevails since the factors influencing the construction industry vary significantly by geographic region and operational characteristics. Hence, substantial research on this topic has restricted its scope to a particular location without a comprehensive global categorization. Furthermore, much of this research has neglected the influence of subjectivity in the stakeholder response evaluations. To address these shortcomings, this study provides a unique assessment of the construction context initiated by a systematic review of 130 studies published worldwide over the previous 32 years. The 915 unique factors from this systematic review were then categorized into regional and productivity dimensions through Pareto and Frequency analysis techniques. The regional categorization encompassed nine distinct regions spanning the world, while the productivity component encompassed a set of 14 distinctive benchmarks that characterize productivity in the construction industry. These sorted factors were then adapted in the Sri Lankan context as a pilot study through a cross-sectional survey including 117 stakeholders. The following Fuzzy analysis allowed the mitigation of the ambiguity of these survey responses while ranking the factors based on a calculated importance index while also considering the interdependence of the introduced benchmarks. Ultimately, the employed assessment approach for identifying and ranking factors contributing to low construction productivity in this study is proposed as globally adaptable with its successful incorporation of subjective evaluation.
Introduction
Due to the challenges posed by competitiveness and the subjectivity of the sector, the construction industry must function at a high rate of performance and efficiency to achieve favorable outcomes for all stakeholders (Park et al. Citation2005). The respective challenging nature of the industry has captured the attention of scholars and professionals keen on improving productivity within the sector. Extensive research has been conducted on the subject, but no solid approach that is globally applicable has been developed (Ranasinghe et al. Citation2012).
Within academic economics, a well-established set of definitions of productivity exists. However, there is a lack of consensus in the construction sector over the most appropriate definition for evaluating construction productivity performance. This industry’s uniqueness results from complicated and diversified project scopes regulated by many stakeholders and input factors (Crawford and Vogl Citation2006).
Integrating automation into global industries and their partners has significantly enhanced the efficiency of specific systems within the context of the industrial environment. However, many industries remain vulnerable due to the complexity and difficulty of excluding manual labor. The construction industry is one such pretentious sector due to substantial manual input compared to other recognized industries (US Department of Commerce Citation2019).
Identifying distinctive factors influencing construction productivity performance has always been challenging (Jarkas and Bitar Citation2012). Many have chosen to use approaches that gather responses from the industry’s key stakeholders, such as the labor and management segments of the construction industry. However, the subjectivity of the respondents was not adequately recognized in the data analysis by these different approaches. Furthermore, suitable strategies for elaborating the collective influence of many variables contributing to poor construction productivity were absent, and remedying this remains an essential priority in productivity evaluation (Abdullah and Khadiah Citation2011).
In addition, it has been emphasized that enhancing construction industry productivity is a significant endeavor that can only be accomplished via continued research and development (Wong et al. Citation2021). We have developed and successfully tested a comprehensive assessment approach to achieve the stated objective (). This assessment approach addresses several vital considerations, including the multitude of factors that contribute to low construction productivity, regional variations within the industry, the incorporation of total-factor productivity, the subjectivity involved in the evaluation, and the interdependence of the assessed factors. The respective approach further allowed us to consolidate numerous studies and cases concerning construction productivity onto a single global platform.
Productivity assessment in construction
Definitions of construction productivity
Construction productivity evaluation approaches that have been used in the global setting can mainly be divided into two categories: Partial Productivity (PP) and Multi-Factor Productivity (MFP) (Bureau of Labor Statistics Citation2015). Partial productivity measures the productivity of production variables, such as labor or materials, whereas multi-factor productivity considers numerous factors simultaneously (Park et al. Citation2005, Crawford and Vogl Citation2006).
Horner and Duff (Citation2001) elaborate upon the significance of implementing MFP within the construction productivity assessments. They contend that labor productivity and capital productivity are the most fundamental determinants influencing the construction industry, necessitating a multi-factor analysis for more precise outcomes. This argument is best exemplified by Loosemore (Citation2014), who argues that measuring labor productivity in the context of “Production by a worker” is the simplest method to do so in construction. Moreover, Loosemore (Citation2014) further elaborates that, as an industry that continually coordinates with technological improvements, construction output assessed as production by a worker is not always accurate simply because it does not account for technological superiority. Thus, the necessary technical engagement is considered capital productivity in MFP and optimal in interactions with the construction sector.
Furthermore, Carson and Abbott (Citation2012) demonstrate shortcomings in the Multi-Factor Productivity model in the construction sector. Their analysis demonstrates that focusing on the output of a worker with the inclusion of technology input ignores the function of management, contractor regulations, and other influencing environmental aspects. As a result, the actual productivity rating for the considered environment is deemed unachievable. Addressing the respective shortcomings, Carson and Abbott (Citation2012) highlight Total Factor Productivity (TFP), which includes MFP as well as the diversity of human resolutions, regional-geographical perspectives, environmental surroundings, economic aspects, scarcity and availability of resources, and several other variables. However, owing to the difficulty of including a wide range of parameters in construction productivity assessment, the TFP model is underutilized in the construction industry (Loosemore Citation2014).
The construction industry’s productivity performance has been declining over the last two decades compared to other major global industries (Wong et al. Citation2021). Hence, improving current performance and incorporating new technologies is critical for the sector to remain competitive in the global financial sweepstakes. However, as noted previously, accurate productivity assessment through TFP is essential for enhancing productivity performance. Hence, this study introduces a practical and adaptive assessment approach that allows for apprehending accurate productivity performance via TFP while incorporating subjective evaluation and interdependency of the causes. In this study, we did not consider productivity performance calculation or evaluation across diverse hierarchical levels of the construction industry, as our scope was mainly focused on assessing and classifying the causes of low productivity in the construction industry.
Factors causing low construction productivity
Due to the subjectivity of the construction industry, the causes of poor construction productivity are typically diverse and context-specific. According to Hasan et al. (Citation2018), the variance becomes more noticeable based on the origin of the analysis and the assessment approach. Henceforth, we have conducted a thorough investigation of such various aspects across different countries worldwide (), and some noticeable results are indicated in . We conducted this analysis utilizing published literature from Scopus-indexed journals (Supplementary Annexure 01-C), and we did not consider global country-specific measuring standards in the construction industry within the scope of the study.
Figure 1. Origin and distribution of analyzed studies over the globe—130 studies (1991–2022)—heat map.
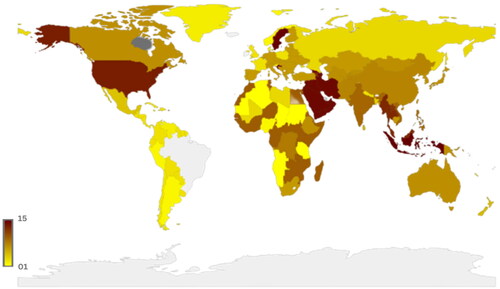
Table 1. Factors affecting construction productivity in different countries worldwide.
Methodology of assessment
The main concern in assessing construction productivity for us was the high number of factors the global literature presented worldwide. Further literature on the topic is limited to a specific context of the author’s choosing for the respective research (Hasan et al. Citation2018). As a result, an interested researcher/s in assessing the causes of low productivity in the construction industry would be forced first to conduct a background study. This background study would be a repetition of the same analogy that many researchers have employed previously but in a different context. Hence, from this study, we aimed to deliver a comprehensive categorization and an assessment approach that any researcher could adapt to determine the leading causes of low productivity in the construction industry in any country. For this assessment, we only treated the detrimental influence of the selected factors on construction productivity.
The approach used in this study to achieve the above outcome is elaborated in . We selected the studies for the analysis from global literature through a unique keyword assessment with a thirty-two-year time frame (), as elaborated in section Regional assessment of factors affecting construction productivity (primary analysis) of this study. We classified the focus regions of each research based on the chosen 130 studies, which enabled us to divide the worldwide literature into nine separate geographical groups () and further collected 915 variables in total from the selected literature. Since several factors were shown to be repeated across studies, we performed a unique sorting applying Pareto analysis and Frequency analysis techniques to group the 915 detected elements into 14 predominant benchmarks of construction productivity (). We introduced these benchmarks, which are unique for this research, based on the distribution of the 915 criteria and a thorough investigation of existing literature, allowing total factor productivity (TFP) evaluation, as discussed in detail in section Productivity assessment in construction. Then, using 964 entries, we determined the most prevalent factors under each of the 14 benchmarks. The increase in entries from 915 to 964 was due to the broad scope of various factors reported in the literature that carried a scope categorizable into two or more benchmarks.
Figure 2. The proposed adaptive assessment approach for assessing and ranking factors leading to low construction productivity mitigating subjective biases.
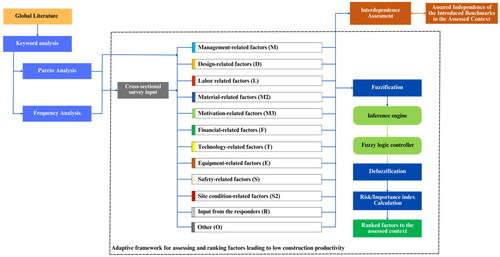
Figure 3. Main research interest clusters using a co-occurrence network of keywords from the selected studies (130 studies).
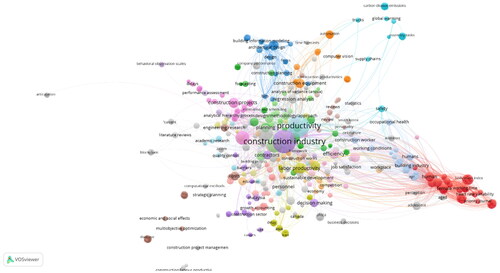
Figure 4. Number of assessed factors in each region with cross-percentage comparison (915 factors, 130 studies) [205 (25)—Number of factors (Number of studies)].
![Figure 4. Number of assessed factors in each region with cross-percentage comparison (915 factors, 130 studies) [205 (25)—Number of factors (Number of studies)].](/cms/asset/17dc4a65-0a86-4a69-bd4b-722375693287/rcme_a_2377712_f0004_c.jpg)
Table 2. Summary of Pareto analysis carried over the introduced regions and benchmarks (number of identified factors—915).
Then, we integrated the Fuzzy analysis technique with specifically developed Fuzzy sets and memberships for the particular study (). The respective incorporation enabled us to resolve the vagueness prominent in human language responses in evaluating construction productivity performance. As a demonstration of this approach, we analyzed the Sri Lankan construction setting employing a cross-sectional survey of industry stakeholders, obtaining 117 responses in total (section Cross-sectional survey—a case study in Sri Lanka).
Additionally, we assessed the interdependence of the benchmarks established in the research and the predominant variables derived within each of the benchmarks. We included three different interdependence possibilities in the analysis, as detailed in section Interdependence assessment, which successfully demonstrated the uniqueness of each benchmark introduced for the study. Furthermore, the approach used in the study to determine the most prevalent factors causing low construction productivity from cross-sectional survey input and Fuzzy analysis in a specific context is further developed and discussed as an adaptive assessment approach to mitigate subjective biases () in section Findings and discussion as the research delivery ultimatum.
Regional assessment of factors affecting construction productivity (primary analysis)
Since the operating characteristics of the construction industry vary significantly across different locations worldwide, as do the variables impacting industry operation, we focused on and classified several regions in this study for broader analytical results.
Keyword analysis
First, we selected 130 studies for the analysis based on a keyword search of publications outlined by the Scopus publishers. Following a thirty-two-year timeframe that ended in December 2022, we analyzed these studies in a global context.
We identified these studies through prominent keyword searches beginning with (1) Construction, (2) Productivity, (3) Planning, (4) Evaluation, (5) Engineering, (6) Review, (7) Efficiency, (8) Risk, (9) Labor, and (10) Management. Subsequently, we included the chosen studies in VOSviewer, a software tool often used for visualizing and analyzing bibliometric networks. VOSviewer facilitated generating a co-occurrence network of keyword clusters, as seen in . Continuing the search on prominent results of these keyword clusters, we accumulated 130 studies for the analysis.
Regional characterization
During the evaluation of the selected studies, we conducted an assessment of the geographical emphasis of each study. Our findings revealed a significant research concentration in six specific regions: (1) Australia–New Zealand region, (2) North American region, (3) Asian Region, (4) European region, (5) South American region, and (6) African region (). This characterization was also supported by comparable attributes identified across three critical criteria: (1) economic condition, (2) construction norms and standards, and (3) the construction context of the identified regions.
Further examining the studies over the geographical context, we observed a considerable variation of the factors in the Asian region. Further research indicated that this difference results from various economic and financial capacities of inheriting countries and major cities and capitals within a country (Thomas and Sudhakumar Citation2013). Hence, we strongly emphasized differentiating the Asian construction context, extending the focus regions from six to nine by incorporating (1) Eastern Asian/Russian region, (2) Southeast Asian region, (3) South Asian region, and (4) Middle East region to the analysis, in place of the Asian region (). Then, we proceeded to categorize the 915 factors given by the authors of the chosen 130 studies into the introduced nine distinct geographical regions ().
Primary benchmarks for the analysis
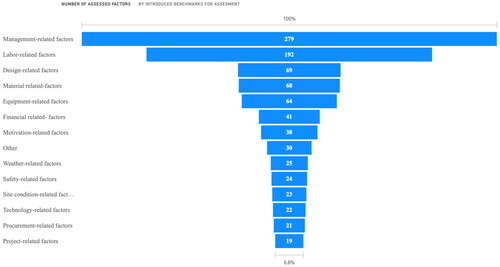
Following the geographical categorization to meet the objective of categorizing the main factors contributing to low construction productivity globally, we derived a common assessment approach for categorizing the scope (Pekuri et al. Citation2014). For this, we introduced fourteen distinct construction productivity benchmarks for the analysis (). This classification allowed all the factors presented by various researchers worldwide to be classified into these fourteen benchmarks. We produced all these benchmarks with a specific scope and limits that allowed them to remain distinct from the peer benchmarks (Supplementary Annexure 01-A).
Figure 5. Cross percentage comparison of assessed factors against introduced benchmarks (total—964 with repetition).
Overview of Pareto and frequency analyses
Pareto analysis
The Pareto principle introduced by Vilfredo Pareto emphasizes disparity between effort invested and results achieved (Craft and Leake Citation2002). For example, one may learn that 13% of labor-related factors contributed to 87% of productivity or that 30% of underlying reasons may solve 70% of problems in the industry. As is typically the case with construction productivity-related factors, we concluded that Pareto analysis is appropriate for more accurately categorizing the factors under the new productivity benchmarks. Furthermore, the provision in the Pareto analysis for assessing factors that may not belong to one scope or may not be distributed uniformly over the benchmarks further validated the selection (Ab Talib et al. Citation2015).
Following the fundamental technique provided by the Pareto analysis, we re-evaluated the 915 factors classified into different regions and among the 14 benchmarks introduced. We focused on the scope of the benchmark, the study in consideration, the geographical context under consideration, and the factors according to Pareto principles in this categorization. As some studies introduced factors that are not characterizable only under one benchmark, some entries had to be repeated across the benchmarks, which led to 964 entries for the Pareto assessment (). Ultimately, we developed a complete classification system for factors impacting geographical context and construction productivity globally ().
Frequency analysis
After assigning benchmarks to all the elements, we generated a dataset to conduct a cross-sectional survey to evaluate the influence of subjectivity in productivity assessment. For the preparation of the survey, we performed a frequency assessment within each benchmark to find the most predominant factors associated with each benchmark. We proceeded with selecting five components for each benchmark, employing these results. Further, through the frequency analysis results, we distinctly presented the factors considered for each region and productivity benchmarks ().
The issue of repetition identified during the Pareto analysis was addressed and resolved during this evaluation. The rectifying technique involved determining the benchmark with the highest frequency for each relevant factor and allocating the factor exclusively to that benchmark, thereby bringing the number of entries to the original 915 from 964. For a more convenient assessment, the cross-sectional survey only featured 11 benchmarks. We removed three benchmarks based on the regional and productivity evaluation results, which revealed that the weather, procurement process, and project-related factors had the highest non-contribution (No factors) over the regional evaluation (). Nonetheless, due to their prominence as fundamental benchmarks in construction productivity evaluation, we included all three benchmarks as components under the “other” benchmark (). On the other hand, since the factors falling under the “other” benchmark from the Pareto analysis had no prevailing frequency, we did not continue any factors from the relevant benchmark into the cross-sectional survey.
Table 4. Composition of the survey sent to evaluate the criticality and frequency of the identified factors leading to low construction productivity.
Temporal variation assessment
Since we encompassed studies published across 32 years for our review, we examined for any temporal fluctuation, significantly if the influence of dominant benchmarks had changed over time as a whole and across different regions. This examination revealed significant variance in both global and regional contexts (Supplementary Annexure 01-B).
However, due to the necessity for additional research and data analysis to comprehend the underlying reasons for this variance, we have not included temporal considerations as part of the scope of this study, focusing primarily on subjective evaluation.
Cross-sectional survey—a case study in Sri Lanka
Following this, we proceeded to obtain a dataset that would enable the assessment of the subjectivity of the responses. As elaborated in section Overview of Pareto and Frequency Analyses, the cross-sectional survey encompassed 53 factors going into the industry stakeholders. To account for any unique factors that may impact productivity within the assessed setting, we included a further section, “Input by responders”, to encompass these components. Furthermore, by this inclusion, we attempted to integrate the omitted factors during Pareto analysis from “other” benchmarks specific to the considered context in the research (). Further, from the survey results to the subjectivity analysis, we incorporated the five factors that carried the highest frequency under the “Input by Responders” benchmark.
We carried out the cross-sectional study targeting stakeholders in the Sri Lankan construction industry. We incorporated responses predominately from the building industry stakeholders, owing to the large number of components that impede productivity in the sector and the wide variety that the building industry exhibits in the Sri Lankan setting. The composition of the responses received for the cross-sectional survey is given in .
Table 3. Composition of the respondents to the survey.
We conducted the survey in person with the targeted audience, allowing clarification for responders on the included questions. As the study included a varied group of stakeholders, we emphasized gathering a diverse range of responses. This allowed us to interpret subjectivity in the responses more accurately.
In the survey, we included three distinct components that evaluated the following: 1. Criticality 2. Frequency, and 3. Interdependence on each identified benchmark related to construction productivity (Petrović et al. Citation2014).
Criticality and frequency assessment
The questionnaire survey included 53 sub-facets listed under eleven predominate benchmarks (), identified through the primary analyses performed in section Regional assessment of factors affecting construction productivity (primary analysis) spanning the globe. For each of the facets mentioned above and the five predominant factors identified by the respondents under the “Input by responders” category, we introduced two categories of assessment on criticality and frequency, as indicated in .
Table 5. Analogy of the criticality and frequency of the employed survey.
Criticality assessment (through a rating system ranging from 1 to 5) ().
Frequency assessment (by percentage input ranging from 0 to 100%) ().
Interdependence assessment
In this study, we used the interdependence assessment to eliminate any interconnectedness that may have been interpreted between the introduced benchmarks, especially in the Sri Lankan construction sector. Hence, we approached and interviewed only the stakeholders that contribute majorly to project decision-making, who are project managers and engineers, to obtain more accurate and interpreted outcomes ().
Fuzzy analysis for criticality and frequency assessment
The ambiguity inherited by respondent inputs, more generally referred to in the literature as linguistic variability between responses, is a crucial concern that emerged in utilizing survey data for evaluations. These could be classified as variables but expressed in euphemisms, phrases, or sentences. Using these components to determine relative importance in decision-making processes is problematic. Furthermore, determining criticality and frequency levels is not a purely statistical exercise, as the concepts behind these terms are inherently intangible and difficult to explain (Abdullah and Khadiah Citation2011).
Hence, we used Fuzzy analysis to mitigate this ambiguity, based on the concepts proposed in 1965 by Loft A. Zadeh. The Fuzzy sets Zadeh introduced translate the elements in each domain to a selected set via an internally generated membership function (Zadeh Citation1965). This assessment technique enables the categorization of mutilative logic. The assessment further allows for the evaluation of intermediate values/replies into more typical crisp responses. Furthermore, it is widely known for assessing imprecise knowledge and linguistic expressions and could be combined with conventional assessment methodologies. Hence, we integrated Fuzzy analysis into this study, allowing us to accurately evaluate criticality and frequency assessments of the factors leading to low construction productivity (Kumar et al. Citation2015).
Fuzzification
To transpose the survey’s results into numerical values, we first established arithmetical values for the criticality and frequency ranges (). These values define the linguistic variables across a broader spectrum, allowing for the inherent variety of human awareness (Zhang and Chu Citation2011).
Table 6. Assigned numerical values for linguistic variables.
After assigning values to each assessed variable, we derived the centroid () of the distribution for each component using weightage index (W) calculations, with the utilization of the SPSS application, as given by EquationEquation (1)(1)
(1) (w—assigned numerical value, f—number of responses).
(1)
(1)
Figure 6. (a) Centroid (criticality assessment)—incompetent management team subfactor, (b) criticality fuzzy set—membership functions utilized in the analysis, (c) frequency fuzzy set—membership functions utilized in the analysis, (d) risk fuzzy set with results for incompetent management team sub factor [Risk Fuzzy value = (0,0,0.5,0.5,0), Crisp value—4.85)].
![Figure 6. (a) Centroid (criticality assessment)—incompetent management team subfactor, (b) criticality fuzzy set—membership functions utilized in the analysis, (c) frequency fuzzy set—membership functions utilized in the analysis, (d) risk fuzzy set with results for incompetent management team sub factor [Risk Fuzzy value = (0,0,0.5,0.5,0), Crisp value—4.85)].](/cms/asset/b9e724b5-4bf9-44b7-bf64-2f8d4118cd6d/rcme_a_2377712_f0006_c.jpg)
Having acquired the centroid values for the criticality and frequency of the investigated factor, we calculated the Fuzzy values for both criteria. We utilized the Fuzzy sets in these calculations, uniquely developed for this study, as shown in , respectively. Afterward, we mapped the crisp value onto the generated membership functions, which enabled us to extract a Fuzzy number with five variables depending on the membership function’s range () (Petrović et al. Citation2014).
Inference
Then, we mapped the acquired Fuzzy values for criticality and frequency using a system of rules to the Fuzzy risk set, as shown in (Gargama and Chaturvedi Citation2011). The respective mapping process allowed us to bring the criticality and frequency numbers into one risk assessment platform, further allowing us to develop an index for ranking the resulting factors.
Table 7. Inference engine to map with fuzzy risk set.
Defuzzification
Following inference, we fed the respective criticality and frequency Fuzzy numbers to the developed risk Fuzzy set and defuzzified using the centroid approach (). As shown in , the respective method enabled us to get two unique, crisp values for risk, depending on the criticality and frequency input parameters (Owens and Coppola Citation2012).
Table 8. Ranking of the resulting factors through Fuzzy analysis (refer to for ID).
Calculating risk/importance index for productivity
We evaluated three distinct models in this study to determine the importance (risk) index (Equation(2)(2)
(2) , Equation(3)
(3)
(3) , and Equation(4)
(4)
(4) ). For this evaluation, we considered possible systems to identify and rank the most concerning aspects in the considered context (Kane et al. Citation1989). (I—Importance index, C—Criticality crisp value, F—Frequency crisp value, a = [var (ln F)/var (ln C)]1/2.)
(2)
(2)
(3)
(3)
(4)
(4)
We employed model Equation(3)(3)
(3) in the study since model Equation(2)
(2)
(2) lacks the capacity to be interpreted coherently, and model Equation(4)
(4)
(4) contradicts the Fuzzy model used to determine the importance factor. Furthermore, model Equation(3)
(3)
(3) allows for the quantification of the results of an activity more precisely, justifying the selection (Kane et al. Citation1989).
Interdependence assessment
As the final evaluation of the study, we introduced a unique assessment approach that scores each of the benchmarks for interconnectivity (de Jong and Matthijs Bal Citation2014) (Figure 7, Supplementary Annexure 02). We developed the assessment approach based on three queries upon each possible interaction between two benchmarks: (1) Is Asymmetric Task Interdependence (ATI) High? (2) Is there an Outcome Interdependence (OD)? (3) Is there a Positive Task Interdependence (TI)? We assessed high ATI by 80% or more similarity in forward and backward interdependence. For OD, we considered more than 50% of overall or 80% or more responses distinctly gathered from project managers to be positive. Finally, we considered 10% or more results gained from project manager responses or 50% or more than overall TI results as positive. Based on the positive and negative interventions that guided the outcomes, Supplementary Annexure 02-B outlines the potential interventions for each interaction we considered for the evaluation.
Following the findings through the illustrated approach shown in , we evaluated all possible interactions in both forward and backward passes between the benchmarks. In the analysis, we discovered that raising the TI and OD was required only for six interactions, proving the scope accuracy of the introduced benchmarks ().
Figure 7. The introduced interdependence assessment approach.
Table 9. Positive results of the interdependence assessment (P—positive, N—negative).
Findings and discussion
Global categorization of factors causing low productivity in the construction industry
By conducting a comprehensive analysis of the global construction industry (section Regional assessment of factors affecting construction productivity (primary analysis)), we have systematically classified the vast number recognized in the literature as contributors to the issue of low construction productivity. This classification encompasses two independent branches of geographical and productivity categorization, enabling a deeper examination of the operational attributes within the global construction industry (). Moreover, encompassing a time frame of 32 years in this assessment allowed us to enhance the comprehensiveness of the result interpretation. This facilitates a researcher’s or interested individual’s ability to focus on a specific location by first incorporating the predominant benchmarks for evaluating construction productivity. Moreover, this classification eliminates the need for redundant investigations to identify variables contributing to poor productivity. Instead, it allows for extracting a ranked collection of factors () based on their relevance and frequency within a specific context. Hence, this classification system is distinctive and meets a pressing necessity in evaluating construction productivity.
Ranked factors following their risk impact (using Fuzzy analysis)
Based on the ranking generated from the risk index described in section Fuzzy analysis for criticality and frequency assessment, the 58 most prevalent elements that emerged from the study are outlined in . We categorized these factors in two aspects: 1. overall and 2. within the relevant benchmark, providing a clear assessment of the most common causes of poor construction productivity in the context under consideration. We recognized that the most prevalent factor that led to a lack of construction productivity was the political condition in the assessed context of Sri Lanka. These results are unique, evidenced by cross-referencing with the causes that lead to low construction productivity in different contexts, as detailed in of this study.
Furthermore, the ranking allows for comparing the factors that have emerged in different contexts against the assessed context. Using the Australian region as an example, it is given that financial concerns, such as lack of financial management of projects, payment delays, and the financial status of the owner, have proven to be much more critical (Doloi Citation2008). Coming to the assessed Sri Lankan context, the said factors have emerged among the 20 most prevalent aspects ranked by Fuzzy analysis for Sri Lanka. Hence, a somewhat considerable similarity between the two regions could be observed, supporting the intended outcome of this study. Further, the particular ranking is the first comprehensive ranking conducted in the Sri Lankan context, incorporating global characteristics and through precise subjectivity evaluation.
Furthermore, the emergence of unique characteristics to the assessed setting, such as high inflation and interest rate changes, proves the subjective evaluation’s sensitivity and importance. The fact that Sri Lanka, the country under assessment, was experiencing financial difficulties at the time of evaluation (2022–2023) suggests that subjective assessment through Fuzzy analysis has the capacity to capture both current and overarching features of the context being examined.
In previous research by Karunarathna and Siriwardana (Citation2018), an extensive evaluation of the Sri Lankan construction sector was undertaken. However, the focus of this evaluation was limited to labor-related aspects when assessing construction productivity. Hence, a direct comparison between the two studies was not conceivable. However, the main subfactors that surfaced under the labor productivity benchmark in our study, namely (1) Lack of skills, (2) Lack of labor management, (3) Wages and incentives, (4) Labor morality, and (5) Labor experience, were found to be significant causes in the study conducted by Karunarathna and Siriwardana (Citation2018) as well. This commonality allows the solidification and validation of the assessment approach for accuracy and reliability in evaluating the construction industry.
Interdependence assessment and proposed interventions
The objective of the interdependence assessment was to discover any dependencies between the presented construction productivity benchmarks in the context under assessment. This concern was integrated into the research since benchmark development was also an outcome of global literature investigations, and the application of the results may not be optimal in the assessed setting. Accordingly, as described in section Interdependence assessment of the study, we evaluated interdependence based on a cross-sectional survey conducted with the industry’s senior management in the context under consideration (). Since the research included 14 independent benchmarks before narrowing them down to the most prevalent 10, we performed the interdependence analysis on 13 of them (excluding the “other” benchmark). Between the benchmarks, we assessed 156 interventions in detail for this analysis (Supplementary Annexure 02-A).
A unique aspect of these findings is that, despite the possible interconnectivity of 156 among the 13 benchmarks, results showed the need for only six interventions (). These results demonstrate that the introduced benchmarks include uniqueness over the scope they cover, and interconnectivity and the overlapping of scope are at a minimum. Moreover, the findings are further reinforced by the consistent pattern of participants’ responses. Out of the 51 responses targeted for the interdependence evaluation (), only 33% of the respondents identified interdependencies amongst benchmarks. These findings further suggest that a majority, 67% of the respondents, did not observe any interdependencies among the benchmarks. On the other hand, the level of interdependence perceived by the remaining respondents was minimal. Hence, these findings strengthen the scope classification employed in this study for classifying factors causing low construction productivity and support the precision and reliability of the assessment approach.
For future employment of this study, the scope of the coupled benchmarks with the specified intervention of “Raise TI” should be adjusted and strengthened to develop distinctive independence. Simultaneously, for the “Raise OD” intervention, the respective benchmarks should incorporate more unique scopes, strengthening their originalities.
Globally adaptative assessment approach for subjectivity evaluation in the construction sector
This research presents a comprehensive approach to evaluating and integrating the subjective nature of human responses into the decision-making and evaluation processes in the construction industry. In this study, we extensively assessed two key factors for causes of low construction productivity: criticality and frequency. To assess these factors, we developed unique membership functions tailored to our research’s scope. The paper proposes an inference engine (as shown in ) that enables mapping two aspects into a single set of membership functions of risk. By using defuzzification, the proposed method further allows for determining a particular index that considers both criticality and frequency crisp values, as discussed in detail in section Fuzzy analysis for criticality and frequency assessment.
The respective assessment approach employed in assessing the factors contributing to poor construction productivity () is pointed out as a globally applicable assessment approach to incorporate subjectivity in evaluations. To use this approach, a cross-sectional survey of industry stakeholders in the relevant context must be conducted. For the particular survey, the factors outlined in with benchmarks are endorsed since they have been derived from the global literature on construction productivity extending over 30 years. To be effective and adaptable, the survey should have at least 100 responses for the proposed Fuzzy membership functions. Furthermore, since Fuzzy analyses reduce the impact of subjectivity in assessments, the corresponding survey allows for the inclusion of stakeholders from various backgrounds and experiences rather than focusing on a single group.
The Fuzzy membership functions used in this work are developed to examine criticality, frequency, and risk in the context of construction productivity. As a result, it enables more precise, context-sensitive, and dependable outcomes, which are critical for improving construction performance. As a result, the very same Fuzzy functions are advised to be employed while adapting this assessment technique. However, conducting a specific linguistic survey within the targeted construction context, allowing for the development of new Fuzzy membership functions or adapting Fuzzy functions from a similar relevant study, is also encouraged, and the overall assessment approach offers the ability for convenient integration of such a set of functions.
The inference engine proposed in allows to incorporate more aspects apart from criticality and frequency and successful mapping into the risk or any other desired output functions. Thus, integrating the engine into any study that can be conducted using precise yet facile machine-based coding as a straightforward process. Further additional inferences could be readily incorporated or modified in accordance with the operational context of the study, thereby enabling the production of results that are more sensitive to context.
Further enhancement of the inference engine could adopt machine learning and develop the subjectivity analyses into advanced techniques of cognitive bias and data envelopment analyses, enabling deep learning in evaluations. This enhancement could feature the assessment of different combinations between several factors with an improved inference engine instead of the two factors used in this study: criticality and frequency. Henceforth, the discussed inference engine serves as an ideal initiation to incorporate subjective analyses in construction productivity evaluation and offers the opportunity to be adapted in different contexts along with the development of respective Fuzzy membership functions.
Furthermore, by incorporating Fuzzy logic, the proposed study efficiently tackles biases in replies based on age, experience, and hierarchical position in the sector. What distinguishes this approach is its versatility, which allows it to be used in construction contexts and to integrate both current and historical data for analysis. This allows for swift cross-comparisons across different operational settings (section Findings and discussion), offering light on respective situations and assisting in informed decision-making processes.
Considering the interdependence assessment approach, it is conceivable to adapt the corresponding approach to evaluate the distinctiveness of the factors contributing to low construction productivity and to determine whether one factor has an overarching effect on another. As described in the section Interdependence assessment section, the inferences governing the three interdependencies: Asymmetric task interdependence, Outcome interdependence, and Positive task interdependence should be established based on the operational context. Additionally, participants in the respective evaluation must possess a reasonable level of expertise, whereas, in this study, the respondents were restricted to those stakeholders who significantly influence project decision-making.
Conclusions
The construction industry continues to be one of the most sophisticated and prominent sectors globally, operating with a high number of stakeholders. Therefore, the factors causing poor construction productivity emerge in high numbers around the world, and they show significant variation over different regions. Many researchers have assessed and categorized factors contributing to low construction productivity in different regions and countries, yielding a large pool of factors in global literature, necessitating a thorough categorization for future practical usage. To generate these results, many have used input from diverse industry stakeholders more often. However, the majority of this research has not accounted for the inherent fuzziness and subjectivity of human responses. Therefore, they have not been able to fully interpret the survey responses in generating the results.
Therefore, we have classified 915 elements that emerged in 130 published works over 32 years, ending in December 2022. This classification includes two distinct aspects: geographical region and productivity benchmarks. We classified the regional variance based on the specific context under investigation by the published studies, identifying nine distinct regions worldwide. The benchmarks were then used to categorize the regions further, individually and globally, to provide an overall assessment. We performed this classification using a comprehensive keyword analysis to filter out published literature and a Pareto analysis to sort the elements into respective regions and related benchmarks.
Furthermore, we included a frequency analysis within each benchmark to determine the most prominent elements in the global context. In addition, we affirmed the respective benchmarks as unique and consummated within the provided scopes using a distinct interdependence evaluation. Therefore, we have effectively addressed a critical need in assessing construction productivity by implementing an extensive categorization and sorting system for root factors of low productivity in the global context.
Further, we developed and successfully implemented a unique assessment approach tailored to the construction sector. This approach enables the inclusion of the subjective nature of human responses in evaluating factors leading to low construction productivity. In this study, we generated unique Fuzzy membership functions for the criticality, frequency, and risk, which were mapped through a detailed inference engine again explicitly developed for the study. Further, the approach we employed in this study to evaluate the subjectivity of responses is indicated to be a globally adaptable assessment approach for construction productivity from stakeholder responses. This approach’s utilization allows for more reliable and precise outcomes in the construction field. Moreover, this approach paves the path to incorporate multiple factors, instead of two, into the assessment, leading to improved accuracy and reliability of outcomes through developing a more sophisticated inference engine.
We adapted the respective assessment approach to the Sri Lankan context and incorporated responses from a cross-sectional survey of 117 construction industry stakeholders. Respondents included a varied range of stakeholders, from laborers to project managers, resulting in more inclusive outcomes. By integrating the introduced approach, we further derived a distinct hierarchy among the factors within each of the benchmarks and the overall assessment. This investigation is a pioneering effort in evaluating the construction productivity context since it combines subjective assessment with extensive productivity classification to establish a hierarchical ranking system based on the significance attributed to the construction sector.
Policy and industry relevance
Our methodological approach in this study presents a critical link between research findings and policy implications. It allows authorities with a comprehensive dataset to tailor policies following specific regional productivity challenges. Further, the global categorization in this study extends beyond national boundaries, opening avenues for international collaboration and knowledge sharing among countries and global construction industries. This would further allow these parties to streamline best practices and strategies for enhanced outcomes. Moreover, by addressing interdependencies among benchmarks and variables, this approach enables optimized resource allocation and evidence-based decision-making; it serves as a blueprint for the industry. Incorporating the Fuzzy analysis technique and subjectivity evaluation approach not only resolved the ambiguity in productivity evaluation but also provided a standardized method for industry stakeholders to assess productivity in the construction sector. This structured approach further empowers industry stakeholders with insights crucial for informed decision-making. Furthermore, this approach ensures they resonate with the dynamic needs of the construction industry, ultimately driving comprehensive and sustainable productivity enhancements.
Limitations
Productivity variation across industry hierarchical levels and evaluation of productivity performance levels were deemed to be beyond the purview of this study. Consequently, our evaluations were restricted to classifying the factors that contribute to overall low construction productivity. Further global and country-specific construction productivity measurement standards were not considered as sources for the study, and we exclusively consulted published literature from journals identified by Scopus to determine the poor productivity causes. Furthermore, we considered only the detrimental influence of the factors introduced in this literature for the analysis.
Moreover, we have not comprehensively analyzed the temporal aspect of the factors contributing to low construction productivity. To conduct such an evaluation, it was necessary to accumulate a substantial amount of data for the selected literature spanning the 32 years under consideration, which fell beyond the scope of the study.
Due to the comprehensive nature of the cross-sectional survey (53 factors distributed across ten main benchmarks), remote data collection was not possible; instead, we interviewed each of the stakeholders listed in . This process consumed a significant amount of time; as a result, our attention was confined to stakeholders from the prominent building construction industry in Sri Lanka; we acknowledge this as a limitation of this study. Therefore, we recommend employing a relatively easy data acquisition survey when implementing the proposed assessment approach in any construction context.
One another limitation of this project is that the Fuzzy sets used in the study were not generated from a specific linguistically analyzed dataset for a particular assessment. This constraint occurred because developing and conducting a specific linguistically analyzed dataset necessitates a unique survey among a substantial sample of construction workers and professionals, which is outside the scope of the present study. Accordingly, we conducted the corresponding Fuzzy analyses by improving and modifying the membership functions suggested by Petrović et al. (Citation2014) to meet the study’s assessment approach, yielding trustworthy and effective findings described in the Findings and Discussion section.
Recommendations
From the perspective of remarks, this study recommends increasing the sample size of the cross-sectional survey and establishing geographically and context-diversified study regions to employ the utilized assessment approach. Such selection will enable the assessment to identify and rank the factors efficiently and precisely. In addition, the emerging factors in the global literature should be incorporated into the Pareto analysis as outlined in section Overview of Pareto and Frequency Analyses to maintain the basis of the approach reasonable and relevant. This capability of this overall assessment approach to integrate new findings and interpret results contemporarily distinguishes it from similar studies conducted in the construction sector.
In addition, as detailed in the limitations section, it is recommended that a separate study be conducted to develop Fuzzy sets through a linguistic analysis. Such intervention would render the results more applicable to the construction industry, as the criticality and frequency metrics used in the study could differ from those used in other contexts.
Developing and evaluating the interdependence assessment approach as a separate case is also encouraged. It would be highly beneficial for countries and sectors that have identified the predominant causes of low construction productivity, as it allows differentiation and identifying dependency between those factors, allowing for more efficient and on-target remedial measures.
Furthermore, since the global classification provided in this study extends beyond national boundaries, collaboration between different nations, regions, and industries with global operations is encouraged. This explicit coverage would enable those involved to evaluate and remedy the constraints impeding sector development on a more diverse scale more effectively.
Based on the case study’s findings in Sri Lanka, we have determined that political authority interventions and the country’s financial instability are the primary causes of low construction productivity. These findings necessitate a national strategy for the development and construction sector to counteract the potential adverse impacts of the factors discussed. In addition, (1) Implementation of a multiple-criteria evaluation strategy for the industry, (2) Implementation and improvement of labor and construction laws in the country, (3) Frequent monitoring of the sector’s operations, and (4) Responsible supply chain management would aid in reducing the industry’s adversity due to present and potential financial impacts.
Moreover, the high ranking of weather and external interference on the list of causes of low productivity illustrates the nations’ insufficient use of technology in the construction sector, notably in forecasting and planning. The issue must be addressed at the organizational level through reliable project management strategies. Further, since each of these ranked elements presents a distinct context, it is advised that each be examined individually before implementing the most effective remediation technique.
Supplemental Material
Download MS Word (52.2 KB)Supplemental Material
Download MS Word (160.9 KB)Acknowledgements
The authors gratefully acknowledge the participants of the cross-sectional survey conducted among the construction industry professionals in Sri Lanka and all the researchers who came before and continually contributed to the vast global knowledge of construction productivity, enabling our in-depth analysis and development of a globally adaptive assessment approach.
Disclosure statement
No potential conflict of interest was reported by the author(s).
Data availability statement
The data supporting this study’s findings are available on request from the corresponding author, [Amila Premakumara].
References
- Ab Talib, M.S., Abdul Hamid, A.B., and Thoo, A.C., 2015. Critical success factors of supply chain management: a literature survey and Pareto analysis. Euromed journal of business, 10 (2), 234–263.
- Abdel-Wahab, M. and Vogl, B., 2011. Trends of productivity growth in the construction industry across Europe, the US, and Japan. Construction management and economics, 29 (6), 635–644.
- Abdul Kadir, M.R., et al., 2005. Factors affecting construction labor productivity for Malaysian residential projects. Structural survey, 23 (1), 42–54.
- Abdullah, L. and Khadiah, S., 2011. Fuzzy linguistics for measuring customer satisfaction. International journal of computer trends and technology, 2 (2), 165–177.
- Bureau of Labor Statistics, 2015. US Bureau of Labor Statistics. www.bls.gov. Available from: https://www.bls.gov/opub/mlr/2019/home.html6+
- Carson, C. and Abbott, M., 2012. A review of productivity analysis of the New Zealand construction industry. Construction economics and building, 12 (3), 1–15.
- Charnes, A., Cooper, W.W., and Rhodes, E., 1978. Measuring the efficiency of DMUs. European journal of operational research, 2 (6), 429–444.
- Coelli, T.J., et al., 2005. An introduction to efficiency and productivity analysis. 2nd ed. New York, NY: Springer.
- Craft, R.C. and Leake, C., 2002. The Pareto principle in organizational decision-making. Management decision, 40 (8), 729–733.
- Crawford, P. and Vogl, B., 2006. Measuring productivity in the construction industry. Building research & information, 34, 208–219.
- de Jong, S.B. and Matthijs Bal, P., 2014. How asymmetrical task dependence and task interdependence interact. Journal of managerial psychology, 29 (8), 1115–1132.
- Dixit, S., et al., 2019. Study of significant factors affecting construction productivity using relative importance index in Indian construction industry. E3S web of conferences, 140, 09010.
- Doloi, H., 2008. Application of AHP in improving construction productivity from a management perspective. Construction management and economics, 26 (8), 841–854.
- Durdyev, S. and Mbachu, J., 2011. On-site labour productivity of New Zealand construction industry: key constraints and improvement measures. Construction economics and building, 11 (3), 18–33.
- Faridi, A.S. and El-Sayegh, S.M., 2006. Significant factors causing a delay in the UAE construction industry. Construction management and economics, 24 (11), 1167–1176.
- Gargama, H. and Chaturvedi, S.K., 2011. Criticality assessment models for failure mode effects and criticality analysis using fuzzy logic. IEEE transactions on reliability, 60 (1), 102–110.
- Hanna, A.S. and Heale, D.G., 1994. Factors affecting construction productivity: Newfoundland versus rest of Canada. Canadian journal of civil engineering, 21 (4), 663–673.
- Hasan, A., et al., 2018. Factors affecting construction productivity: a 30-year systematic review. Engineering, construction, and architectural management, 25 (7), 916–937.
- Hashiguchi, N., et al., 2020. The effects of psychological factors on perceptions of productivity in construction sites in Japan by worker age. International journal of environmental research and public health, 17 (10), 3517.
- Horner, M. and Duff, R., 2001. A contractor’s guide to improving productivity in construction. London: CIRIA.
- Jarkas, A.M. and Bitar, C.G., 2012. Factors affecting construction labor productivity in Kuwait. Journal of construction engineering and management, 138, 811–820.
- Jarkas, A.M. and Radosavljevic, M., 2013. Motivational factors impacting the productivity of construction master craftsmen in Kuwait. Journal of management in engineering, 29 (4), 446–454.
- Kane, M.T., et al., 1989. Combining data on criticality and frequency in developing test plans for licensure and certification examinations. Journal of educational measurement, 26 (1), 17–27.
- Karunarathna, D.M.T.G.N.M. and Siriwardana, C.S.A., 2018. A tool to assess construction worker productivity. In: 2018 Moratuwa Engineering Research Conference (MERCON).
- Kumar, M., Misra, L., and Shekhar, G., 2015. A survey in fuzzy logic: an introduction. International journal for scientific research & development, 3 (6), 822–824.
- Loosemore, M., 2014. Improving construction productivity: a subcontractor’s perspective. Engineering, construction, and architectural management, 21 (3), 245–260.
- Mojahed, S. and Aghazadeh, F., 2008. Major factors influencing water and wastewater treatment plant construction productivity: evidence from the deep south USA. International journal of project management, 26 (2), 195–202.
- Naoum, S.G., 2016. Factors influencing labor productivity on construction sites. International journal of productivity and performance management, 65 (3), 401–421.
- Ofori, G., Zhang, Z., and Ling, F.Y.Y., 2020. Key barriers to increase construction productivity: the Singapore case. International journal of construction management, 22 (14), 2635–2646. https://doi.org/10.1080/15623599.2020.1819521
- Owens, B. and Coppola, E.A., 2012. Fuzzy set theory (or fuzzy logic) to represent the messy data of complex human (and other) systems. White Paper.
- Park, H.-S., Thomas, S.R., and Tucker, R.L., 2005. Benchmarking of construction productivity. Journal of construction engineering and management, 131 (7), 772–778.
- Pekuri, A., et al., 2014. Managing value creation: the business model approach in construction. International journal of business innovation and research, 8 (1), 36.
- Petrović, D.V., et al., 2014. Risk assessment model of mining equipment failure based on fuzzy logic. Expert systems with applications, 41 (18), 8157–8164.
- Ranasinghe, U., Ruwanpura, J., and Liu, X., 2012. Streamlining the construction productivity improvement process with the proposed role of a construction productivity improvement officer. Journal of construction engineering and management, 138 (6), 697–706.
- Soham, M. and Rajiv, B., 2013. Critical factors affecting labor productivity in construction projects: a case study of south Gujarat region of India. International journal of engineering and advanced technology, 2 (4), 583–591.
- Tan, W., 2000. Total factor productivity in Singapore construction. Engineering, construction and architectural management, 7 (2), 154–158.
- Thomas, A.V. and Sudhakumar, J., 2013. Critical analysis of the key factors affecting construction labour productivity –an Indian perspective. International journal of construction management, 13 (4), 103–125.
- US Department of Commerce, 2019. FY 2021 Annual Performance Plan and FY 2019 Annual Performance Report [online]. Available from: https://www.commerce.gov/files/fy-2021-annual-performance-plan-and-fy-2019-annual-performance-report [Accessed 22 Nov 2023].
- Wong, Y.Y.B., Joyce, S.C., and Blessing, L., 2021. A review of design research in engineering productivity in the architecture, engineering, and construction (AEC) industry. Proceedings of the design society, 1, 201–210.
- Xue, X., et al., 2008. Measuring the productivity of the construction industry in China by using DEA-based Malmquist productivity indices. Journal of construction engineering and management, 134 (1), 64–71.
- Zadeh, L.A., 1965. Fuzzy sets. Information and control, 8 (3), 338–353.
- Zhang, Z. and Chu, X., 2011. Risk prioritization in failure mode and effects analysis under uncertainty. Expert systems with applications, 38 (1), 206–214.