
ABSTRACT
For reasons of aspired naturalness and cost reduction, vitamin additions should be kept low in organic livestock systems. To define safe lower threshold levels of riboflavin supplementation in organic poultry feeding, 135 hybrid layers were allocated to three dietary treatments supplemented with either 4.5 (R4.5), 3.0 (R3.0) or 1.5 mg (R1.5) GMO-free riboflavin added per kg feed. This resulted in total measured concentration averages of 5.0, 4.5, and 3.1 mg kg−1 feed for R4.5, R3.0 and R1.5, respectively. For 18 weeks, each treatment was replicated in three groups of 15 hens. Feed consumption, laying performance, egg quality, riboflavin concentration in the yolk, and clinical health scores were assessed. Two hens per group (six per treatment) were slaughtered in weeks 11 and 18, respectively, for measurement of pancreas, spleen, liver and heart weights, and determination of liver riboflavin. No treatment effects on feed consumption, body weight, laying performance, egg weights, eggshell strength and yolk colour or plumage and keel bone integrity were observed. No symptoms of lameness or footpad damage were found. The riboflavin concentration in egg yolks in R1.5 was lower than in other treatments. Liver riboflavin concentration increased between week 11 and 18 in all treatments, but it was also lower in R1.5. Based on these results, the addition of 3 mg riboflavin kg−1 feed appeared to be sufficient with respect to the health and performance of laying hens. Supplementation with only 1.5 mg kg−1 resulted in some metabolic signs of deficiency. These results apply only to organic winter diets.
Introduction
Riboflavin (Vitamin B2) is a water-soluble vitamin, essential for monogastric animals, and plays an important role as a cofactor in flavin enzymes in energy and lipid metabolism (Cogburn et al. Citation2018), particularly due to its involvement in oxidation reactions in aerobic cells (White Citation1996). Furthermore, riboflavin has significant functions in the nervous system, skin and mucosa and dietary deficiency can therefore lead to growth retardation, dysfunction of the nervous system and skin lesions in mammals (Powers Citation2003). Similarly, riboflavin deficiency in birds can cause damage in neuronal tissues (Cai et al. Citation2006), leading to paralysis and paroxysm of legs and feet, described as ‘curled-toe paralysis’ (Wyatt et al. Citation1973; Chung and Baker Citation1990). Skin lesions, in particular of feet, are further symptoms of riboflavin deficiency in poultry (Shepherd and Fairchild Citation2010). Impaired hatchability (Arijeniwa et al. Citation1996; White Citation1996) and retarded growth of chicks (Chung and Baker Citation1990) can be the result of insufficient riboflavin supply via parent animals and rearing diets. Also, feather keratin expression can be negatively impacted by riboflavin deficiency (Cogburn et al. Citation2018).
For poultry production, besides animal health, product quality is also important. The transfer rate of riboflavin from feed to egg is high (25–50%; Naber and Squires Citation1993a), and a dietary deficiency has been shown to be reflected in the egg within 1 week (Naber and Squires Citation1993b). Given the importance of vitamin B2 in human nutrition (Powers Citation2003), this is a further reason for the need for adequate supplementation with riboflavin for poultry.
On the other hand, experimental data on riboflavin requirements of poultry are scarce and current recommendations (e.g. NRC Citation1994) are based on scientific data from before 1950. Updates of the recommendations are therefore urgently required (Leeson Citation2007), as hybrids, diets and productivity levels have developed significantly during the previous decades and thus metabolic requirements have changed. Feed industries recommend and use large safety margins that are related to the official recommendation values (Leeson Citation2007; Weber Citation2009; Fefana Citation2014), partly because of the lack of updated scientific data. Specific requirements for organic poultry production have never been defined, and conventional recommendation values are usually used for the formulations. However, depending on specific feeding approaches and diet components, like silages and access to fresh grass, the intrinsic concentrations may be higher in organic than in conventional diets, leading to lower requirements for vitamin B2 supplementation (Witten and Aulrich Citation2018, Citation2019).
Riboflavin is generally not synthetically produced, but is derived from microorganisms like bacteria or yeasts, and in the current industrial processes, these microorganisms are usually genetically modified. However, organic production relies on inputs from non-GMO sources (Council of the European Union Citation2018; Lambertz et al. Citation2020, Citation2021). This is relevant as riboflavin is almost exclusively produced on the basis of genetically modified microorganisms, which implies safety issues, as occurred recently with respect to the spread of antibiotic resistant bacteria in riboflavin supplemented feed (Rychen et al. Citation2018). However, GMO-free riboflavin production is likely to be more expensive, which explains why the size of safety margins for supplementation levels is of high economic relevance for organic poultry feed formulation.
The present experiment was therefore targeted at finding a safe lower threshold level of riboflavin supplementation for laying hens fed on organic formula. Performance, egg quality, as well as health traits were observed in hens being supplemented with graded riboflavin levels, in order to define a threshold at which occurrence of deficiency would be unlikely.
Materials and methods
A feeding experiment with 135 laying hens receiving graded levels of riboflavin supplementation was carried out over a period 18 weeks. The trial was approved by the cantonal veterinary office Aargau (Aarau, Switzerland; animal experiment permission number: 75,720) and was conducted according to the Swiss law on animal welfare and the EU directive 2010/63/EU (European Union Citation2010) for animal experiments.
Housing, management and feeding of animals
One hundred and thirty-five Lohmann Brown-Classic laying hens (Gallus gallus domesticus) of an age of 18 weeks were purchased from a commercial organic rearing farm, individually marked with leg rings and randomly allocated to one of the three dietary treatments (45 animals per treatment). Animals for each feeding treatment were further allocated to three experimental groups (n = 15) and pens (3 × 2.5 m) equipped with perches, litter, nests, feeders and drinkers as compliant with the national animal husbandry regulations (BLV Citation2020). As it was impossible to realise nine outdoor areas of similar and reasonable shape, outdoor access for the hens had to be omitted in order to keep equal and controlled conditions for all pens. In this respect, the conditions for the hens differed from organic standards. The lighting programme started at 5.30 a.m. and lasted for 16 h until 9.30 p.m., every day. The barn was not heated; temperatures ranged from minimum 6°C to maximum 15°C during the experimental period. All animals had ad libitum access to water, compound feed (as defined below) and straw. Whole cereal grains (a mixture of wheat and maize) were additionally administered into the bedding material at 100 g pen−1 day−1. During an adaptation period of 7 weeks, all hens received the same commercial organic diet for laying hens. The experiment started when the hens were 25 weeks of age. At this moment, each pen received the assigned experimental diet. In experimental weeks 11 and 18, two hens with an average body weight were slaughtered per pen. The experiment was terminated when the hens were 43 weeks of age.
Experimental diets
The three treatments differed only in riboflavin supplementation levels. The control treatment (R4.5) consisted of a commercial organic feed for laying hens (7578 C, Mühle Rytz AG, Biberen, Switzerland), composed of soybean cake, maize, wheat, sunflower cake, grass meal, sorghum, oats, and a common mineral-vitamin premix with the commonly used addition level of 4.50 mg riboflavin kg−1 total feed. A second treatment (R3.0) was based on the same feed (same batch, same production date) as R4.5 but with the addition of 3.00 mg riboflavin kg−1 feed, and the third treatment (R1.5) contained an addition of only 1.50 mg riboflavin kg−1 feed. The riboflavin was the certified GMO-free product ‘Vitamin B2 98%’ (Miavit, Essen, Germany), dosed via the vitamin-mineral premixes at Granovit AG, Kaiseraugst, Switzerland. It is noteworthy that due to the intrinsic riboflavin in the diet components, the total riboflavin concentrations in the treatments were higher than the supplemented levels. Feed proximate components were analysed in triplicate according to VDLUFA (Citation2004). Feed nutrient composition and effective riboflavin concentrations are described in . According to organic standards, 100 g of a wheat/maize (1/1) mixture of entire grains was provided daily into the bedding material in each pen, in order to stimulate the scrabbling behaviour of the hens. This mixture of cereals contained per kg dry matter, 100 g crude protein and 12.8 MJ metabolisable energy. The exact consumption of these grains could not be determined, but from visual observation it was estimated to be 90%, equal to 6 g hen−1 day−1.
Table 1. Components, nutrient and riboflavin concentrations in the feeds (at 90% dry matter)
Feed consumption, body weight and laying performance
Feed remnants were weighed daily on a scale ranging from 0 to 15 kg ± 0.01 (Kern GmbH, Balingen Germany) to calculate daily feed intake at pen level. Eggs were collected daily and laying performance was calculated weekly at pen level. Alterations in sampling time resulted in different egg counts per week (sometimes laying performance above 100%), which, however, was averaged across the total experiment. Individual body weight was measured in experimental weeks 1, 3, 5, 8, 12, 16 and at the end of the trial (week 18, at 43 weeks of age). Mortality was recorded daily.
Clinical health parameters and organ weights
Clinical health traits, including plumage, integument lesions, footpad and keel bone integrity, as well as motion behaviour, were scored by individual visual examinations in trial weeks 1, 3, 5, 8, 12, 16 and 18. Plumage, head, integument, footpad and keel bone integrity were scored according to Tauson et al. (Citation2005) and locomotion behaviour according to Kestin et al. (Citation1992). In details, plumage, integument, footpads and keel bone were scored using a 4-point scale, where a score of four was defined as no alterations and a score of one was defined as severe alterations. Plumage was scored at six different body regions (neck, back, abdomen, legs, wings, tail) for damaged quills and featherless patches. Plumage scores were summed up, resulting in a score from 0 to 24, where 24 meant a completely integer plumage. Lesions of the integument were scored at two body regions (head/comb and back) for scratches, wounds, ulcerations and other anomalies. Lesion scores were summed up resulting in a score from 0 to 8, where eight meant a total absence of any lesions. Footpads were assessed for wounds, hyperkeratosis and ulcerations. The keel bone (sternum) was assessed for signs of structural irregularities, exostoses and fractures. The locomotion behaviour was assessed using a lameness score according to Kestin et al. (Citation1992) from 0 to 5; 0 referred to a gait pattern that was normal and balanced and the foot clawed when lifted, and a maximum of 5 points were given in cases of severe lameness, weakness or paresis. The two hens per pen that were slaughtered in trial week 11 (at 36 weeks of age) and in week 18 at the end of the trial (at 43 weeks of age) were immediately dissected, and liver, heart, pancreas and spleen were eviscerated, weighed and visually examined.
Physical parameters of egg quality
Twenty eggs per pen collected within 2 consecutive days, were analysed in week 1, 2, 4, 8, 11, 15 and 18. A hardness tester (Type PTB 301 Pharma Test, Hainburg, Germany) was used to determine the breaking strength of the shell. The weights of the whole egg, wet eggshell and egg yolk were measured on a laboratory scale (PM 3000, Mettler, Columbus, Ohio). To measure the colour of the egg yolk by L*, α*, b* colour space, a chromameter type CR400 (Konica Minolta Inc., Tokyo, Japan) was used. Further, obvious abnormalities such as blood spots were recorded.
Riboflavin concentration of egg yolk, liver and experimental diets
In experimental weeks 1, 7 and 18, composite samples of egg yolks (20 yolks composed per pen, resulting in three composite samples per experimental diet) were analysed for their riboflavin concentration with HPLC. Composite samples of livers from the animals slaughtered in trial weeks 11 and 18 (two hens per pen and week) were also analysed for riboflavin concentration with HPLC. Concentrations of riboflavin in the total feed samples (containing intrinsic and added riboflavin) were measured by HPLC in weeks 1, 8 and 18. Analyses were performed by LUFA-ITL GmbH, AGROLAB Group, Kiel, Germany, according to DIN EN 14,152:2014–08 (CEN Citation2014).
Statistical analysis
All statistical analyses were performed with the software R (version 3.5.3; R Core Team Citation2019). Linear and generalised linear mixed effect models were applied using the functions lmer and glmer from the package lme4 (Bates et al. Citation2015). Fixed effects were ‘date’ or ‘week’, and ‘treatment’, including their interaction. The first measurement of each variable was included as a covariate to correct for variation in starting conditions. For the variables feed consumption, laying performance, riboflavin in egg yolk and liver, and for organ weights ‘pen’ was the random effect. For all other variables, nested random effects were ‘animal’ within ‘pen’. Marginal and conditional R2 (Nakagawa and Schielzeth Citation2013) for all outcome variables (data not shown) were also calculated. The marginal R2 described the proportion of variance explained by the fixed factors alone. The conditional R2 described the proportion of variance explained by fixed and random effects. For all outcome variables, except plumage score, the marginal and conditional R2 were nearly identical. Moreover, variance of the random effect ‘pen’ was much smaller than the residual variance, and smaller than the variance of ‘animal’. This was also the case also plumage score. It was concluded that pen had a negligible effect on the variables of interest. However, ‘pen’ was kept as random effect in the model to correctly represent the experimental design. Model assumptions were assessed by visual inspection of model residuals for deviances from normality or homogeneity of variance. For the outcome variables, ‘lesions’ and ‘keel bone damage’ results were analysed as binary variables due to their strong skewness. To obtain p-values and model estimates, dummy variables with sum contrasts for the fixed effect ‘treatment’ were used. Values for p were obtained by comparing the full model to a model reduced by one main effect or interaction. A parametric bootstrap approach with 1000 simulations with the function PBmodcomp from the package pbkrtest (Halekoh et al. Citation2014) was used. Model estimates and confidence intervals were similarly calculated with parametric bootstrap. They were calculated for the full model, i.e. considering all predictor variables. Additionally, Tukey post hoc tests were performed at the endpoint of the experiment (week 18) for all variables with either a significant effect of treatment or interaction in order to provide a comparison between treatments at the point of the longest application of the feeds.
Results
Feed riboflavin concentration
The concentrations of riboflavin in the feed as determined in the study (containing intrinsic riboflavin of the feed components as well as added riboflavin) did not accurately reflect the supplementation levels. Initially, R4.5, R3.0 and R1.5 contained 6.07, 5.33, and 3.34 mg riboflavin kg−1 feed, respectively (). The initial intrinsic riboflavin concentration in the feed was therefore estimated by subtraction of the supplementation to be, on average, 1.9 mg kg−1. Over time, the riboflavin concentrations decreased in all three dietary treatments from week 1 to week 8 by about 15–19%, but subsequently remained stable until week 18 of the experiment.
Performance parameters (body weight, feed consumption, laying performance)
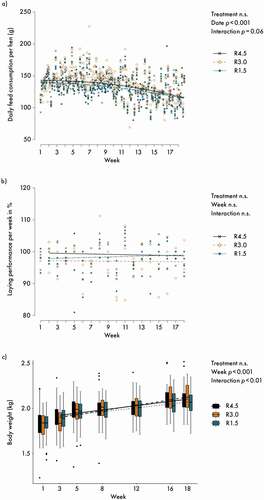
There was a tendency indicating that feed consumption, as determined at pen level, developed differently in R3.0 compared with the other two treatments (interaction treatment x week p = 0.06; )). However, as the feed consumption levels at the beginning and at the end of the experiment were similar in all groups, there was no overall treatment effect over the entire experimental period. Laying performance remained above 95% (0.95 eggs hen−1 day−1) throughout the whole experiment and did not differ between treatments ()). Body weight of the hens increased during the experimental period, with a somewhat steeper curve for R3.0 ()), indicated by the significant treatment x week interaction. Post-hoc multiple comparisons between treatments for week 18 did not reveal differences in feed consumption or body weight.
Figure 1. (a) Daily feed consumption per hen in g (dots are mean values per pen); (b) laying performance per week in % (dots are mean values per pen); (c) individual body weight in kg. Lines represent model estimates for the three supplementation treatments R4.5 (4.5 mg riboflavin kg−1 feed), R3.0 (3.0 mg riboflavin kg−1 feed) and R1.5 (1.5 mg riboflavin kg−1 feed). In b) weekly values above 100 % are explained by variation in time of sampling of eggs between days. n.s.: not significant. The experiment lasted from age weeks 25 to 43 of the hens. Week 1 data were used as correction covariable for the analyses.
Clinical parameters (mortality, health scores, organ weights)
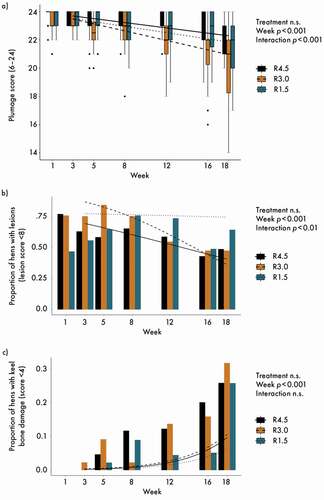
Three hens died during the experiment: two from the R4.5 pens and one from a R3.0 pen; pathological section did not reveal nutritional aetiology. Overall, mortality was 0.45% per 4 weeks, which was well below the threshold of 1.0%, defined as critical in Swiss veterinary regulations (BLV (Bundesamt für Lebensmittelsicherheit und Veterinärwesen) Citation2020). Plumage score was very good at the beginning of the experimental period, and decreased slightly over time, with a significant treatment x week interaction ()) and an apparent, though not significant, disadvantage of treatment R3.0, but still at a high level. While lesion scores remained stable at a high level for R1.5, for R3.0 and R4.5 the scores decreased, indicating less lesions towards the end of the trial (significant effects of week and interaction), though without a significant effect of the treatment ()). Keel bone score deteriorated with time, but did not differ between treatments ()). During the whole experimental period, no hen was assessed as being lame and no footpad lesions were observed. Post-hoc multiple comparisons between treatments for week 18 did not reveal differences for any of the clinical parameters. No treatment effects were found for the organ weights, except for a tendency for the liver weights, for which the p-value of the overall treatment effect was 0.05, but the post hoc test did not reveal differences between the individual treatments. However, numerically, the livers of the R1.5 treatment were approximately 8% lighter compared with that of the other treatments (). There were no visual indications of any disturbance to the heart, liver, spleen or pancreas of the slaughtered hens.
Table 2. Organ weights (model estimates and 95% confidence intervals) with different rates of riboflavin supplementation
Figure 2. (a) Total plumage score; (b) proportion of hens with lesions (lesion score < 8) and (c) proportion of hens with keel bone damage. Lines represent model estimates for the three supplementation treatments R4.5 (4.5 mg riboflavin kg−1 feed), R3.0 (3.0 mg riboflavin kg−1 feed) and R1.5 (1.5 mg riboflavin kg−1 feed). n.s.: not significant. Post-hoc multiple comparisons among treatments for week 18 were never significant. The experiment lasted from age week 25 to 43 of the hens. Week 1 data were used as correction covariable for the analyses.
Physical parameters of egg quality
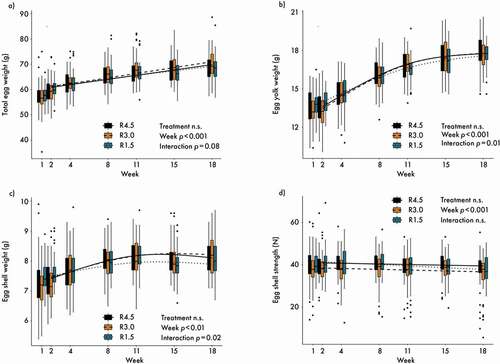
The average total egg weight, assessed at pen level, increased during the course of the trial, though treatment as main effect and the interaction between treatment and week were not significant ()). The interaction between treatment and week was significant for egg yolk weight ()), indicating a flatter increase for R1.5, but the overall treatment effect was not significant. Egg shell weight started at a similar level for all treatments, but then diverged for R1.5, though there was no significant overall treatment effect ()). Egg shell strength decreased slightly over time, but no significant treatment effect was observed ()). Post-hoc multiple comparisons between the treatments at week 18 did not reveal any differences for the weights of the eggs or egg fractions.
Figure 3. (a) Total egg weight; (b) egg yolk weight; (c) egg shell weight; (d) egg shell strength. n = 60 per treatment and day. Lines represent model estimates for the three supplementation treatments R4.5 (4.5 mg riboflavin kg−1 feed) R3.0 (3.0 mg riboflavin kg−1 feed) and R1.5 (1.5 mg riboflavin kg−1 feed). n.s.: not significant. Post-hoc multiple comparisons among treatments for week 18 were never significant. The experiment lasted from age week 25 to 43 of the hens. Week 1 data were used as correction covariable for the analyses.
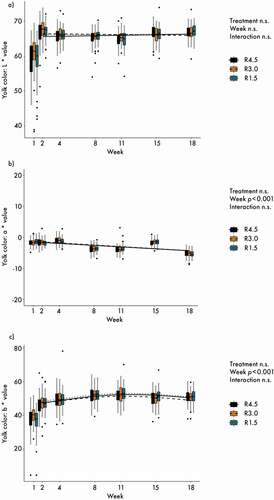
Colour measurements of the egg yolk did not differ between treatments, and interactions between treatment and week were also not significant, as presented in . The a*-values developed with time towards a slightly greener tone ()). The b*-values showed a non-linear course across the weeks ()).
Figure 4. Yolk colour: (a) L* values (brightness); (b) a* values (red-green axis) (c) b* values (yellow-blue axis). n = 60 per treatment and day. Lines represent model estimates for the three supplementation treatments R4.5 (4.5 mg riboflavin kg−1 feed) R3.0 (3.0 mg riboflavin kg−1 feed) and R1.5 (1.5 mg riboflavin kg−1 feed). n.s.: not significant. The experiment lasted from age week 25 to 43 of the hens. Week 1 data were used as covariable for the analyses.
Riboflavin concentration of egg yolk and liver
Initially, the riboflavin concentrations of the egg yolks were similar for the different treatments (mean (mg 100 g−1) ± standard deviation: 0.61 ± 0.02 for R4.5, 0.64 ± 0.05 for R3.0 and 0.64 ± 0.05 for R1.5), but subsequently in weeks 7 and 18, R1.5 showed lower concentrations compared with that in the other treatments (). In the livers of the slaughtered hens, the riboflavin concentration for R1.5 was lower compared to R3.0 in week 11, and in week 18 it was lower compared to that in both of the other treatments. At the same time, liver riboflavin concentrations increased in all treatments between week 11 and 18.
Table 3. Riboflavin concentration (model estimates and 95% confidence intervals) in mg 100 g−1 egg yolk (week 7 and 18, n = 3) and liver (week 11 and 18, n = 3) with different rates of riboflavin supplementation
Discussion
The differences in effective riboflavin levels between R3.0 and R4.5 were consistently smaller than 1 mg kg−1, although on the basis of the supplementation rates a difference of 1.5 mg kg−1 was expected. This showed the general difficulty with accurately matching targeted concentrations in industrial feed compositions, if the proportions are in mg kg−1, which justifies the use of safety margins.
Assuming an even distribution of the supplemented premixes, on average for all of the dietary treatments, the intrinsic riboflavin concentration was 1.9 mg kg−1 in the initial week. This was in accordance with the range of intrinsic riboflavin concentrations in organic poultry diets as recently published by Witten and Aulrich (Citation2019). Since intrinsic riboflavin concentrations may vary, and are difficult to control, the inclusion of a zero-supplementation control was not considered in this study.
The decrease of the riboflavin content by 15–19% during the first 7 weeks was unexpected. According to the literature, it appears more likely that the vitamin B2 from the premixes was degraded (Zhuge and Klopfenstein Citation1986) rather than the intrinsic riboflavin in the cereals (Keskin and Oskaya Citation2013). Therefore, it was assumed that the intrinsic concentration remained stable during the trial, while the loss was from the added (premix) riboflavin. If related only to the added riboflavin, this resulted in 24–30% losses from that fraction. Probably, the riboflavin partly degraded when it came into contact with the other dietary components, while the heat treatment during pelleting could be excluded as a potential risk factor for the degradation given that this vitamin is heat stable. Degradation by light exposure during storage has to be considered as much more important and warrants to some extent the large safety margins used in practice (Weber Citation2009). However, the true reason for the decrease in the present study remained unclear. In other experiments with similar diet formulations, conducted by some of the authors of this article, the riboflavin content of the feed was not found to decrease during a 10-months storage period (Lambertz et al. Citation2020). It is important to note that, in the present study, from week 8 onwards, the difference in the riboflavin concentrations between R3.0 and R4.5 became rather small. Nonetheless, the recommendations of NRC (Citation1994) were matched for all the treatments, even though the riboflavin concentration in R1.5 was lower than what is used commercially (Leeson Citation2007; Weber Citation2009).
The lower riboflavin concentrations in the egg yolks and livers in the R1.5 reflected the lower supply of riboflavin in this treatment, in comparison to the other treatments. The egg yolk riboflavin concentrations as well as the corresponding treatment differences fit well with results of Squires and Naber (Citation1993). This accordance confirmed a critical threshold between 3 and 4 mg total riboflavin per kg feed (on the basis of the effective total riboflavin concentrations in the treatments of the present study shown in ). Below this dietary threshold, the concentration of riboflavin in the egg will likely drop.
Interestingly, the same threshold held true regarding the resulting concentrations in the liver. Above this threshold, no effect of a higher riboflavin supply (R4.5) on the concentrations in the liver or egg was evident in this study. This estimated threshold between 3 and 4 mg kg−1 feed (effective total riboflavin concentrations) corresponded well with the NRC-recommendations for growing chickens and leghorn-type layers (NRC Citation1994), which are based on the literature from the first half of the 20th century (Heuser et al. Citation1938; Petersen et al. Citation1947). For broiler chickens, a similar threshold was reported by Olkowski and Classen (Citation1998). The riboflavin concentrations of the egg yolks did not change over the time period in R4.5 and R3.0, whilst in the livers, it increased for both treatments between week 11 and 18 of the experiment. Therefore, it was assumed that the metabolic riboflavin levels reflected the supply. Consequently, neither accumulation nor depletion would likely happen if the supply, according to R4.5 and R3.0, would have been continued over a period of a few months. This assumption was further based on riboflavin being a water-soluble vitamin, which cannot be stored in lipid tissues, and also hardly, or not at all, accumulates in the liver of mammals (Kirchgessner et al. Citation1997) and in plasma, brain, heart and liver of chickens (Olkowski and Classen Citation1998) when fed with an oversupply. However, the consistently lower riboflavin concentration in the egg yolk in the R1.5 treatment gave reason to expect a developing metabolic riboflavin deficiency at this level of supplementation.
It is important to determine whether, or not, the hens with reduced riboflavin levels in the liver and eggs (R1.5) showed any signs of impaired health or wellbeing. According to the literature, the most probable impact would have resulted in nervous disorders combined with paralysis and paroxysm of legs and feet (Wyatt et al. Citation1973; Chung and Baker Citation1990). However, during the experiment, no motion disorders (assessed as lameness score) were found in any of the treatments. Also, body lesions as well as footpad lesions were nearly absent and did not differ among treatments; thus, footpad dermatitis could be excluded as a possible result of riboflavin undersupply (Shepherd and Fairchild Citation2010).
Based on the results reported from studies by Squires and Naber (Citation1993) and Arijeniwa et al. (Citation1996), a treatment impact on the laying performance of the hens was expected in this experiment, particularly in case of R1.5, but this was not found. Although in R1.5 riboflavin provision with feed was lower than the critical threshold found by Squires and Naber (Citation1993), laying performance, as well as body weight, in all treatments in the present study reflected the upper rather than the lower range compared to the standard provided by the breeder (Tierzucht Citation2017) and in the literature (Bonekamp et al. Citation2010). Also, egg weight could have been negatively affected in R1.5 (Squires and Naber Citation1993), but in agreement with Arijeniwa et al. (Citation1996) no such effect was found. However, some deviations in egg yolk and shell weights and composition for R1.5 may be considered as a sign of riboflavin deficiency. These deviations were visible in significant interactions between treatment and time, though they were not strong enough to be significant as overall treatment effects. In general, it was concluded that the comparably high (Bonekamp et al. Citation2010; Tierzucht Citation2017) productivity of the hens was not impaired in any of the treatments, although in R1.5 first signs of impact were observed.
Naber and Squires (Citation1993b) found that albumen colour responded sensitively to dietary riboflavin supply. A similar effect for yolk colour was not established in this trial, which showed very small treatment differences that disappeared during the second half of the trial. It was concluded that yolk colour was not indicative of the changes in the riboflavin concentrations.
Furthermore, calcium metabolism and bone strength depend on riboflavin supply, as has also been indicated for humans (Macdonald et al. Citation2004). In growing turkey poults, riboflavin deficiency was associated with thinner and less dense bones (Hocking et al. Citation2013). Egg shell mass and strength can also be indicative of calcium metabolism. However, Squires and Naber (Citation1993) found even increasing shell weights with decreasing riboflavin supply, while Arijeniwa et al. (Citation1996) reported no effect. Neither eggshell strength nor keel bone integrity was affected by the treatments in the present study. After initial differences, the eggshell mass also developed in a similar way in the treatments of this experiment. Thus, with the riboflavin levels presented here, no signs of irritations of the calcium metabolism by treatment were found.
Due to the metabolic role of riboflavin in fatty acid oxidation, deficiency may lead to lipid accumulation in the liver of birds (Cogburn et al. Citation2018), which was not found in this study. In contrast, rather than enlarged livers (Tang et al. Citation2017), slightly lighter livers were found in the hens of R1.5. However, this result was not statistically significant and has to be considered with care due to low sample numbers.
In organic poultry diets, other intrinsic riboflavin sources like ensiled forage or fresh grass from the outdoor range have to be considered (Witten and Aulrich Citation2018). Especially the latter as this is an obligatory constituent of poultry diets during the summer period, according to the standards. This source could not be accounted for in this study, which may mean that intrinsic riboflavin supply during vegetative periods was underestimated. However, for the winter season, the current study most likely matched the intrinsic riboflavin supply in organic poultry diets. Further, there might be effects of movement on the riboflavin status, as reported for mammals (Winters et al. Citation1992; Soares et al. Citation1993). No such evidence for birds was found in the literature, but effects of outdoor range allowance, which were not included in the current study, cannot be fully ruled out. However, the negative effects of movement, if existing, may be counterbalanced by access to fresh fodder.
Conclusions
In a feeding experiment with laying hens, the supplementation with either 4.5 or 3.0 mg riboflavin kg−1 feed was, after storage, found to result in total effective concentrations (including intrinsic contents of the feed components) of 5.0 and 4.5 mg kg−1, respectively, and did not cause any relevant differences regarding animal health, performance or egg quality parameters. Supplementation with only 1.5 mg kg−1 resulted in a total effective concentration of 3.1 mg kg−1 and led to reduced riboflavin levels in the egg yolk and liver, and a small negative effect on egg yolk weight. Based on the intrinsic riboflavin content of approximately 2 mg kg−1 in layer feeds and respecting the approximate 30% loss from premix riboflavin during storage, it was deduced that a premix supplementation level of 3.0 mg riboflavin kg−1 total feed was safe in terms of health and performance, while 4.5 mg kg−1 provided no extra benefit and 1.5 mg kg−1 indicated a risk of deficiency.
Acknowledgments
The authors thank the participating feed mill and premix supplier for their kind technical support.
Disclosure statement
No potential conflict of interest was reported by the author(s).
Additional information
Funding
References
- Arijeniwa A, Ikhimioya I, Bamidele OK, Ogunmodede BK. 1996. Riboflavin requirement of breeding hens in a humid tropical environment. J Appl Anim Res. 10:163–166. doi:https://doi.org/10.1080/09712119.1996.9706144.
- Bates D, Machler M, Bolker BM, Walker SC. 2015. Fitting linear mixed-effects models using lme4. J Stat Softw. 67(1):1–48. doi:https://doi.org/10.18637/jss.v067.i01.
- BLV (Bundesamt für Lebensmittelsicherheit und Veterinärwesen). 2020. Technische Weisung über den Tierschutz bei Legehennen, Junghennen und Elterntieren. [accessed 2021 Mar 24] https://www.blv.admin.ch/blv/de/home/tiere/tierschutz/nutztierhaltung/huehner.html
- Bonekamp RPRT, Lemme A, Wijtten PJA, Sparla JKWM. 2010. Effects of amino acids on egg number and egg mass of brown (heavy breed) and white (light breed) laying hens. Poultry Sci. 89(3):522–529. doi:https://doi.org/10.3382/ps.2009-00342.
- Cai Z, Finnie JW, Blumbergs PC, Manavis J, Ghabriel MN, Thompson PD. 2006. Early paranodal myelin swellings (tomacula) in an avian riboflavin deficiency model of demyelinating neuropathy. Exp Neurol. 198:65–71. doi:https://doi.org/10.1016/j.expneurol.2005.10.028.
- CEN. 2014. Foodstuffs. Determination of vitamin B2 by high performance liquid chromatography. EN 14152:2014. Brussels:European Committee for Standardization.
- Chung TK, Baker DH. 1990. Riboflavin requirement of chicks fed purified amino acid and conventional corn-soybean meal diets. Poultry Sci. 69:1357–1363. doi:https://doi.org/10.3382/ps.0691357.
- Cogburn LA, Smarsh DN, Wang X, Trakooljul N, Carre W, White HB. 2018. Transcriptional profiling of liver in riboflavin-deficient chicken embryos explains impaired lipid utilization, energy depletion, massive hemorrhaging, and delayed feathering. BMC Genomics. 19:177. doi:https://doi.org/10.1186/s12864-018-4568-2.
- Council of the European Union. 2018. Council regulation (EC) No 2018/848 of June 2018 on organic production and labelling of organic products and repealing Council Regulation (EC) No 834/2007. Off J Eur Union. 150:1–92.
- European Union. 2010. Directive 2010/63/EU of the European Parliament and of the Council on the protection of animals used for scientific purposes. Off J Eur Union. 276:33–79. [Accessed 13 july 2021]. http://data.europa.eu/eli/dir/2010/63/oj.
- Fefana. 2014. Vitamins in animal nutrition. EU Association of Specialty Feed Ingredients and their Mixtures. Brussels (Belgium). ISBN 978-2-9601289-2-5.
- Halekoh U, Hojsgaard S. 2014. Kenward-roger approximation and parametric bootstrap methods for tests in linear mixed models - The R Package pbkrtest. J Stat Softw. 59:1–32. doi:https://doi.org/10.18637/jss.v059.i09.
- Heuser GF, Wilgus HS, Norris LC. 1938. The quantitative vitamin G requirement of chicks. Poult Sci. 17:105. doi:https://doi.org/10.3382/ps.0170105.
- Hocking PM, Stevenson E, Beard PM. 2013. Supplementary biotin decreases tibial bone weight, density and strength in riboflavin-deficient starter diets for turkey poults. Br Poultry Sci. 54:801–809. doi:https://doi.org/10.1080/00071668.2013.860213.
- Keskin S, Ozkaya H. 2013. Effect of storage and insect infestation on the mineral and vitamin contents of wheat grain and flour. J Econ Entomol. 106:1058–1063. doi:https://doi.org/10.1603/EC12391.
- Kestin SC, Knowles TG, Tinch AE, Gregory NG. 1992. Prevalence of leg weakness in broiler chickens and its relationship with genotype. Vet Rec. 131:190–194. doi:https://doi.org/10.1136/vr.131.9.190.
- Kirchgessner M, Hirschvogl G, Eder K, Roth-Maier DA. 1997. The effect of dietary riboflavin supplementation during pregnancy and lactation on riboflavin concentrations of milk, liver and carcass of lactating rats. J Anim Physiol Anim Nutr. 77:44–52. doi:https://doi.org/10.1111/j.1439-0396.1997.tb00736.x.
- Lambertz C, Leopold J, Ammer S, Leiber F, Thesing B, Wild C, Damme K. 2021. Demand-oriented riboflavin supply of organic broiler using a feed material from fermentation of Ashbya gossypii. Animal. 15:100003. doi:https://doi.org/10.1016/j.animal.2020.100003.
- Lambertz C, Leopold J, Damme K, Vogt-Kaute W, Ammer S, Leiber F. 2020. Effects of a riboflavin source suitable for use in organic broiler diets on performance traits and health indicators. Animal. 14:716–724. doi:https://doi.org/10.1017/S175173111900243X.
- Leeson S. 2007. Vitamin requirements: is there basis for re-evaluating dietary specifications? World Poultry Sci J. 63:255–266. doi:https://doi.org/10.1017/S0043933907001444.
- Macdonald HM, McGuigan FE, Fraser WD, New SA, Ralston SH, Reid DM. 2004. Methylenetetrahydrofolate reductase polymorphism interacts with riboflavin intake to influence bone mineral density. Bone. 35:957–964. doi:https://doi.org/10.1016/j.bone.2004.05.018.
- Naber EC, Squires MW. 1993a. Vitamin profiles of eggs as indicators of nutritional status in the laying hen: diet to egg transfer and commercial flock survey. Poultry Sci. 72:1046–1053. doi:https://doi.org/10.3382/ps.0721046.
- Naber EC, Squires MW. 1993b. Research note: early detection of the absence of a vitamin premix in layer diets by egg albumen riboflavin analysis. Poultry Sci. 72(10):1989–1993. doi:https://doi.org/10.3382/ps.0721989.
- Nakagawa S, Schielzeth H. 2013. A general and simple method for obtaining R2 from generalized linear mixed-effects models. Meth Ecol Evol. 4:133–142. doi:https://doi.org/10.1111/j.2041-210x.2012.00261.x.
- NRC. 1994. Nutrient requirements of poultry. 9th ed. Washington (DC): National Academy Press.
- Olkowski AA, Classen HL. 1998. The study of riboflavin requirement in broiler chickens. Int J Vit Nutr Res. 68:316–327.
- Petersen CF, Lampman CE, Stamberg OE. 1947. Effect of riboflavin intake on hatchability of eggs from battery confined hens. Poultry Sci. 26:187. doi:https://doi.org/10.3382/ps.0260187.
- Powers HJ. 2003. Riboflavin (vitamin B-2) and health. Am J Clin Nutr. 77:1352–1360. doi:https://doi.org/10.1093/ajcn/77.6.1352.
- R Core Team. 2019. R: a language and environment for statistical computing. Vienna (Austria): R Foundation for Statistical Computing. [Accessed 13 july 2021]. https://www.R-project.org/.
- Rychen G, Aquilina G, Azimonti G, Bampidis V, Bastos MDL, Bories G, Chesson A, Flachowsky G, Gropp J, Kolar B, et al. 2018. Safety of vitamin B2 (80%) as riboflavin produced by bacillus subtilis KCCM-10445 for all animal species. EFSA J. 16. [accessed 2021 Jan 23]. doi:https://doi.org/10.2903/j.efsa.2018.5223.
- Shepherd EM, Fairchild BD. 2010. Footpad dermatitis in poultry. Poultry Sci. 89:2043–2051. doi:https://doi.org/10.3382/ps.2010-00770.
- Soares MJ, Satyanarayana K, Bamji MS, Jacob CM, Ramana YV, Rao SS. 1993. The effect of exercise on the riboflavin status of adult men. Br J Nutr. 69:541–551. doi:https://doi.org/10.1079/BJN19930054.
- Squires MW, Naber EC. 1993. Vitamin profiles of eggs as indicators of nutritional status in the laying hen: riboflavin study. Poultry Sci. 72:483–494. doi:https://doi.org/10.3382/ps.0720483.
- Tang J, Hegemann MA, Hu J, Xie M, Shi WBA, Jiang Y, De Boer V, Guo YM, Hou SS, Keijer J. 2017. Severe riboflavin deficiency induces alterations in the hepatic proteome of starter Pekin ducks. Br J Nutr. 118:641–650. doi:https://doi.org/10.1017/S0007114517002641.
- Tauson R, Kjaer J, Maria L, Cepero R. 2005. Applied scoring of integument and health in laying hens. Proceedings of the 7: thEuropean symposium on poultry welfare, Lublin, Poland, June 2005. Anim Sci P. 23:153–159.
- Tierzucht L. 2017. Management guide alternative haltung. [accessed 2021 Jan 23]. https://www.ltz.de/de/downloads/management-guides.php#anchor_fbf86a84_Accordion-1-Legehennen;
- VDLUFA. 2004. MB III 4.1.1 VDLUFA. Methodenbuch der VDLUFA, band III. [accessed 2021 Jan 23]. https://www.vdlufa.de/Methodenbuch/index.php?lang=de
- Weber GM. 2009. Improvement of flock productivity through supply of vitamins for higher laying performance and better egg quality. World Poultry Sci J. 65:443–458. doi:https://doi.org/10.1017/S0043933909000312.
- White HB. 1996. Sudden death of chicken embryos with hereditary riboflavin deficiency. J Nutr. 126:S1303–S1307. doi:https://doi.org/10.1093/jn/126.suppl_4.1303S.
- Winters LRT, Yoon JS, Kalkwarf HJ, Davies JC, Berkowitz MG, Haas J, Roe DA. 1992. Riboflavin requirements and exercise in older women. Amer J Clin Nutr. 56:526–532. doi:https://doi.org/10.1093/ajcn/56.3.526.
- Witten S, Aulrich K. 2018. Effect of variety and environment on the amount of thiamine and riboflavin in cereals and grain legumes. Anim Feed Sci Technol. 238:39–46. doi:https://doi.org/10.1016/j.anifeedsci.2018.01.022.
- Witten S, Aulrich K. 2019. Exemplary calculations of native thiamine (vitamin B1) and riboflavin (vitamin B2) contents in common cereal-based diets for monogastric animals. Org Agr. 9:155–164. doi:https://doi.org/10.1007/s13165-018-0219-9.
- Wyatt RD, Tung HT, Donaldson WE, Hamilton PB. 1973. A new description of riboflavin deficiency syndrome in chickens. Poultry Sci. 52:237–244. doi:https://doi.org/10.3382/ps.0520237.
- Zhuge Q, Klopfenstein CF. 1986. Factors affecting storage stability of vitamin A, riboflavin, and niacin in a broiler diet premix. Poultry Sci. 65:987–994. doi:https://doi.org/10.3382/ps.0650987.