
 ?Mathematical formulae have been encoded as MathML and are displayed in this HTML version using MathJax in order to improve their display. Uncheck the box to turn MathJax off. This feature requires Javascript. Click on a formula to zoom.
Abstract
A new variant of the fluid dynamic gauging technique for determining the thickness of soft fouling layers in situ and in real time is reported. The sideways fluid dynamic gauging (SiDG) device allows measurements to be made shortly after a deposit layer contacts a solution, allowing processes such as swelling to be characterized accurately. Two applications of the device are reported: (i) in cleaning, monitoring the change of thickness of a complex food soil when it is contacted with aqueous solutions at different temperatures, pH and surfactant content, and (ii) in fouling, in determining the thickness, thermal conductivity and strength of deposits generated from whey protein solutions on heated stainless steel substrates. The evolution of fouling resistance for the whey protein deposits indicates that significant aging takes place during the fouling test, which is confirmed by changes in the thermal properties and strength of the deposit layer as measured by the SiDG device.
Introduction
Understanding fouling and cleaning requires knowledge of how the properties of the fouling layers change over time. Aging of a deposit, for example, is driven by prolonged exposure of a fouling deposit to surface conditions (particularly elevated temperature) and can change its thermal conductivity, affecting fouling dynamics (see [Citation1]). Aging frequently hardens the deposit so that it is more difficult to remove (clean), leading to optimal operating times for processes that operate with regular cleaning [Citation2, Citation3]. Methods for measuring the properties of fouling layers are required and in many cases these need to be measured in situ. The techniques available for in situ measurement can be classified as local or overall methods: Schlüter et al. [Citation4] presented a combination of these to study crystallization fouling.
Thermal conductivities are often inferred from changes in overall heat transfer performance and estimates of deposit thickness, and are thus subject to considerable uncertainty. The deposit is usually thin so can be treated as a slab of thickness δf, viz.(1)
(1)
where Rf is the fouling (thermal) resistance and λf the thermal conductivity. Determining δf is challenging when the layer is soft (readily deformed) or collapses when removed from its formation environment. The technique of fluid dynamic gauging (FDG) was developed to measure the local thickness of soft solid fouling layers immersed in liquid in situ [Citation5]. FDG has been combined with heat flux sensors to give dynamic measurements of deposit thermal conductivity [Citation6]: both measurements can be made at the same location so that uncertainties associated with non-uniformity of deposition are avoided.
Whereas fouling timescales are often long, shorter time scales are involved in cleaning: exposure to cleaning solutions can promote changes in seconds or minutes. Techniques that can quantify such changes from first contact with cleaning agents are needed. This paper reports a development of the FDG technique to allow this. In FDG measurement, liquid is withdrawn or ejected from a convergent nozzle located close to the surface of the layer. The pressure drop across the nozzle is measured for a given flow rate and this information gives the distance from the nozzle to the surface. Further details are given in [Citation5].
The actual measurements take less than 5 s. For this, the layer needs to be located underneath the nozzle, which requires the nozzle to be built into the fouling or cleaning system (as in [Citation7] and [Citation8]). When this is not feasible, previous FDG devices required an initial set-up time of 1-2 minutes, which meant that early phenomena could not be studied. This paper reports a new configuration, named sideways FDG (or SiDG), wherein the sample is mounted so that measurements can be made, reliably, within 10 s of the sample first contacting the solution.
FDG can also be used to determine the strength of a fouling layer ([Citation8]) via computational fluid dynamics simulations that generate estimates of the shear stress imposed on the layer being studied. The values reported here were calculated using the open source software OpenFOAM.
The SiDG device is described in detail in [Citation9]. Its usefulness is demonstrated here at two time-scales. In the first, the initial swelling behavior of a complex food soil, representative of difficult to remove soils encountered in the food industry, is quantified. In the second, the effect of aging of denatured whey protein deposits generated on heat transfer surfaces is investigated.
Experimental
SiDG apparatus
is a photograph of the SiDG device. Its design builds on the concept reported in [Citation10], where the nozzle is mounted horizontal and moved sideways by a linear drive. The sample is mounted on a vertical holder which can be raised or lowered into the test liquid as desired. The time since the sample being gauged first contacts the liquid is therefore known and in practice can be shorter than 10 s. The nozzle is located a short distance below the liquid level and its position is adjusted by a computer controlled linear slide.
Figure 1. Photograph of SiDG apparatus. Salient points: H – liquid reservoir with heat transfer coil; M - sample mount; N – nozzle; P – pressure transducer; S – syringe pump; X – nozzle positioner; Z – sample positioner.
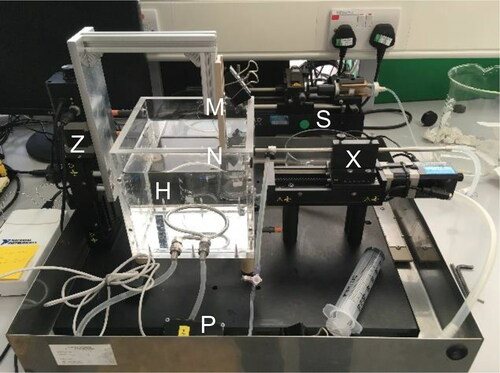
Samples are typically rectangular plates. The portion of the sample above the waterline remains unwetted until it is immersed so several tests can be achieved on the sample plate. This facilitates repeated testing and also allows the effect of different agents on the same sample to be investigated, free from intra-sample variation. The location of the deposit-substrate surface is determined by performing calibration tests on clean substrates at the start and end of an experimental session: the difference between this value and the clearance between the nozzle and the deposit-solution interface yields δf. The technique is suitable for studying deposits formed on concave, flat or weakly convex surfaces, such as annular fouling probes (e.g. [Citation11]: it is not amenable for studying deposition inside tubes, unless these are cut open or an access way is provided).
The reservoir contains approximately 3 L of liquid. A heat transfer coil allows the temperature to be controlled, while inlet and outlet ports allow its composition to be adjusted. Gauging liquid is ejected or withdrawn by a computer controlled syringe pump: by alternating between these modes the system operates with zero net discharge of liquid. The pressure drop across the nozzle is measured by a pressure transducer connected to a port upstream of the nozzle and adjusted for hydraulic head.
The SiDG operation and data collection are controlled by a Python algorithm on a standard PC. Full details of device construction and operating algorithms are provided in [Citation9].
Complex food soil
The soil investigated is the complex model food soil reported in [Citation12]. It is prepared by baking a film of slurry containing starch, dairy proteins, emulsified fat and water which has been spread over a 316 L stainless steel plate. Preparation details are given in [Citation12]. The slurry is spread evenly over a 8 × 1.5 cm region of a 10 × 2.5 cm plate at a coverage of 580 g m−2, dried in air and then baked in air in an oven for 7 min. The mass coverage after baking is 250 g m−2. The thickness of the baked layer is about 0.4 mm but baking causes the layer to crack, with intervals of 2-3 mm between cracks. When the deposit is contacted with an agent that causes it to swell, swelling closes the cracks.
Fouling deposits
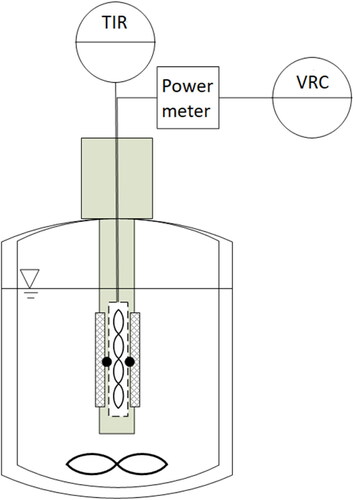
A batch fouling apparatus consisting of a 5 L jacketed glass flask with a centrally located heating rod was used to generate the protein deposits (see ). A detailed description of the heating rod system has been reported in [Citation13]. A solution of 8.4 g L−1 whey protein (WPC 80, Volac International Ltd.) in tap water was used for the fouling tests. Whey protein deposits have been used widely in the study of dairy fouling behavior (e.g. [Citation14–16]). The pH of the solution was 6.6. The test solution was held at 50 °C or 60 °C by circulation of thermostatted water through the jacket of the vessel and stirring was supplied by a magnetic stirrer operating at 100 rpm.
Figure 2. Schematic of the batch fouling apparatus. Not to scale. The wall temperatures beneath the sample plate are displayed and recorded on the temperature indicator controller (TIR). A power meter, labeled VRC, is used to record and control the voltage for heating.
The test substrates were 304 stainless steel coupons (dimensions 20 × 80 × 2 mm3). The substrates were pretreated by soaking in 1 wt% NaOH solution at room temperature for at least 5 hours to remove any residual grease or protein, then rinsed and dried. The coupons were fixed in place, on opposite sides of the rod (which had square cross-section).
Heating was supplied via an electrical heating element located on the rod axis. This was regulated to supply a constant heating power, ranging from 103 W to 225 W, giving an initial surface temperature between 75 and 90 °C. The clean overall heat transfer coefficient, Uclean, was about 2600 W/m2 K. Thermocouples, labeled T107 and T108, measured the temperature behind the midpoint of each coupon, labeled Tw. The change in temperature was used to calculate the local fouling resistance from (2)
(2)
where U is the overall heat transfer coefficient and q is the heat flux.
Results and discussion
Swelling of complex food soil
Swelling is an essential step in the cleaning of complex food soils as it allows access of cleaning agents into the soil matrix to promote reactions and dissolution of soil components. The ingress of significant volume fractions of water also weakens the deposit so it can be removed by hydraulic action. shows that the soil swells rapidly on hydration, and the SiDG unit is able to capture the initial swelling behavior successfully. The error bars on the plot show the variation between up to 15 tests conducted on each sample, achieved by moving a plate down after each test to contact dry deposit with the solution, giving five data sets per plate, and repeating the procedure on three plates. Some soil patches sloughed off: the average number of viable data sets per sample was 11.
Figure 3. Effect of (a) temperature (at pH 7), (b) pH (at 20 °C) and (c) pH (at 50 °C) on swelling of complex food soil. Initial soil layer thickness, δ0 ∼ 0.4 mm.
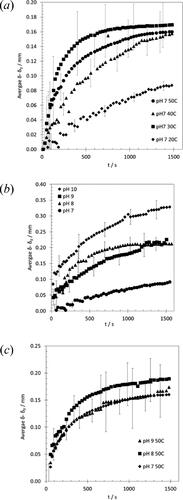
The effect of temperature on swelling in is complex. There is a noticeable difference in the final extent of swelling between 20 °C and higher temperatures. The latter exhibit similar values, about twice that at 20 °C. One of the reasons for this difference is that the fat present in the soil is not mobile at 20 °C (demonstrated by rheological testing, see [Citation12]) and this prevents the water contacting all the soil. The release of fat from the soil layer was visible at the higher temperatures.
The initial rate of swelling does not follow the expected trend, with the order appearing to be 30 °C > 50 °C > 40 °C. The variation between tests indicated by the error bars, however, is large. Further testing would be required to confirm whether the temperature effect is systematic.
shows that pH has a significant effect of swelling with this soil at 20 °C, interacting with the proteins present to cause repulsion between these species (as reported in [Citation6]). The plots show rapid changes in thickness on contact with alkali at pH 8 and above, of order 50 to 150 µm in the first 10 s. Following the initial jump the swelling behavior at pH 8 and pH 9 is similar, reaching a similar final value, whereas the rate and final extent at pH 10 are greater: the final extent at pH 10 at 20 °C is twice that observed at 50 °C and pH 7.
The above results would suggest that higher temperature and higher pH would enhance swelling and therefore promote cleaning but shows that the two factors are not synergistic, with all pHs tested giving similar behavior at 50 °C.
The addition of surfactants can promote cleaning by solubilizing fat and changing adhesion of mobile species to the substrate. shows the effect of three commonly used surfactants on swelling at 20 °C and 50 °C. The surfactants considered were t-octylphenoxypolyethoxyethanol (TX-100, non-ionic), hexadecyltrimethyl-ammonium bromide (CTAB, cationic) and sodium dodecyl benzene sulfonate (SDBS, anionic), at 0.1 wt%, which is above the critical micelle concentration for all three species.
Figure 4. Effect of 0.1 wt% surfactant on swelling behavior at (a) 20 °C and (b) 50 °C.
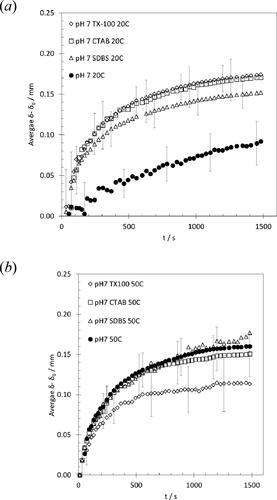
At the lower temperature, all three surfactants promote swelling, which is attributed to their ability to solubilize the fat present. At the higher temperature, when the fat is mobile, there is no apparent advantage in adding surfactant on swelling behavior. TX-100 appears to inhibit swelling to some extent.
Promoting swelling does not equate directly with cleaning behavior. Other mechanisms are involved in breaking the swollen soil down and detaching it from the substrate. These results are part of a systematic study into cleaning of these complex food soils which will be reported in due course. The results demonstrate the ability of the SiDG device to capture initial transients.
Whey protein deposits
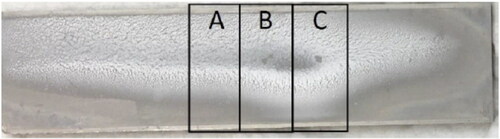
The photograph of a fouled coupon in shows that deposition was not uniform across the surface and did not cover the surface completely, so any estimates of properties assuming even coverage are subject to some uncertainty. The deposit did cover the position where the thermocouple used to measure the surface temperature was located. The marked regions on the image show where gauging was performed. These tests provided an estimate of the deposit thickness and also its strength: the crater generated by gauging is evident at C. The shear stress at which deformation was judged to have started, denoted τd, is reported as the measure of deposit strength. The value reported is the shear stress divided by the deposit thickness, to allow comparison between layers of different thickness.
Figure 5. Example of test coupon fouled by whey protein solution (q = 11 kW/m2, T(bulk) = 60 °C, Tw,clean = 90 °C, Tw = 96 °C). Dimensions 20 × 80 mm2. Regions A, B and C indicate where gauging has been performed. The thermocouple measuring wall temperature is located behind region B.
presents sets of local fouling resistance data collected from four pairs of coupons and one batch of whey protein solution. The heated probe was removed from the solution when the wall temperature had reached the desired value, fresh coupons attached, and the fouling test restarted. There was a small change in bulk temperature during changeover. The data sets labeled 107 and 108 are for the two coupons in each test and there is good agreement between these.
Figure 6. Example of fouling dynamics for a probe operating with bulk temperature 60 °C and initial wall temperature 85 °C. dT indicates the rise in wall temperature at the end of the test. The value of Rf used in the analyses is the average over the last 3 minutes.
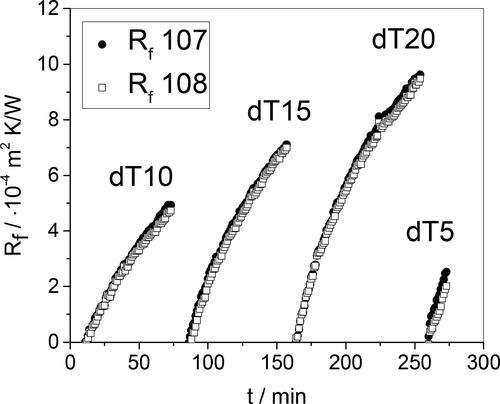
The apparatus operates at constant heat flux so linear fouling profiles, i.e. constant fouling rate, are expected. Inspection of shows that this is the case initially but the rate decreases over time. This is attributed to aging increasing the thermal conductivity of the deposit, as described in [Citation1]. The initial fouling rates are similar, indicating that the concentration of fouling precursors is not changing substantially over time. This is consistent with the mass of fouling deposit being small compared to the initial mass of whey protein in solution.
shows that the local fouling resistance increased with the deposit coverage, mf, as expected. The non-zero intercept in this plot – where a finite fouling resistance is associated with zero deposit coverage – is the result of two effects: the first is the non-uniformity of coverage (see ), which means that mf is an underestimate of the amount of deposit at the location of the heat flux sensor. The second is the difficulty in measuring the wet mass of the deposit. Drying was particularly rapid with the thinnest deposit layers, and drying kinetics were subsequently investigated to provide estimates of the initial wet mass coverage. Assuming that the deposit covers the plate uniformly, the above caveats notwithstanding, Rf can be related to mf by(3)
(3)
Figure 7. Deposit coverage and fouling resistance. (a) Plot of Rf against mf, following EquationEquation (3)(3)
(3) : the locus shows the fit to a parabolic trend. Region D indicates points subject to significant drying, so the coverage measured is likely underestimated. (b) Effect of final wall temperature on product ρfλf. Horizontal dashed loci indicate salient values, discussed in the text.
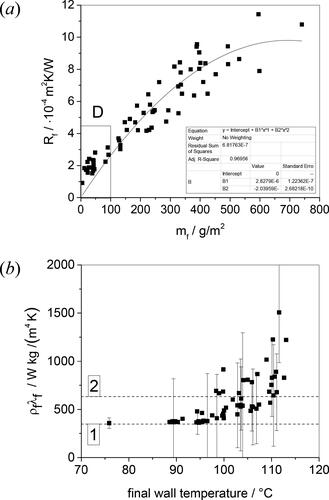
Here ρf is the density of the deposit, which is expected to lie between that of water and that of protein. It is evident from that the product ρfλf is not constant. The larger mf values are associated with higher final wall temperatures and are therefore expected to be subject to larger extents of aging.
The values of ρfλf in are calculated using EquationEq. (3)(3)
(3) for each test, using the fitted trend line to calculate ρfλf. The plot shows a steady increase in ρfλf with final wall temperature, particularly when the wall temperature exceeds 100 °C. This is not attributed to boiling as (i) the presence of vapor in the deposit would reduce ρfλf, and (ii) the heat transfer profiles do not feature a discontinuity associated with a change in heat transfer mode. Deposits recovered at the higher wall temperatures featured noticeably different color at the wall, consistent with Maillard and other reactions associated with aging.
shows two salient values of ρfλf alongside the values extracted from the data. Dashed line 2 is the value expected for a deposit with a water volume fraction of 0.9 and average temperature of 100 °C, of 633 W kg/m4 K. Dashed line 1 shows a minimum value, for pure protein at 100 °C. These values are based on the work of Fricke and Becker [Citation17]. Davies et al. [Citation18] reported ρfλf values around 470 W kg/m4 K for fouling deposits generated from 3.5 wt% whey protein concentrate solutions at temperatures below 85 °C, which is in good agreement with the results reported here. They also reported Rf-mf data for tests with wall temperatures ranging from 85-95 °C which gave ρfλf ≈ 925 W kg/m4 K, again in good agreement with the trend in .
shows the thickness of the fouling layer measured by SiDG. The measurements were made in the region where the deposit layer was thick (see ) and are of order 0.5 mm. There is an increase in δf with final wall temperature which mirrored the trend in mass coverage. Shrinkage due to drying when the coupon was removed from the fouling apparatus affected the reliability of the measurement, particularly for samples prepared with lower final wall temperature.
Figure 8. Estimates of (a) deposit thickness and (b) deposit thermal conductivity from SiDG measurements. Open symbols denote cases where the (thin deposit) dried out before testing.
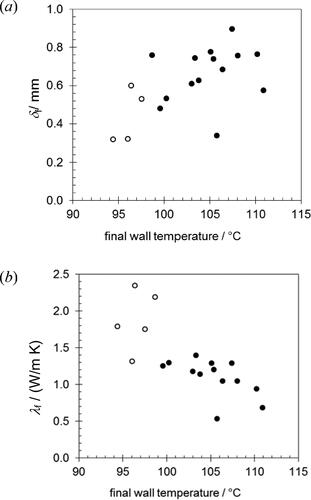
SiDG measurements at position B (see ) give δf at the point where the wall thermocouple is located, so λf can be estimated directly from EquationEq. (1)(1)
(1) . The data in lie around 1 W m−1K−1, which is larger than expected (and larger than the values reported by Tuladhar et al. [Citation6]). The deposits obtained at lower final wall temperature were thin and dried out rapidly and irreversibly: rehydrating these did not return the sample to the original mass of deposit. The values of λf for thicker deposits are larger than expected and suggest that some shrinkage also occurred for these layers between testing and loading on the SiDG. Making these measurements in situ, without having to move the sample, would be preferable.
The effect of final wall temperature on the deposit strength measure, τd, is presented in . There is a noticeable step in τd for final wall temperatures above 100 °C, mirroring the result seen for ρfλf. The plot also indicates data subject to drying before testing – all at lower final wall temperature, and thus lower mf – which gave high τd values. Drying was found to induce irreversible changes in the deposits: once dry, contact with water did not promote swelling to the original thickness. This highlights the need to be able to study the deposits in situ where possible.
Figure 9. Effect of final wall temperature on shear stress at which deposit starts to deform. Open symbols denote cases where the (thin deposit) dried out before testing.
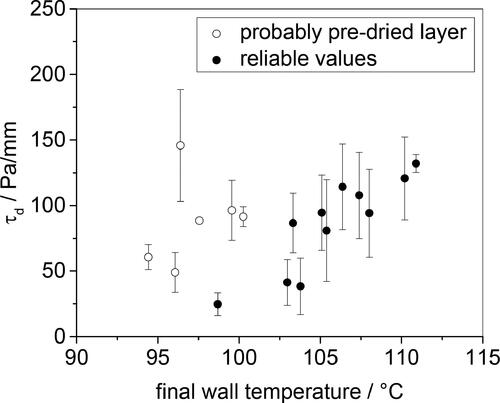
The increase in τd values with extended operation is expected to result in the deposit to be more difficult to remove, as discussed in [Citation2]. If plant data mimicked the trends observed here, it would not be advisable to operate for longer time periods.
A key factor in studying aging is the mode of heat transfer used: these tests operated at constant heat flux, which results in an increase in local wall temperature (and rates of aging reactions) as the deposit grows. It is not possible to control the wall temperature as an independent variable in this mode of testing in order to probe the aging kinetics. Decoupling the effects of wall temperature requires the use of models such as those reported in [Citation1]. Aging would be slower (or negligible) if the system operated at constant wall temperature. This would allow aging kinetics to be probed at particular temperatures. In this mode of operation, however, overall heat transfer coefficients and fouling resistances are normally based on the total rate of heat transfer so non-uniformity of deposition and local film heat transfer coefficients need to be considered.
Conclusions
The sideways fluid dynamic gauging (SiDG) concept has been developed in order to allow changes in the thickness of soft solid deposits as a result of contact with liquid to be measured in situ and almost from the point of immersion.
Its utility is demonstrated here in the study of swelling of complex food soils contacted with aqueous solution. At 20 °C, where the fat phase is not mobile, there are noticeable differences in swelling behavior with increasing pH and in the presence of surfactants. At 50 °C the differences are small and changing both pH and surfactant concentration brings little benefit.
The SiDG device was also used to determine the changes in deposit properties as a result of aging. The whey protein deposits studied exhibited aging over a relatively short timescale, with ρfλf and τd both increasing as the wall temperature increased. There are relatively few studies demonstrating aging in fouling tests and this investigation confirms that this can be a significant factor in dairy applications.
Drying of the foulant layers, between generations in the batch cell and testing in the SiDG, affected the whey protein deposits. Such fouling layers would be better gauged in situ in the fouling cell.
| Nomenclature | ||
| CTAB | = | Hexadecyltrimethyl-ammonium bromide |
| dT | = | Rise in wall temperature, °C |
| FDG | = | Fluid dynamic gauging |
| mf | = | Deposit coverage, kg/m2 |
| q | = | Heat flux, W/m2 |
| Rf | = | Fouling resistance, m2 K/W |
| SDBS | = | Sodium dodecyl benzene sulfonate |
| SiDG | = | Sideways fluid dynamic gauging |
| t | = | time, s |
| T | = | Temperature, °C |
| TIR | = | Temperature indicator recorder |
| TX-100 | = | T-octylphenoxypolyethoxyethanol |
| U | = | Overall heat transfer coefficient, W/m2 K |
| VRC | = | Voltage recorder controller |
| Greek Symbols | ||
| δ | = | Deposit thickness, m |
| λf | = | Deposit thermal conductivity, W/m K |
| ρf | = | Deposit density, kg/m3 |
| τd | = | Shear stress for deposit deformation, Pa/mm |
| Subscripts | ||
| 0 | = | Initial |
| clean | = | Cleaned surface |
| d | = | Deposit deformation |
| f | = | Deposit |
| w | = | Wall |
Acknowledgements
A Cambridge Taiwan Trust PhD scholarship for J-HT and an EPSRC iCASE studentship for GLC supported by Procter & Gamble are gratefully acknowledged, as is the Deutsche Forschungsgemeinschaft (DFG) for support for LS. The SiDG device was constructed by Andrew Hubbard. WPC80 powder was provided by Volac International Ltd.
Additional information
Notes on contributors

Jheng-Han Tsai
Jheng-Han Tsai is currently a PhD candidate in chemical engineering and biotechnology at the University of Cambridge, UK. His research focuses on modeling and measurement of soft solid layers for reducing water and energy consumption in cleaning processes. He has developed several new fluid dynamic gauging configurations. He received his BS and MS in Chemical Engineering from National Taiwan University in 2009 and 2013, respectively.
Georgina Cuckston
Georgina (George) Cuckston is currently the Science Communications Manager for the Mars Global Food Safety Center. Her contribution to this work stems from when she was a PhD student in the Department of Chemical Engineering and Biotechnology at the University of Cambridge, from which she graduated in early 2020. In her work she investigated the cleaning of complex food soils in an EPSRC iCASE project supported by Procter & Gamble.

Lukas Schnöing
Lukas Schnöing is a PhD student/research assistant at the Institute for Chemical and Thermal Process Engineering, Technische Universität Braunschweig, Germany (ICTV Research Group Fouling & Cleaning). In 2016, he received a MSc degree in bio- and chemical engineering from the Technische Universität Braunschweig. Currently he is working on aging of proteinaceous deposits and their cleaning behavior.

Wolfgang Augustin
Wolfgang Augustin is a senior researcher at the Institute for Chemical and Thermal Process Engineering, Technische Universität Braunschweig, Germany. He received his Dr.-Ing. in 1992 in Chemical Engineering from Technische Universität Braunschweig. His main research interests are heat and mass transfer, fouling and cleaning and surface interactions on the micro scale level.

Stephan Scholl
Stephan Scholl is a full professor and head of the Institute for Chemical and Thermal Process Engineering at the Technische Universität Braunschweig, Germany. He received his Dr.-Ing. degree in 1991 from the Technical University of Munich. After 11 years with BASF AG, Ludwigshafen, Germany, he joined Technische Universität Braunschweig in 2002. His main research areas are fouling and cleaning, innovative equipment and plant concepts, sustainable production technologies and process technologies for active compounds.

Bart Hallmark
Bart Hallmark is a senior lecturer at the Department of Chemical Engineering and Biotechnology at Cambridge. He joined the faculty in 2008 after completing his PhD and several PDRA positions with Malcolm Mackley, also at the University of Cambridge. His research interests include heat transfer, rheology, computational fluid dynamics, two-phase flow and process design. He is a Chartered Engineer and Chartered Scientist, a member of the Institution of Chemical Engineers and a Senior Fellow of the Higher Education Academy.

Ian Wilson
Ian Wilson holds a personal chair as Professor of Soft Solids and Surfaces in the Department of Chemical Engineering and Biotechnology at the University of Cambridge. He joined the faculty in 1994 after completing his PhD with Paul Watkinson at the University of British Columbia. His research interests include fouling, cleaning, heat transfer, rheology and food engineering. He was awarded an ScD by Cambridge in 2013 for his work on fouling and cleaning and is currently the Editor-in-Chief (Food) of Food & Bioproducts Processing.
References
- E. M. Ishiyama, F. Coletti, S. Macchietto, W. R. Paterson and D. I. Wilson, “Impact of deposit ageing on thermal fouling: Lumped parameter model,” AIChE J, vol. 56, no. 2, pp. NA–545, 2009. DOI: https://doi.org/10.1002/aic.11978.
- E. M. Ishiyama, W. R. Paterson and D. I. Wilson, “Optimum cleaning cycles for heat transfer equipment undergoing fouling and ageing,” Chem. Eng. Sci, vol. 66, no. 4, pp. 604–612, 2011. DOI: https://doi.org/10.1016/j.ces.2010.10.036.
- E. M. Ishiyama, W. R. Paterson and D. I. Wilson, “Aging is Important: Closing the Fouling–Cleaning Loop,” Heat Transfer Eng, vol. 35, no. 3, pp. 311–326, 2014. DOI: https://doi.org/10.1080/01457632.2013.825192.
- F. Schlüter, L. Schnöing, H. Zettler, W. Augustin and S. Scholl, “Measuring Local Crystallization Fouling in a Double-Pipe Heat Exchanger,” Heat Transfer Eng, vol. 41, no. 2, pp. 149–159, 2020. DOI: https://doi.org/10.1080/01457632.2018.1522084.
- T. R. Tuladhar, W. R. Paterson, N. Macleod and D. I. Wilson, “Development of a novel non-contact proximity gauge for thickness measurement of soft deposits and its application in fouling studies,” Can. J. Chem. Eng, vol. 78, no. 5, pp. 935–947, 2000. DOI: https://doi.org/10.1002/cjce.5450780511.
- T. R. Tuladhar, W. R. Paterson and D. I. Wilson, “Thermal Conductivity of Whey Protein Films Undergoing Swelling: Measurement by Dynamic Gauging,” Food Bioprod. Proc, vol. 80, no. 4, pp. 332–339, 2002. DOI: https://doi.org/10.1205/096030802321154862.
- R. J. Hooper, et al., “Comparative Studies of Fluid Dynamic Gauging and a Micromanipulation Probe for Strength Measurements,” Food Bioprod. Proc, vol. 84, no. 4, pp. 353–358, 2006. DOI: https://doi.org/10.1205/fbp06038.
- S. R. Suwarno, et al., “On-line biofilm strength detection in cross-flow membrane filtration systems,” Biofouling, vol. 34, no. 2, pp. 123–131, 2018. DOI: https://doi.org/10.1080/08927014.2017.1409892.
- J.-H. Tsai, G. L. Cuckston, B. Hallmark and D. I. Wilson, “Fluid-dynamic gauging for studying the initial swelling of soft solid layers,” AIChE J, vol. 65, no. 9, pp. e16664–e166676, 2019. DOI: https://doi.org/10.1002/aic.16664.
- M. Lemos, S. Wang, A. Ali, M. Simões and D. I. Wilson, “A fluid dynamic gauging device for measuring biofilm thickness on cylindrical surfaces,” Biochem. Eng. J, vol. 106, pp. 48–60, Feb. 2016. DOI: https://doi.org/10.1016/j.bej.2015.11.006.
- B. Petkovic and P. Watkinson, “Fouling of a Heated Rod in a Stirred Tank System,” Heat Transfer Eng, vol. 35, no. 3, pp. 302–310, 2014. DOI: https://doi.org/10.1080/01457632.2013.825191.
- G. L. Cuckston, Z. Alam, J. Goodwin, G. Ward and D. I. Wilson, “Quantifying the effect of solution formulation on the removal of soft solid food deposits from stainless steel substrates,” J. Food Eng, vol. 243, pp. 22–32, Feb. 2019. DOI: https://doi.org/10.1016/j.jfoodeng.2018.08.018.
- T. Geddert, W. Augustin and S. Scholl, “Induction Time in Crystallization Fouling on Heat Transfer Surfaces,” Chem. Eng. Technol, vol. 34, no. 8, pp. 1303–1310, 2011. DOI: https://doi.org/10.1002/ceat.201000469.
- K. Bode, R. J. Hooper, W. R. Paterson, D. Ian Wilson, W. Augustin and S. Scholl, “Pulsed Flow Cleaning of Whey Protein Fouling Layers,” Heat Transfer Eng, vol. 28, no. 3, pp. 202–209, 2007. DOI: https://doi.org/10.1080/01457630601064611.
- L. Bouvier, G. Delaplace and S. Lalot, “Continuous Monitoring of Whey Protein Fouling Using a Nonintrusive Sensor,” Heat Transfer Eng, vol. 41, no. 2, pp. 160–169, 2020. DOI: https://doi.org/10.1080/01457632.2018.1522091.
- N. Collier, et al., “Ultrasonic Adhesion Measurement of Whey Protein Fouling,” Heat Transfer Eng, vol. 36, no. 7-8, pp. 771–779, 2015. DOI: https://doi.org/10.1080/01457632.2015.954963.
- B. A. Fricke and B. R. Becker, “Evaluation of Thermophysical Property Models for Foods,” HVAC&R Res, vol. 7, no. 4, pp. 311–330, 2001. DOI: https://doi.org/10.1080/10789669.2001.10391278.
- T. J. Davies, S. C. Henstridge, C. R. Gillham and D. I. Wilson, “Investigation of Whey Protein Deposit Properties Using Heat Flux Sensors,” Food Bioprod. Proc, vol. 75, no. 2, pp. 106–110, 1997. DOI: https://doi.org/10.1205/096030897531414.