
 ?Mathematical formulae have been encoded as MathML and are displayed in this HTML version using MathJax in order to improve their display. Uncheck the box to turn MathJax off. This feature requires Javascript. Click on a formula to zoom.
Abstract
Improving productivity in the entertainment industry is a very challenging task as it heavily depends on generating attractive content for the consumers. The consumer-centric design (putting the consumers at the centre of the content development and production) focuses on ways in which businesses can design customized services and products which accurately reflect consumer preferences. We propose a new framework which allows to use data science to optimize content-generation in entertainment and test this framework for the motion picture industry. We use the natural language processing methodology combined with econometric analysis to explore whether and to what extent emotions shape consumer preferences for media and entertainment content, which, in turn, affect revenue streams. By analyzing 6,174 movie scripts, we generate the emotional trajectory of each motion picture. We then combine the obtained mappings into clusters which represent groupings of consumer emotional journeys. These clusters are then plugged into an econometric model to predict overall success parameters of the movies including box office revenues, viewer satisfaction levels (captured by IMDb ratings), awards, as well as the number of viewers’ and critics’ reviews. We find that emotional arcs in movies can be partitioned into 6 basic shapes. The highest box offices are associated with the Man in a Hole shape which is characterized by an emotional fall followed by an emotional rise. This U-shaped emotional arc results in financially successful movies irrespective of genre and production budget. Implications of this analysis for generating on-demand content and improving productivity in entertainment industries are discussed.
1. Introduction
Increasing productivity in creative industries in general and in motion picture industry in particular is a very important problem. According to the U.S. Bureau of Economic Analysis and the National Endowment for the Arts in the US economy, creative industries generated over $763 billion a year with 13% contributed by the motion picture industry in 2015 (The Arts and Cultural Production Satellite Account, 2018, see https://www.arts.gov/sites/default/files/KeyToIndustries2015-2.xlsx for more detail). In the UK, in 2017, the motion picture industry made a £5.2 billion ($6.7 billion) contribution to the GDP. In 2017 the global theatrical film admissions reached a record $39 billion worldwide (see http://www.weareukfilm.com/facts-and-stats for more detail.). Yet, in recent years the labour productivity in the motion picture industry stagnated or showed a negative trend in many countries around the globe (Brighton, Gibbon, Brown, & Luanaigh, Citation2016). Brighton et al. (Citation2016) report that between 2007-2012 the gross value added (GVA) in the movie industry increased only slightly in the US (2.2%), stagnated in the UK (0.0%) and declined in France, Germany, Netherlands and Italy by −0.7%, −0.7%, −3.2%, and −2.1%, correspondingly. At the same time, labour productivity increased in the US (3.5%) but declined in the UK, France, Germany, Netherlands and Italy by −1.7%, −0.8%, −0.4%, −2.5%, and −2.5%, respectively (Brighton et al., Citation2016 p. 19).
Motion picture production and distribution can be described as a process from the operations management perspective. The process is extremely complex and involves diverse parties making many decisions (Vogel, Citation2001). Just like any process, its performance can be measured in terms of productivity. Productivity in an industry is usually computed using the output per time unit divided by the total cost or resources per that same unit of time (Chew, Citation1988). Productivity is a critical determinant of cost efficiency. Yet, in the motion picture industry understanding per time unit output versus cost is problematic due to the fact that much in the industry relies on its creative component (for example, production tasks such as script writing or casting the best actor for a particular role might take years). Therefore, the productivity in movie production is often calculated using a simple return on investment - a ratio of budget and revenue (e.g. Brighton et al., Citation2016). Yet, such proxies of productivity are not very accurate as movie production budgets often include many expenditure items, where productivity is very difficult to assess such as post-production, advertisement and marketing expenditures (e.g. Jockel & Dobler, Citation2006).
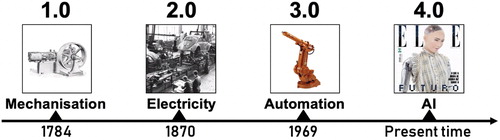
The current productivity challenge in the motion picture industry stems from two types of factors: those general to all industries (general issues) and those applicable only to creative industries (specific issues). The general issues refer to the global shift towards a more data-dense “digital” economy, which offers many opportunities; but, at the same time, creates many challenges (e.g. Ng, Citation2014) related to the new understanding of productivity, operations, as well as productive process (among other things). Specifically, throughout the history, the humanity has lived through 3 industrial revolutions (see ) and is currently living through the Industrial Revolution 4.0 (Skilton & Hovsepian, Citation2017). The difference between the previous industrial revolutions and the current revolution is that only now businesses received access to large amounts of data, which can, on the one hand, provide invaluable insights about consumer preferences, but, on the other hand, catalyze a number of difficult problems such as high levels of automation and the ultimate need for reskilling to adapt to the impact of data science, machine learning and artificial intelligence (AI) implementations (e.g. World Economic Forum, Citation2017).
Figure 1. Four industrial revolutions: A timeline.
The motion picture industry, which originated in the late 19th century, saw a large shift at the end of the 20th century mainly due to two major developments: (a) the increase in “runaway” productions when movies started to be shot in countries with low set and labor costs instead of countries where these costs were high such as the US, UK, and Canada (e.g. Peltzman, Citation2012); as well as (b) the increase in the sophistication of digital technologies, which led to the switch from analog to the digitally enhanced effects and even substitution of actual actors with digitally generated ones (e.g. Purse, Citation2007). Think of mass scenes (such as battle scenes) which at the beginning of the 20th century required the involvement of large numbers of actors, whereas in modern movies these actors are almost entirely replaced by computer-generated agents. Yet, despite all these changes, the productivity in the motion picture industry failed to increase, which is due to specific issues faced by the industry (Brighton et al., Citation2016).
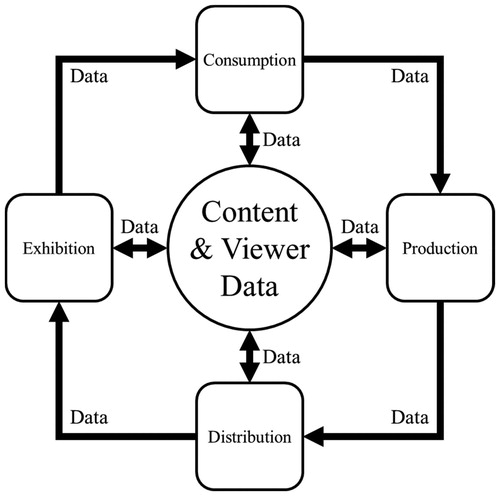
The specificity of the creative domain means that it is very difficult to understand how the productivity could be improved if we consider decisions about the creative process. As a result, much effort usually concentrates around the improvement of the project management – i.e., movie production companies often try to cut costs (e.g., Eliashberg, Elberse, & Leenders, Citation2006) in order to see the improvement in productivity. Yet, if the overall initial direction of the creative process is wrong, cutting costs are unlikely to lead to a productivity improvement. One thing seems clear: any measurement of productivity in the motion picture industry requires understanding viewers’ preferences as for any movie to be a success, it has to find its audience. In this paper, we show how data science could be used to improve productivity in entertainment industries by understanding viewers’ preferences through analyzing emotional content of movies and then using this analysis to formulate predictions about what viewers want to see. Such “optimal” content predictions can then shift creative value chain process into consumer-centric (putting consumer at the center of the business model) and data-centric (based on data) value chain process with the use of data science. Eliashberg et al. (Citation2006) identified the 3 parts of the value chain for the theatrical motion picture industry: production, distribution, and exhibition, which all “precede consumption [part] by movie-going audiences” (Eliashberg et al., Citation2006, p. 2).
This paper argues that current theatrical value chain process requires revision as movies are not simply produced, distributed and exhibited with the end consumer in mind. The modern data science analytics methodology allows us to talk about the data-centric creative value chain loop, which uses viewers’ data in order to predict future preferences of audiences and produce highly desirable content. This loop should not only have a positive effect on the customer satisfaction, but also (through the increase in motion picture revenues) increase productivity. Our proposed framework is depicted on . The main idea behind the proposed framework is that viewers’ data fuels the entire process of movie development and all parts of the value chain not only utilize viewer and (historical) content data from the start, but also connect with each other using data. In this paper, we show how content and viewer data could be combined to influence the production process in order to increase productivity through achieving higher revenue.
Figure 2. Conceptual framework and data-centric creative value chain loop.
One of the seminal decisions in movie making is choosing what the movie is about, i.e., selecting a script (Vonnegut, Citation1981). Regardless of having the best-in-class production and adequate budget, a poor script can lead to a box office disaster (e.g., Vogel, Citation2001). This makes optimization in creative industries very challenging because most of the decisions made are based on intuition and expert judgement. Experts are required to read through hundreds of scripts per year and decide which ones may ensure the next box office success. The amount of new scripts being produced far exceeds the availability of producers to assess them. By taking advantage of machine learning and data science, we propose a novel way to analyze and use data to make more intelligent decisions and increase productivity in motion picture creation process achieving positive impact throughout the entire value chain. By helping experts select better scripts, we can greatly reduce the number of failures. The use of data science in script assessment can foster creativity and artistic expression by promoting counter-intuitive options that would be otherwise discarded by experts relying on common selection heuristics. Specifically, studios often select scripts which are based on best-selling novels (which may or may not work on a big screen). The use of data science may allow studios to invest part of their budget in projects which are likely to be consumed by millions of viewers. With such low-risk investments, studios may also outsource part of their budgets to high-risk experimental projects in order to foster creativity.
Many people regard motion pictures to be an inherent part of their lifetime cultural journey. Regardless of what one calls it – a “film”, a “movie”, or a “picture” – people often have favorites which they remember from childhood, quote on a regular basis, or even use to mimic the style of the main characters. But why do some movies become an almost immediate success going viral around the globe while others are quickly forgotten? The motion picture production and distribution industry are not only a multi-billion-dollar market generating over $120 billion annually; it is also a great storytelling enterprise. According to statista.com the market size of the global movie production and distribution industry in 2017 was $124 billion (for more details, see https://www.statista.com/statistics/326011/movie-production-distribution-industry). The stories told by the motion pictures help people connect with the characters, relive their own experiences, and even escape their daily lives. In this paper, we explore whether and to what extent the success of stories told by motion pictures is defined by the emotional journey which these stories offer to the viewers; and how understanding these emotional journeys can drive business model innovation in the entertainment industry.
Since Aristotle, writers have grappled with the magic formula for storytelling success, trying to anticipate and design the most engaging stories (Aristotle, 1902). In “The Poetics of Aristotle”, Aristotle proposed that sparking an emotional response is very important for telling a successful story as well as identified several story types for ancient poetry. Specifically, he argued: “A perfect tragedy should, as we have seen, be arranged not on the simple but on the complex plan. It should, moreover, imitate actions which excite pity and fear, this being the distinctive mark of tragic imitation” (Aristotle, 1902, p. 45).
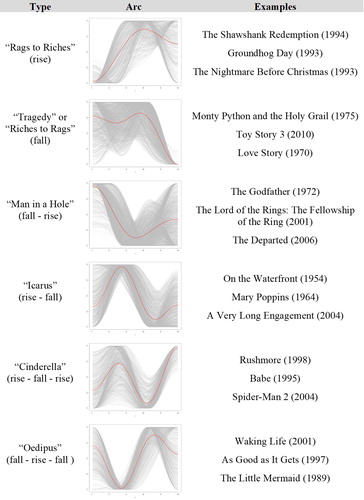
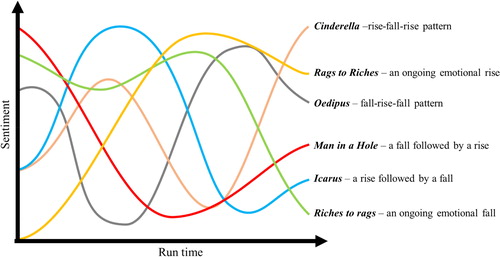
While for many centuries, the emotional content of stories was largely a subject of linguistic analysis in humanities’ research, recent advances in Natural Language Processing (NLP) and computational narratology allow scientists to significantly advance the sentiment analysis of storytelling. One of the first examples of using information technology to analyze emotional content of stories belongs to Kurt Vonnegut. He not only coined the term “emotional arc” of a story, but also visualized it in a two-dimensional space defining it as a correspondence between the timing of the story (“Beginning-End”) displayed on a horizontal axis, and its emotional journey (“Ill Fortune-Great Fortune”) shown on a vertical axis (Vonnegut, Citation1981). More recently, the methodology of Aristotle and Vonnegut was extended and popularized by a team of researchers from the Computational Story Laboratory at the University of Vermont who used the NLP methodology to map emotional journeys of a filtered dataset consisting of 1,327 novels from Project Gutenberg’s digital fiction collection and identified 6 emotional arcs which describe all those stories (Reagan, Mitchell, Kiley, Danforth, & Dodds, Citation2016). Reagan et al. (Citation2016) showed that all analyzed novels could be partitioned into 6 clusters where each cluster represents a specific emotional trajectory:
Rags to Riches – an emotional trajectory showing an ongoing emotional rise.
Riches to Rags – an emotional trajectory showing an ongoing emotional fall.
Man in a Hole – an emotional trajectory showing a fall followed by a rise.
Icarus – an emotional trajectory showing a rise followed by a fall.
Cinderella – an emotional trajectory showing a rise-fall-rise pattern
Oedipus – an emotional trajectory showing a fall-rise-fall pattern
Recently, the importance of emotional arcs has also been emphasized not only for storytelling (Fernandes, Citation2018; Ferraz de Arruda, Nascimento Silva, Queiroz Marinho, Amancio, & da Fontoura Costa, Citation2018; Green, Grorud-Colvert, Mannix, & Shanahan, Citation2018; Grubert & Algee-Hewitt, Citation2017) but also for the audio-visual content design (Chu & Roy, Citation2017). As award-winning scriptwriter Frank Cottrell-Boyce once put it while talking about a recipe for a perfect motion picture story: “All the manuals insist on a three-act structure. I think this is a useless model. It's static. All it really means is that your screenplay should have a beginning, middle and end. When you're shaping things, it's more useful to think about suspense. Suspense is the hidden energy that holds a story together. It connects two points and sends a charge between them. But it does not have to be all action. Emotions create their own suspense.” (see The Guardian interview with Frank Cottrell-Boyce https://www.theguardian.com/film/2008/jun/30/news.culture1 for more information). Using 509 Hollywood (full-length) motion pictures and 1,326 short videos from Vimeo channel “Short of the Week” (between 30 seconds and 30 minutes long), Chu and Roy (Citation2017) combined audio and visual information from movies to map sentiment using neural networks methodology (other examples of the usage of neural networks in motion picture analytics are provided in Eyben, Weninger, Squartini, & Schuller, Citation2013; Zhang, Tang, Xiong, Wang, & Zhang, Citation2019). For short videos, they identified audio-visual emotional arcs which attracted the highest number of comments on Vimeo. They showed that for videos with a median length of slightly over 8 minutes, the highest number of clicks were achieved by the emotional trajectory somewhat resembling Icarus which ended on a steep decline. Other trajectories with high number of clicks were characterized by significant emotional peaks close to the end of the video.
In this paper, we use a unique filtered dataset of 6,174 full-length movie scripts from https://www.opensubtitles.org to generate a mapping of screen content capturing the emotional arc of each motion picture. We then accumulate emotional arcs into clustered trajectories which represent groupings of viewer emotional journeys. These clusters are then used to predict a wide variety of movie success characteristics: revenues, satisfaction levels, audience capture, award nominations and award wins.
We find, using a different pattern-detection and clustering algorithms than that presented in Reagan et al. (Citation2016), that full-length motion pictures’ scripts fall within the same 6 major emotional arcs as novels’ arcs reported in Reagan et al. (Citation2016). We also show that when success of a motion picture is measured by box office revenues, viewers tend to prefer movies with emotional trajectory of Man in a Hole. This result is robust even if we control for production budget and genre of the movie. We also conclude that Man in a Hole movies tend to succeed not because these motion pictures are associated with the highest viewer satisfaction. This emotional arc tends to attract viewers’ attention and spark discussions. It does not mean, however, that only Man in a Hole movies are set for financial success: our results also show that if a genre and budget of the film is chosen carefully, it is possible to produce a financially successful movie in any of the 6 emotional arcs’ shapes.
This paper is organized as follows. We start by describing related literature and our contribution to the existing research. We then provide an overview of our dataset, ways in which the data was cleaned and pre-processed and identify main methodological approaches used in our analysis. Results of our analysis are presented in the Results section. Finally, we conclude the paper with a general discussion of our findings.
2. Related literature
This research is related to several strands of literature (a summary of our comprehensive and structured literature review is presented in Table A in the Appendix): (i) literature on productivity and business models in creative industries; (ii) literature on operations research and creative industries and (iii) literature on data science and creative industries. The literature on productivity and business models in creative industries primarily looks at the demand and supply determinants for the creative content using either standard econometric methodology or conceptual qualitative analysis. For example, Marburger (Citation1997) considers optimal ticket pricing for performance goods. Hornidge (Citation2011) looks at the economic program and boundary concepts in creative industries proposing a general framework for analyzing the business component of creativity. Carrillat, Legoux, and Hadida (Citation2018) conduct a meta-analysis of various methodologies allowing to measure the motion picture performance and success. Distribution planning strategies in the motion picture industry is discussed in Somlo, Rajaram, and Ahmadi (Citation2011) and major business models for the industry are analyzed in Ribstein (2012).
The literature on operations research and creative industries considers a wide variety of managerial problems and how these problems can be solved using qualitative analysis. For example, Amolochitis, Christou, and Tan (Citation2014) consider how movie consumption can be optimized using a commercial-strength parallel hybrid movie recommendation engine. De Pater, Judge, and Scott (Citation2014) analyze the movie production process and look at the optimal choice of the movie stars for various projects using their demographic and income categories such as age, gender, as well as compensation rates. Optimization of sales and movie distribution decisions is a theme of Oh, Roumani, Nwankpa, and Hu (Citation2017), while Carroll Harris (Citation2018) examines film distribution as a policy. Sudarwati, Prasetyawati, and Ramadhan (Citation2018) explore competitive decision making in creative industries using value added and non-value-added activities. Allahbakhsh and Ignjatovic (Citation2015) look at the rating scores for creative content and how the design and structure of the scoring systems affect profitability.
The literature on data science and creative industries is a rapidly developing field trying to explore how large datasets can contribute to the new understanding of consumer choice, success and decision making in these industries. Several papers use multiple movie attributes over large historical datasets to understand the determinants of profitability using attributes of the creative content. For example, Pokorny, Miskell, and Sedgwick (Citation2019) consider how film sequels in 1988-2015 decrease the level of revenue uncertainly. Anantha Natarajan, Sai Harsha, and Santhosh Kumar (2019) develop a predictive analytics model for the box-office revenue using large datasets. Ahmed, Waqas, and Afzal (Citation2019) look at the pre-production information usage to forecast future revenues. Cyclicity in the motion picture production is analyzed in Wallin (Citation2019). Lu and Xing (Citation2019) use conjoint analysis to predict box office success. Focusing on Bollywood movies, Masih and Ihsan (Citation2019) use Academy Awards to understand determinants of successful movies. Chen, Chen, and Weinberg (Citation2013) consider how the types of movie releases impact on their box offices. Lash and Zhao (Citation2016) explore the characteristics of movies which can serve as early (pre-release) predictors of profitability. Hwang et al. (Citation2017) use the Korean motion picture market to create a forecasting model using the big data analysis. Court, Gillen, McKenzie, and Plott (Citation2018) employ two information aggregation mechanisms to forecast the opening weekend box office revenues of movies. Complexity in the box office prediction for the Chinese movie market is examined in Xiao, Li, Chen, Zhao, and Xu (Citation2017). At a more general level, Piergiovanni, Carree, and Santarelli (Citation2012) consider how the factors of regional economic growth affect creative industries using many parameters.
Analytics of online reviews or social media reactions to the movie content is another important direction in this research. Notably, Feng (Citation2019) considers film rating from the American and Chinese viewers to understand the cultural differences in the creative content perceptions. Cheng and Huang (Citation2019) explore how consumer reviews can be used for opinion-mining and contextual factor extraction to understand movie sales. Vanitha, Sumathi, and Soundariya (Citation2019) conduct a large-scale exploratory analysis of movie reviews to understand customer reactions. Lee, Xu, and Lin (Citation2019) use online reviews to predict theater box office sales as well as online DVD sales. Hu, Shiau, Shih, and Chen (Citation2018) consider consumer reviews from the US between 2009 and 2018 to create a predictive model of movies’ box offices. Hossein and Miller (Citation2018) use Twitter reactions to anticipate motion picture box office performance.
Natural language processing techniques are used in several recent papers to discover how textual information can influence success and profitability in creative industries. For example, Bae and Kim (Citation2019) analyze movie titles to understand (through the topic recognition exercise) how titles impact the box office success. Hwangbo and Kim (Citation2019) apply a text mining approach to understand whether natural language processing can help achieve sustainable performance in the film industry. Garcia-del-Barrio and Zarco (Citation2017) as well as Nemzer and Neymotin (Citation2019) use verbal content of movies to understand how verbal information in movies is related to revenues.
Machine learning, deep neural networks as well as other sophisticated computational techniques are also used in recent research to predict revenues. Specifically, Zhou, Zhang, and Yi (Citation2019) offer a model which is trying to predict box-office revenues using deep neural networks. Hsieh et al. (2018) develop a temporal sequencing model using movie trailers to predict box office revenues. Antipov and Pokryshevskaya (Citation2017) use a random forest-based model to create a predictive algorithm for motion picture revenues. Ru, Li, Liu, and Chai (Citation2018) explore how incremental daily box office predictions for movies can be generated using deep neural networks analysis. Lee, Park, Kim, and Choi (Citation2018) look at the granular analytics of the movie success using machine learning techniques which is aimed at increasing the accuracy of revenue prediction. Mak and Choo (Citation2018) forecast movie demand using total and split exponential smoothing.
A handful of papers use sentiment analysis to understand movies’ success. Yet, all these papers concentrate on sentiment in customer feedback, reviews or reactions. Specifically, Rajput, Computer Science Department, University of California, Los Angeles (UCLA), United States, Sapkal, and Sinha (2017) use Twitter data to conduct the sentiment analysis of customer feedback. Lyu, Jiang, Ding, Wang, and Liu (Citation2019) use online “word-of-mouth” to study how different product dimensions in creative content is perceived by the customers. Kim, Kang, and Jeong (Citation2018) use 233,631 reviews from Korean viewers discussing 147 movies and show that sentiment loading of the customer reviews is a good predictor of the box office success of these movies. In a similar vein, Hur, Kang, and Cho (Citation2016) use sentiment analysis of movie reviews to generate predictions about revenue.
This paper extends all 3 strands of literature in the following ways. First, instead of considering the sentimental component of customer reviews, we consider the emotional loading of movies’ content. Specifically, we conduct a sentiment analysis of the movies’ creative content (i.e. movie subtitles) to understand the direct impact of movies’ emotional arcs on customer decision making process. Second, we propose a 2-stage analysis for our model of box office success: (i) in the first stage, we use natural language processing and the sentiment analysis to obtain the sentimental topology of movies based on their emotional arcs; (ii) in the second stage, we use econometric model to predict box office success using the sentimental topology obtained in the first stage. Finally, to the best of our knowledge, this is the first paper not only offering a data-centric approach to solving the productivity problem in creative industries, but also the first paper showing how such an approach could be implemented in practice using publicly available data.
3. The data
The dataset for this project was compiled from several sources. We harvested subtitle files from https://www.opensubtitles.org. Additional information about each motion picture was obtained from https://www.imdb.com. We also used https://www.the-numbers.com data on movies revenues as well as estimated production budgets which we employed to make judgments about productivity.
In the first instance, 156,568 subtitle files were obtained from an open source website https://www.opensubtitles.org. As of June 25th 2018, the website had a collection of 4,524,139 subtitles in multiple languages. For the purposes of this project we concentrated on subtitles in English. In order to filter the obtained subtitles for quality and reliability and make sure that the subtitle files were linked to our main proxy of success (revenue), we have applied the following procedure. First, if a motion picture had more than one subtitle file listed on https://www.opensubtitles.org, we removed duplicates and only kept files with the highest number of download count. This reduced the total number of subtitles to 27,883. Second, the obtained dataset was matched with the data extracted from https://www.the-numbers.com on revenues. This dataset was cross-checked and complimented with the data on revenues listed on https://www.imdb.com. The web resource https://www.the-numbers.com provided three variables for motion pictures which helped us to measure productivity: estimated production budget, domestic gross revenue, and worldwide gross revenue. For the overwhelming majority of movies, gross domestic revenue meant gross domestic revenue in the US and was measured in US dollars since the majority of movies in our sample were produced in the US. Where gross domestic revenue was indicated in British pounds or some other currency, we have converted the revenue number to US dollars. Gross domestic revenue was available for 9,015 motion pictures. Production budget estimates and worldwide gross revenues were available for a subset of these movies. We removed movies records for which we could not find gross domestic revenue, yielding 9,015 records.
Third, quality control criteria were applied to the dataset. The subtitles repository https://www.opensubtitles.org is an open-source website, where individual users post subtitle files. Yet, it allows all subtitle consumers to rank user members who post subtitles awarding them bronze, silver, gold, or platinum membership ranks (see ). The membership rank depends on the quality of subtitles users post as downloaded and rated by other users. We only used subtitles from ranked users (bronze, silver, gold, and platinum members) and discarded scripts posted by unranked users reducing the dataset to 6,562 subtitle records. We then removed all subtitles where the length of the text was less than 10,000 characters to ensure that our analysis is based on long motion pictures yielding the dataset of 6,427 subtitle files.
Figure 3. Screenshot depicting an example of open subtitles user ranking and membership record.

Finally, the dataset was matched with additional information about motion pictures from IMDb (https://www.imdb.com). This information included: the IMDb motion picture ID number; date of release; average IMDb user satisfaction rating from 1 (very bad) to 10 (excellent); critics satisfaction meta score from 0 (very bad) to 100 (excellent); all IMDb genres of the movie (multiple genres were usually listed for each movie on the IMDb website); rating count (number of individual assessments contributing to IMDb rating); number of user reviews; number of critics reviews; number of awards (Oscars and other awards); name of the motion picture director; runtime in minutes; and age appropriateness rating. Matching and further cleansing of the data (removal of duplicates with the same IMDb ID numbers) produced a total final dataset of 6,174 subtitle files. To prepare the subtitles for analysis, we removed time stamp information as well as any special characters not contained in “abcdefghijklmnopqrstuvwxyzABCDEFGHIJKLMNOPQRSTUVWXYZ'.?!”.
4. Methodology and hypotheses
We used the resulting filtered dataset of 6,174 movie subtitles to conduct the sentiment analysis of motion pictures. To that end, syuzhet R package was used. Our analysis, different from that offered in the previous literature (specifically, distinct from that offered in Reagan et al., Citation2016) included the following steps (see ). First, the emotional arc of each motion picture was calculated by applying the default labelled lexicon developed at the Nebraska Literary Laboratory using cleaned script of each motion picture. See https://github.com/cran/syuzhet/blob/master/README.md for more detail. To that end, each script was partitioned into sentences and for each sentence the valence was calculated by assigning every word its sentimental value where
referred to emotionally negative terms;
referred to emotionally neutral terms; and
referred to emotionally positive terms according to the lexicon. The resulting sentiment was scaled to fall within the interval
Then the sentiment trajectory was transformed using the Discrete Cosine Transform (DCT). After that, the resulting trajectory was uniformly sub-sampled to have 100 elements so that each motion picture sentiment arc could be represented using the motion picture timing from 0% (beginning of the movie) to 100% (end of the movie).
Figure 4. Steps of the analysis.
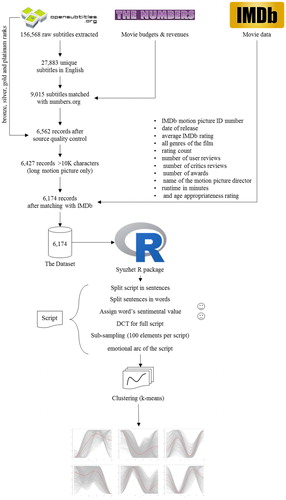
We then accumulated all emotional arcs from motion pictures in the sample and applied the following innovative procedure to clustered trajectories. Our approach has several important distinctions from that applied by Reagan et al. (Citation2016). First, our sentiment analysis uses improved and more robust algorithmic approach, recently described in the computer science research (e.g. Das & Chakraborty, Citation2018; Wang & Shin, Citation2019). Second, our clustering procedure is not the same as that used in Reagan et al. (Citation2016) though representative of the general class of k-means clustering. Let functional variable χ be a random variable taking values in a functional space Thus, a functional data set is a sample
drawn from a functional variable χn. Here, we represented the sentiment arc associated with a movie
as a realization of χn,
where
is fixed and
Clustering on this functional data was carried out using the k-means algorithm in which distances were calculated by approximating the metric:
by Simpson's rule, where
We used the fda.usc package in R to do the clustering.
Our choice of this clustering procedure is justified by the following reasons. First, k-means clustering is one of the most popular clustering techniques used in many different domains from marketing to astronomy (e.g. Steinley, Citation2006). To increase the simplicity of replication of our analysis, k-means was also the most obvious contender as it is included in many statistical packages and tools (i.e. k-means analysis can be easily replicated in R and/or Python). Second, k-means is a good choice of clustering procedure because it allows to obtain a meaningful intuition about the structure of data. Third, k-means assumes spherical shapes of clusters, which was found in the previous natural language processing research in other domains. Finally, despite some drawbacks (e.g., when clusters overlap, k-means does not have a good tie-breaking rules for classifying data), this method is more intuitive compared to other contenders such as the mean-shift clustering (e.g., Anand, Mittal, Tuzel, & Meer, Citation2014); density-based spatial clustering (Duan, Xu, Guo, Lee, & Yan, Citation2007); Gaussian mixture models (Maugis, Celeux, & Martin‐Magniette, Citation2009); or agglomerative hierarchical clustering methodologies (Bouguettaya, Yu, Liu, Zhou, & Song, Citation2015).
Our clustering procedure allows us to classify movies according to their emotional arc. We then use econometric analysis to understand whether and to what extent emotional arc clusters can predict movies’ box office success. Note, that our methodology for predicting box office success using emotional arcs in movies has 2 stages. First, we conduct clustering analysis using the natural language processing techniques. Second, we turn the results of our clustering analysis into an independent variable, which is then becomes a potential predictive indicator in an econometric model. Notice that our approach is also different from that by Reagan et al. (Citation2016) because
We test the theory of emotions for generating consumer-centric content which dates back to the work of Aristotle who proposed that successful theatrical content can be generated via influencing viewers’ emotions (e.g., Aristotle, 1902).
We propose innovative way of mapping emotional arcs and clustering those arcs, which is distinct from that offered in the previous literature (e.g., Reagan et al., Citation2016).
Despite using different algorithmic tools, we show that movies much like books map onto 6 major emotional arcs.
Unlike the previous research on books, we measure not only success due to “soft” popularity of content (average satisfaction, number of viewer reviews), but also due to viewers’ willingness to pay for the content which can be used to measure productivity in the entertainment industry.
Finally, the clustering analysis is only a part of our approach, whereas in Reagan et al. (Citation2016) it is the main focus of the study.
Many motion pictures are based on best-selling novels (e.g. Vogel, Citation2001). For a recent account of how books translate into movies see https://www.theverge.com/2017/1/26/14326356/hollywood-movie-book-adaptations-2017-expanse-game-of-thrones. In part, this may be the case due to risk management: if a motion picture is based on a popular written content it is believed to be more likely to succeed in movie theaters. If this is the case, then it is quite likely that movies should generally evoke the same or similar emotions as novels. Therefore, we expect to see that, much like novels, motion pictures can be partitioned into the same 6 clusters: Rags to Riches, Riches to Rags, Man in a Hole, Icarus, Cinderella, and Oedipus. Hence, we formulate our first hypothesis as:
(1) Hypothesis 1: Emotional arcs generated by movies fit the same 6 clusters as novels.
Reagan et al. (Citation2016) find that Icarus, Oedipus, and Man in a Hole produce more successful novels when success is measured by the number of downloads. We expect that the same three emotional arcs’ clusters will perform well in the movie theaters. Specifically, our second hypothesis is:
(2) Hypothesis 2: Similarly to novels, motion picture emotional arcs resembling Icarus, Oedipus, and Man in a Hole shapes are associated with more successful movies.
Our dataset allows us to use several measures of movie success. Specifically, we consider revenue figures, movie awards, as well as satisfaction indicators to assess the success of each motion picture. Additionally, we are also able to explore how emotional arcs in conjunction with other indicators affect movie success. Specifically, we consider how genres combined with emotional arc clusters affect success variables. Budget estimates give us an opportunity to conduct a robustness check of our results. We use an econometric model to understand whether and how emotional arcs in movies can be used to create better (more desirable) movies.
5. Results
In this section we test our hypotheses and explore how robust our results are. We find that similarly to novels (see Reagan et al., Citation2016), all analyzed movie scripts can be partitioned to fit 6 major emotional trajectories (clusters) where each trajectory is obtained using the clustering procedure described in . Note that even though we tested the theoretical hypothesis of movies falling within 6 emotional arcs, we have conducted clustering procedures with different number of clusters. Specifically, we have performed clustering procedure using 4, 6, 8, 10, and 12 clusters. Our analysis shows that 6 is the optimal number of clusters as <6 clusters result in imprecise fitting of the general pattern functions and >6 clusters produce similar clusters which are hard to distinguish looking at the resulting functional forms. Results of the robustness check clustering are available from the corresponding author upon request. This confirms our Hypothesis 1. shows all 6 clusters of emotional trajectories and provides examples of films which fall within each cluster.
Figure 5. Six emotional trajectories of movies.
5.1. Emotional arcs and success of motion pictures
Our resulting filtered dataset of 6,174 movies consists of 632 movies in the Rags to Riches cluster; 1,402 movies in the Riches to Rags cluster; 1,598 movies in the Man in a Hole cluster; 1,113 in the Icarus cluster; 804 movies in the Cinderella cluster; and 625 movies in the Oedipus cluster (see for summary statistics).
Table 1. Summary statistics.
Therefore, each cluster contains at least 625 movies. According to , movies are relatively balanced in terms of length with average run times between 108 and 110 min. As a result, we obtain 6 arcs (see where each graph shows an emotional arc with the length of the movies from the beginning to the end shown on a horizontal axis and the related sentiment is shown on the vertical axis on a scale from -1 depicting sad meanings to 1 depicting happy meanings). In order to compare the success of movies in each emotional trajectory cluster we first considered gross domestic revenue as a success indicator. We initially used this variable because we could not find worldwide gross revenue for all movies in our dataset, yet gross domestic revenue was available for all 6,174 movies. We use worldwide gross revenue variable in later subsections and show that our results are essentially the same when we consider gross domestic revenue and worldwide gross revenue.
Figure 6. Emotional arcs found in films.
shows that top three clusters in terms of mean gross domestic revenue are Man in a Hole (earning $37.48 million on average); Cinderella (with $33.63 million mean revenue); and Oedipus (yielding $31.44 million on average). Notably, two of the three top earning emotional trajectories in our analysis coincide with those found by Reagan et al. (Citation2016). Specifically, while Man in a Hole and Oedipus emotional trajectories are associated with the most downloaded e-books as well as with the highest revenue-generating movies, Cinderella trajectory outperforms Icarus in movie theaters. This may indicate that people’s desired emotions depend on the time length of their experience. Specifically, it is safe to assume that the same story is experienced in more condensed time when one watches a movie compared to when one reads a book.
Specifically, movies in our dataset last on average 108 minutes while reading a book with a similar story would take an average reader many hours if not days. In other words, consumption time for a book is greater than that for a movie. Consequently, one reason why Icarus movies do not do as well as Icarus books could be that in a time-limited environment people do not want to experience emotional fall which is not followed by an equivalent or nearly equivalent emotional rise.
However, people are quite happy to experience such a dramatic fall during a larger period of time when the intensity of emotional fall is diffused (i.e., when reading a book). In contrast, Cinderella emotional trajectory provides a noticeable emotional rise towards the end of the story despite the emotional fall in the middle of the movie. This emotional rise may be more desirable for the viewers of the movies compared to the readers of the books.
At the first glance, if we consider mean values of the gross domestic revenue as a proxy of success, two of three clusters of emotional trajectories are the same for movies and books. Yet, are movies in these three clusters earning statistically significantly more than movies in other clusters? We conducted a series of OLS regressions with gross domestic revenue as a dependent variable and dummies for each of the emotional trajectories to understand whether obtained differences in revenues are statistically significant. Unfortunately, Reagan et al. (Citation2016) do not provide statistical significance levels for their results which makes it difficult for us to compare our findings to those reported in their paper. Our results show that only one cluster – Man in a Hole – produces statistically significantly higher gross domestic revenue compared to other clusters. Moreover, in a regression analysis, Oedipus cluster reveals negative (though not statistically significant) correlation with gross domestic revenue. As shown in , the effect of Man in a Hole cluster is high (the coefficient is equal to 6.5613 suggesting that producing a movie with Man in a Hole emotional arc is equivalent to the mean increase in gross domestic revenue of over $6 million), positive, and significant at 0.1% level. Four emotional trajectory clusters: Cinderella, Oedipus, Icarus, and Rags to Riches do not reveal statistically significant results.
Table 2. Results of the Series of OLS regressions with emotional arcs as independent variables.
Interestingly, the Riches to Rags cluster shows a negative and statistically significant correlation with gross domestic revenue. The effect is quite large (the coefficient of −3.4599 indicates that producing a film with Riches to Rags emotional arc is equivalent to the mean decline in domestic revenue of more than $3 million).
reports several interesting results regarding other success indicators. Specifically, even though Man in a Hole produces statistically significantly higher gross domestic revenue than any other emotional arc, the IMDb ratings' coefficient associated with this emotional arc is negative and significant. The effect of the arc on IMDb user rating is rather small yet significant. According to , IMDb user ratings for all emotional trajectory clusters are very similar: 4 of 6 clusters have an average rating close to 6.5; Man in a Hole has a mean rating of 6.45 and Rags to Riches has an average rating of 6.64. Regression results reported in show that there is a positive and statistically significant correlation between movies in the Rags to Riches cluster and IMDb rating although the effect is small.
The Man in a Hole cluster is also not associated with high critics' scores on IMDb. Specifically, there is a negative and statistically significant correlation between IMDb critics' meta score and Man in a Hole cluster. At the same time, critics' meta score is positively correlated with Riches to Rags cluster which tend to be associated with low revenues. These results suggest that critics tend to prefer stern movies (possibly with an unhappy ending) and these movies tend to be less successful in generating revenue.
Why does the Man in a Hole emotional arc produce high revenue but does not generate high user and critics’ ratings on IMDb? There could be several reasons for this: (1) people are more likely to leave feedback (rating or review) if they did not have a good experience so it could be that there is some bias in the IMDb satisfaction scores which, generally, are lower than the average viewers’ attitude or (2) IMDb scores are provided by a different audience than that which primarily contributes to the movie revenue, etc. More insight into the difference between IMDb ratings and gross domestic revenue is provided by further variables capturing the number of people leaving ratings and reviews. All three variables that capture the level of activity on IMDb – rating count, the number of user reviews, and the number of critics’ reviews – are positively and significantly correlated with the Man in a Hole emotional trajectory. If we assume that the mean IMDb user rating and the IMDb meta score could be taken as a proxy of viewers’ and critics satisfaction respectively, our results may suggest that highest earning movies are not necessarily the ones that are liked by the audience, but rather are those that attract the most attention. In other words, the Man in a Hole emotional trajectory does not produce the “most liked” movies, but generates the most “talked about” movies.
To verify the relations between different proxies of success used in our analysis, we conduct a clustered OLS regression analysis (where standard errors are clustered at the level of each emotional arc) with gross domestic income as a dependent variable and IMDb success indicators as independent variables. Results of this analysis are reported in . Our findings summarized in confirm our conjecture that high IMDb ratings are not associated with the highest revenue. Specifically, while user ratings (satisfaction indicators) are generally negatively correlated with the gross domestic revenue, popularity indicators (number of ratings, number of user and critics’ reviews) are positively correlated with the gross domestic revenue. For robustness, we have also conducted the same analysis using worldwide revenue for a reduced sample of movies (3,051 observations in our dataset contained information on worldwide revenues). shows that results of the OLS clustered regression with worldwide revenue as a dependent variable essentially repeat those with gross domestic revenue as a dependent variable.
Table 3. Correlations between success variables: Clustered OLS regression results.
also shows that the Oedipus cluster does not generate many ratings and reviews compared to other clusters. Despite being one of the top 3 earning arcs according to the average indicators reported in , the Oedipus cluster is negatively correlated with gross domestic revenue, though this correlation is not statistically significant according to . This cluster also produces a negative correlation with non-Oscar awards and non-Oscar award nominations. Specifically, Oedipus movies are less likely to be nominated for non-Oscar awards, and less likely to receive them than any other cluster (see ). Interestingly, according to , Oscars are generally associated with higher domestic and worldwide revenue. However, this could be due to increased popularity following an Oscar award as well as the fact that production companies often carefully select release dates for Oscar-nominated movies (See, e.g. https://www.theatlantic.com/entertainment/archive/2013/01/release-dates-oscars/319514/ for more detail.).
5.2. Emotional arcs and movie budgets
So far, we have established that the Man in a Hole emotional trajectory generates the highest gross domestic revenue which partially confirms our Hypothesis 2. We also found that (based on assumption that IMDb rating indeed capture viewer satisfaction rates) this emotional trajectory is top earning not because it produces the most “liked” content but because movies in this cluster attract most viewer attention. We now turn to the robustness check of our results and explore whether and how production budgets affect revenues.
Motion pictures are expensive to produce and it is important to understand whether and to what extent high revenue is associated with the level of initial investment in movie production. To explore this issue, we look at the estimated production budgets obtained from https://www.the-numbers.com repository for a subsample of our dataset. Specifically, for 3,051 movies we have budget information. It is important to note that the repository only provides budget estimates. This is due to the fact that budget figures are usually a part of the production commercial secret. Specifically, https://www.the-numbers.com provides the following statement about movie production budget figures: “Budget numbers for movies can be both difficult to find and unreliable. Studios and film-makers often try to keep the information secret and will use accounting tricks to inflate or reduce announced budgets. This chart shows the budget of every film in our database, where we have it. The data we have is, to the best of our knowledge, accurate but there are gaps and disputed figures.” With this limitation in mind we first summarize statistics for a subsample of movies in our dataset for which we have gross domestic revenue, worldwide revenue, as well as estimated budgets (see ).
Table 4. Estimated budgets, gross domestic revenue, and worldwide revenue for a subsample of 3,051 motion pictures.
As we can see from , the Man in a Hole emotional trajectory cluster generates the highest revenue not only according to the values obtained from our total sample of 6,174 movies, but also according to the numbers obtained using a subsample of movies with budget estimates (3,051 movies). This is true for both the gross domestic revenue as well as for the worldwide revenue. A series of OLS regressions reveal that Man in a Hole is the only emotional trajectory which produces statistically significant results showing that it is more financially successful than any other emotional arc using a subsample of data with budgets. This is the case for gross domestic revenue (the coefficient is equal to 5.217438 with standard error of 2.713389 and a significance level of p = 0.055); as well as for the worldwide revenue (the coefficient is equal to 12.02102 with standard error of 7.043771 and a significance level of p = 0.088). In other words, our result that Man in a Hole is generating the highest revenue is confirmed for both gross domestic revenue and worldwide revenue using a smaller sample of data though (unsurprisingly) the statistical significance level decreases for a smaller sample (both regression coefficients are significant at 10% level).
also reveals that the Man in a Hole movies are associated with the highest average estimated budget. Specifically, for our subsample of 3,051 movies with budget information, Man in a Hole movies on average cost $40.5 million to produce (and earn on average $54.9 million), while Cinderella movies have a mean estimated production budget of $39 million (and earn on average $51.7 million), Oedipus movies cost $38.2 million (and earn $48.7 million); Rags to Riches - $36.3 million (and earn $48.6 million); and Icarus – $35.7 million (earning almost $49 million). Does it mean that the Man in a Hole emotional trajectory simply requires more investment and this drives higher revenue? If this is the case, then we should observe (i) that budgets for Man in a Hole movies are significantly higher than those for movies within other emotional arcs; and (ii) that there is a higher dependency between budget numbers and the Man in a Hole cluster compared to all other clusters. To test our conjecture (i), we first conduct a series of pairwise non-parametric comparisons between Man in a Hole cluster budgets and budgets of all other clusters. We use non-parametric tests because these tests do not assume any variable distributions in order to avoid potential biases in our analysis. A series of Mann-Whitney Wilcoxon test (comparing budget means) show that Man in a Hole movie budgets are not statistically significantly different from budgets of the Rags to Riches cluster (p > 0.10), Cinderella cluster (p > 0.18), and Oedipus cluster (p > 0.16) but higher than average budgets of Riches to Rags (p < 0.001) and Icarus movies (p < 0.005). Furthermore, the Kolmogorov-Smirnov test (comparing distributions of budgets) also shows no difference between Man in a Hole and Rags to Riches (p > 0.27), Cinderella (p > 0.12), and Oedipus (p > 0.31) budgets and significant difference between Man in a Hole and Riches to Rags (p < 0.01) and Icarus (p < 0.05). If budget indeed was the main determinant of the revenue, we should have seen Rags to Riches, Cinderella, and Oedipus (as Man in a Hole) generate statistically significantly greater revenues compared to Riches to Rags and Icarus. Yet, this is not the case.
To test our conjecture (ii), we look at the relation between budgets and revenues for each emotional arc (see ). A series of OLS regressions with gross domestic revenue () and worldwide revenue () as dependent variables and estimated budget as an explanatory variable shows that movie budgets are positively correlated with revenues for all emotional arcs.
Figure 7. Correlations between movie production budgets and revenues by emotional arc.
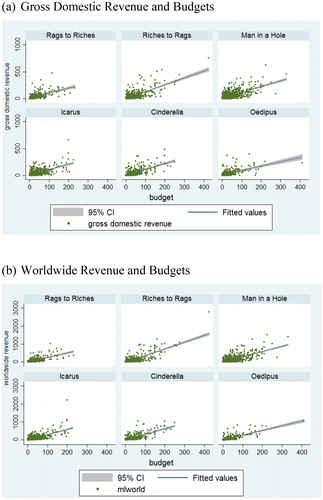
When we use gross domestic revenue as a dependent variable, this relationship is highly statistically significant (at 0.1% level) for all clusters. Furthermore for 5 clusters: Rags to Riches (regression coefficient 0.91); Riches to Rags (regression coefficient 1.27); Man in a Hole (regression coefficient 1.07); Icarus (regression coefficient 1.06) regression coefficients are similar and close to 1 (meaning that a $1 million increase in budget usually leads to approximately $1 million increase in revenue).
Only for the Oedipus emotional arc do we observe a slightly lower regression coefficient of 0.80. Furthermore, one of the least financially successful arcs – Riches to Rags – has the highest regression coefficient. Results obtained for the gross domestic revenue are confirmed for the worldwide revenue (see ). For worldwide revenue, the relationship between budgets and revenues for all emotional arcs are positive and highly significant at 0.1% level; and coefficients range between 2.59 (lowest coefficient) for the Oedipus cluster and 3.76 for the Riches to Rags cluster (highest coefficient). This means that even though budget plays an important role in movie production and contributes to the motion picture’s subsequent financial success, the Man in a Hole emotional arc does not have a higher dependency on budget than other emotional arcs. Therefore, heterogeneity in production budgets cannot explain the Man in a Hole relative financial success compared to other arcs.
So far, we have established that the financial success of the Man in a Hole emotional arc cannot be explained by higher financial investment. We now explore whether and to what extent the compound effect of budget and emotional arc contributes to motion picture revenue. This allows us to understand whether Man in a Hole financial success is driven by movies falling within a particular budget category.
We partition movies into 8 categories according to the production budget variable: (1) movies with budgets of up to $1 million (N = 107); (2) movies with budgets between over $1 million and $5 million (N = 346); (3) movies with budgets between over $5 million and $10 million (N = 339); (4) movies with budgets between over $10 million and $20 million (N = 615); (5) movies with budgets between over $20 million and $30 million (N = 399); (6) movies with budgets between over $30 million and $50 million (N = 512); (7) movies with budgets between over $50 million and $100 million (N = 518); and (8) movies with budgets over $100 million (N = 215). We then conduct a series of OLS regressions for movies in each emotional arc falling within each of the budget categories. Gross domestic revenue was used as a dependent variable and emotional clusters – as explanatory variables. summarizes our results. In one of the OLS regressions (captured in a penultimate row of ) we have checked the robustness of our results using worldwide revenue as a dependent variable. We conducted a series of OLS regressions instead of one multi-variable regression to avoid multiple variable problems as well as spurious correlation problems.
Table 5. Compound Effect of Emotional Arcs and Budgets.
Note that results presented in the table not only show that Man in a Hole is financially successful shape. It also clearly demonstrates that Man in a Hole movies are randomly distributed between different budget groups. If we observed Man in a Hole variable being statistically significant in all budget categories, this would suggest a bias in our dataset. If we observed Man in a Hole variable being statistically significant in some but not all budget categories, we would conclude that our results are driven by limited budget groups. Yet, the fact that Man in a Hole is not significant in individual budget groups but is highly significant overall is a sign that Man in a Hole movies are randomly allocated across considered budget groups, which increases the validity of our findings.
demonstrates that the Man in a Hole emotional arc produces higher revenue than any other arc; but this financial success is not due to movies falling within any particular budget category. Even though overall Riches to Rags is the least financially successful arc, movies in this cluster seem to generate statistically significantly high revenue when they are in a high budget category (over $100 million). This may explain the financial success of large historical drama productions such as The Last Samurai or survival epics like Life of Pi.
also shows that the Icarus type of movies tend to succeed when they are low to medium budget productions (i.e., productions of under $1 million and productions between over $5 and $10 million) and fail when they require large financial investment (movies with budgets between over $50 million and $100 million). The Table also reveals that Cinderella movies with budgets between over $1 million and $5 million as well as Oedipus motion pictures with budgets between over $30 million and $50 million tend to be less financially successful than movies in other categories.
5.3. Emotional arcs and genres
In the previous subsection we explored the impact of production budgets on movies’ financial revenues. Yet, other factors may influence movie success. One such factor is movie genre. In this subsection we investigate whether and how movie genres influence revenue. To that end, we look at the compound effects of movie genres and emotional arcs by conducting a series of OLS regressions with gross domestic revenue as a dependent variable and emotional arc clusters as explanatory variables for all combinations of genre and emotional arc in our sample. Results for the worldwide revenue are essentially the same. We report gross domestic revenue results to make use of our entire sample of 6,147 movies as worldwide revenue is only available for 3,051 movies in our dataset. Worldwide revenue results are available from the corresponding author upon request. Genre information is obtained from the movie description on the IMDb website which lists 22 possible genres: Action, Horror, Sci-Fi, Mystery, Thriller, Animation, Drama, Adventure, Fantasy, Crime, Comedy, Romance, Family, Biography, Sport, Music, War, Western, History, Musical, Film Noir, and News. It is important to note that most motion pictures which appear on the IMDb website are characterized by more than one genre. Our resulting dataset consisted of 1,201 Action movies; 564 Horror movies; 597 Sci-Fi movies; 594 Mystery movies; 1,726 Thrillers; 268 Animations; 3,757 Dramas; 961 Adventure movies; 644 Fantasy movies; 1,219 Crime movies; 2,403 Comedies; 1,710 Romance movies; 584 Family movies; 386 Biographies; 187 Sport-themed movies; 262 Music-related movies; 281 War-themed; 88 Westerns; 234 History movies; 170 Musicals; and 8 Film Noir movies. Even though News was listed on IMDb as a genre, there were no movies in that category. To make use of all the available information, we constructed dummies for all genres and then looked at the revenues of movies falling within each genre category separately. summarizes our results.
Table 6. Compound effect of movie genre and emotional arc on gross domestic revenue.
shows that for most genres, the Man in a Hole emotional arc produces high revenue and for Sci-Fi, Mystery, Thriller, Animation, Adventure, Fantasy, Comedy, and Family movies this result is statistically significant. Riches to Rags motion pictures succeed financially if they fall within Biography, Music, War, or History genres; yet fail if they are Sci-Fi motion pictures, Mysteries, or Thrillers.
Riches to Rags Horrors, Westerns and Thrillers tend to achieve high revenue while Riches to Rags Animations, Adventures, Comedies, Music-themed, and Historical movies tend to have low revenues. Icarus movies tend to generate low revenues irrespective of the genre with Icarus Animations, Fantasies, Comedies, and Family movies being especially low earning. Cinderella motion pictures tend to achieve high revenues as Comedies and Family movies but low revenues as Crime and War-themed movies. Finally, Oedipus motion pictures do well as Romance and Sport-themed movies but tend to fail as Thrillers and Crime-themed movies.
These results allow us to explore an extra dimension of the motion pictures success. Our findings show that while Rags to Riches, Riches to Rags, Cinderella, and Oedipus movies may produce different revenues dependent on the genre; Icarus motion pictures tend to be financially unsuccessful irrespective of the genre and Man in a Hole movies, on the contrary, tend to generate high revenues across the majority of genres. Clearly, there is some heterogeneity among emotional arcs - genres combinations revealing that, in principle, many emotional arcs (with the exception of Icarus) may be associated with financially successful movies. Yet, it is also clear that the Man in a Hole emotional arc tends to financially outperform other arcs in the majority of genre variations. We conduct a series of OLS regressions instead of one multi-variable regression to avoid multiple variable problems as well as spurious correlation problems. Please, note that due to the nature of the data (i.e. each movie is assigned more than one genre category by IMDb), each row contains different number of observations as explained above.
6. Discussion
Improving productivity in the entertainment industry is an extremely challenging task as the complexity of the creative domain often leads to suboptimal decisions by movie production teams who frequently aim to cut production costs rather than increase revenue through the improvement of the content creation (Vogel, Citation2001). This paper makes a number of theoretical, methodological, empirical and practical contributions.
Our main theoretical contribution is demonstrating that recent advances in data science allow us to better understand human emotions and use this knowledge to predict viewers' preferences more accurately. The analytics of this type allows to better fit produced content to consumer preferences, thereby increasing revenue of the motion picture production. We offer a new conceptual framework of how data science can contribute to the movie creation value chain and tests this framework using publicly available data.
Methodologically, we use data science natural language processing tools combined with econometric analysis to explore whether and to what extent emotions shape consumer preferences for media and entertainment content. We find that all analyzed emotional arcs from thousands of motion picture scripts can be partitioned into 6 major emotional trajectories: Rags to Riches, Riches to Rags, Man in a Hole, Icarus, Cinderella, and Oedipus. Previous research on emotional shapes in books (Reagan et al., Citation2016) obtained similar results and helped us formulate our theoretical hypotheses as successful movies are likely to be based on best-selling books.
Empirically, we find that one of the 6 trajectories – Man in a Hole – tends to be generally more financially successful than other emotional arcs. Furthermore, this relative success is apparent irrespective of the movie genre and does not depend on the movie production budget. If we assume that IMDb rating can be used as a proxy of viewer satisfaction, we can also conclude that the Man in a Hole emotional arc tends to succeed not because it generates movies which are most desired by the public (i.e., achieve the highest ratings on IMDb), but because movies with this emotional arc tend to be most unusual and spark debates. In other words, the Man in a Hole emotional arc tends to generate most “talked about” movies and not necessarily “most liked” movies and thereby achieve higher revenues than movies in other categories.
What are the practical implications of our result for the entertainment industry? On the one hand, it may appear that when evaluating movie scripts, motion picture production companies should opt for scripts offering Man in a Hole emotional journeys. Yet, on the other hand, this would be an oversimplification of our results. We show that when emotional arcs are combined with different genres and produced in different budget categories any of the 6 emotional arcs may produce financially successful films. Therefore, a careful selection of the script-budget-genre combination will lead to financial success, reduce the number of failures and improve productivity. It is obvious, however, that data science can significantly advance the dialog between motion picture production companies and the viewers and help generate “on demand”, customer-centric, and even personalized content which consumers of motion pictures would be interested in purchasing. The sentiment analysis of movies as an essential part of the business model choice process may shift decision making about desirable content from producers to consumers, empowering the viewers to significantly influence (or even shape) motion picture production.
It is worth noting, that we do not propose this approach as a replacement for human scriptwriters or producers. Rather, our approach represents a good example of a potential decision support system. To scriptwriters, our approach provides an opportunity to test their scripts for emotional arcs, which would give them a point of reference in their writing. To producers, our approach offers the solution to the growing issue of not being able to deal with the high volume of incoming movie scripts and the consequent pitfalls of human judgement. Using data science to support the selection of scripts can help to further diversify the motion picture offerings and potentially make unusual choices with hidden potential. Moreover, our approach provides quantifiable measures and attaches concrete figures to a context that so far is mostly reliant on subjective analysis and expert intuition.
Our findings demonstrate that data science can enhance revenue streams (and, thereby increase productivity) through future preference mapping. This approach is already starting to be confirmed by practice. Specifically if we compare the financial performance of companies which actively use data science for content creation (such as e.g. Netflix) with traditional motion picture studios such as Disney, 21th century Fox (in March 2019 Disney-Fox studios merged into one company), Warner Brothers, Universal, Sony/Columbia, Paramount and Lionsgate which have only recently started to use data science in their production strategy, we will observe an obvious advantage of data-driven content. For a detailed example of how 21st Century Fox uses data science in motion picture production, see https://cloud.google.com/blog/products/ai-machine-learning/how-20th-century-fox-uses-ml-to-predict-a-movie-audience. Specifically, according to Statista, the gross revenue of Netflix grew from $3,660 million in 2017 to $5,827 million in 2018 (a 59% increase). At the same time, the highest growth among traditional motion picture production studios was demonstrated by Disney, where revenues increased from $6,457.5 million in 2017 to $7,325 million in 2018 (a 13% increase). It is obvious that Netflix’s strategic decision to adopt data-driven content creation is a superior strategy to that adopted by the traditional companies (for more evidence and discussion, see https://www.forbes.com/sites/kristinwestcottgrant/2018/05/28/netflixs-data-driven-strategy-strengthens-lead-for-best-original-content-in-2018/#6a54cf483a94).
Our research suggests that (considering the high cost of the motion picture and creative content production) companies need to diversify their strategy by investing a portion of their budgets in content which is likely to perform well (e.g. Man in a Hole movies). Such “low risk” investments would allow these companies to also set aside a portion of their budget for risky experiments (e.g., art-house films). Netflix is an example of such an optimal strategic use of data science in creative content generation. In 2018, Alfonso Cuarón’s film “Roma” (produced by Netflix) received many international film festival prizes and 3 Academy Awards including Oscars for the Best Director, best Foreign Language Film and Best Cinematography. The example of Netflix shows how data-centric production strategy can be successfully implemented in practice combining mass-produced content for a large audience with art-house content for a limited audience.
This research has a number of limitations. First of all, all data used in this paper were collected from the publicly available sources. Second, we are using subtitles rather than actual scripts in our clustering analysis. Third, some of the movies for which we could not find subtitles were not included in our dataset. A much cleaner test of our econometric model would be to take historical data on scripts from a motion picture studio (such as Disney-Fox, Warner Brothers, etc.). We then would obtain clustering from that historical data and use actual new scripts (currently under consideration by the studio) to predict revenue. The revenue could then be assessed after the movies’ release against our prediction.
It is left to further research to trial our approach in a cleaner environment. Also, testing the robustness of our clusters using different clustering techniques would be an interesting endeavour for the future research. We anticipate that in the next few years better ways of assessing productivity in creative industries will be developed and tested empirically.
Hollywood is often called the Factory of Dreams. This paper shows that, in its essence, Hollywood is a Factory of Emotions yet, with the help of data science, it may become the Factory of Viewers’ Dreams.
Disclosure statement
All authors declare no conflict of interest. Marco Del Vecchio was working on this project while he studied at the University of Cambridge. The views and opinions expressed in this article are those of the authors and do not necessarily reflect the official policy or position of any agency, organization, employer or company.
Additional information
Funding
References
- Addis, M., & Holbrook, M. B. (2018). Is movie success a judgment device? When more is not better. Psychology & Marketing, 35(12), 881–890. doi:10.1002/mar.21141
- Agnani, B., & Aray, H. (2010). Subsidies and awards in movie production. Applied Economics Letters, 17(15), 1509–1511. doi:10.1080/13504850903035865
- Ahmed, U., Waqas, H., & Afzal, M. T. (2019). Pre-production box-office success quotient forecasting. Soft Computing. doi:10.1007/s00500-019-04303-w.
- Allahbakhsh, M., & Ignjatovic, A. (2015). An iterative method for calculating robust rating scores. IEEE Transactions on Parallel and Distributed Systems, 26(2), 340–350. doi:10.1109/TPDS.2013.215
- Amolochitis, E., Christou, I. T., & Tan, Z. H. Z.-H. (2014). Implementing a commercial-strength parallel hybrid movie recommendation engine. IEEE Intelligent Systems, 29(2), 92–96. doi:10.1109/MIS.2014.23
- Anand, S., Mittal, S., Tuzel, O., & Meer, P. (2014). Semi-supervised kernel mean shift clustering. IEEE Transactions on Pattern Analysis and Machine Intelligence, 36(6), 1201–1215. doi:10.1109/TPAMI.2013.190
- Anantha Natarajan, V., Sai Harsha, K., & Santhosh Kumar, M. (2019). Box-office revenue estimation for Telugu movie industry using predictive analytic techniques. International Journal of Recent Technology and Engineering, 7(6), 896–902.
- Antipov, E. A., & Pokryshevskaya, E. B. (2017). Are box office revenues equally unpredictable for all movies? Evidence from a Random forest-based model. Journal of Revenue and Pricing Management, 16(3), 295–307. doi:10.1057/s41272-016-0072-y
- Aristotle. (1902). The Poetics of Aristotle. London: Mcmillan, edited by S. H. Butcher (3rd ed.). Retrieved from https://www.stmarys-ca.edu/sites/default/files/attachments/files/Poetics.pdf
- Bae, G., & Kim, H.-J. (2019). The impact of movie titles on box office success. Journal of Business Research, 103, 100–109. doi:10.1016/j.jbusres.2019.06.023
- Baek, H., Oh, S., Yang, H.-D. H. D., & Ahn, J. H. (2017). Electronic word-of-mouth, box office revenue and social media. Electronic Commerce Research and Applications, 22, 13–23. doi:10.1016/j.elerap.2017.02.001
- Bharadwaj, N., Noble, C. H., Tower, A., Smith, L. M., & Dong, Y. (2017). Predicting innovation success in the motion picture industry: The influence of multiple quality signals. Journal of Product Innovation Management, 34(5), 659–680. doi:10.1111/jpim.12404
- Boix-Domenech, R., & Soler-Marco, V. (2017). Creative service industries and regional productivity. Papers in Regional Science, 96(2), 261–279. doi:10.1111/pirs.12187
- Bouguettaya, A., Yu, Q., Liu, X., Zhou, X., & Song, A. (2015). Efficient agglomerative hierarchical clustering. Expert Systems with Applications, 42(5), 2785–2797. doi:10.1016/j.eswa.2014.09.054
- Brighton, R., Gibbon, C., Brown, S., & Luanaigh, A. N. (2016). Understanding the future of productivity in the creative industries. London: SQW Limited.
- Carrillat, F. A., Legoux, R., & Hadida, A. L. (2018). Debates and assumptions about motion picture performance: A meta-analysis. Journal of the Academy of Marketing Science, 46(2), 273–299. doi:10.1007/s11747-017-0561-6
- Carroll Harris, L. (2018). Film distribution as policy: Current standards and alternatives. International Journal of Cultural Policy, 24(2), 236–255. doi:10.1080/10286632.2016.1156100
- Cerneviciute, J., & Strazdas, R. (2018). Teamwork management in creative industries: Factors influencing productivity. Entrepreneurship and Sustainability Issues, 6(2), 503–516. doi:10.9770/jesi.2018.6.2(3)
- Chen, X., Chen, Y., & Weinberg, C. B. (2013). Learning about movies: The impact of movie release types on the nationwide box office. Journal of Cultural Economics, 37(3), 359–386. doi:10.1007/s10824-012-9189-z
- Cheng, L. C. L.-C., & Huang, C. L. C.-L. (2019). Exploring contextual factors from consumer reviews affecting movie sales: An opinion mining approach. Electronic Commerce Research. (0123456789), 1–26. doi:10.1007/s10660-019-09332-z
- Chew, W. B. (1988). No-nonsense guide to measuring productivity. Harvard Business Review, 66(1), 110–118.
- Chu, E., & Roy, D. (2017). Audio-visual sentiment analysis for learning emotional arcs in movies. 2017 IEEE International Conference on Data Mining (ICDM) Conference Paper, pp. 829–834. doi:10.1109/ICDM.2017.100
- Court, D., Gillen, B., McKenzie, J., & Plott, C. R. (2018). Two information aggregation mechanisms for predicting the opening weekend box office revenues of films: Boxoffice Prophecy and Guess of Guesses. Economic Theory, 65(1), 25–54. doi:10.1007/s00199-017-1036-1
- Dalton, J. T., & Leung, T. C. (2017). Strategic decision-making in Hollywood release gaps. Journal of International Economics, 105, 10–21. doi:10.1016/j.jinteco.2016.11.003
- Das, B., & Chakraborty, S. (2018). An improved text sentiment classification model using TF-IDF and next word negation. arXiv preprint arXiv:1806.06407.
- De Pater, I. E., Judge, T. A., & Scott, B. A. (2014). Age, gender, and compensation: A study of hollywood movie stars. Journal of Management Inquiry, 23(4), 407–420. doi:10.1177/1056492613519861
- De Vany, A., & Walls, W. D. (2002). Does hollywood make too many R-Rated Movies? Risk, stochastic dominance, and the illusion of expectation. The Journal of Business, 75(3), 425–451. doi:10.1086/339890
- Ding, C., Cheng, H. K., Duan, Y., & Jin, Y. (2017). The power of the “like” button: The impact of social media on box office. Decision Support Systems, 94, 77–84. doi:10.1016/j.dss.2016.11.002
- Duan, L., Xu, L., Guo, F., Lee, J., & Yan, B. (2007). A local-density based spatial clustering algorithm with noise. Information Systems, 32(7), 978–986. doi:10.1016/j.is.2006.10.006
- Eliashberg, J., Elberse, A., & Leenders, M. A. (2006). The motion picture industry: Critical issues in practice, current research, and new research directions. Marketing Science, 25(6), 638–661. doi:10.1287/mksc.1050.0177
- Eyben, F., Weninger, F., Squartini, S., & Schuller, B. (2013, May). Real-life voice activity detection with LSTM recurrent neural networks and an application to hollywood movies. In 2013 IEEE International Conference on Acoustics, Speech and Signal Processing, Vancouver, BC, Canada. 483–487. IEEE. doi:10.1109/ICASSP.2013.6637694
- Fahmi, F. Z., & Koster, S. (2017). Creative industries and regional productivity growth in the developing economy: Evidence from Indonesia. Growth and Change, 48(4), 805–830. doi:10.1111/grow.12212
- Feng, G. C. (2019). A comparative study of the online film ratings of US and Chinese audiences: An analytical approach based on big data. International Communication Gazette, 81(3), 283–302. doi:10.1177/1748048518767799
- Fernandes, A. B. (2018). The entrapment of art: Rock-art, order, subversion, creativity, meaning, and the appeal of illusive imagery. Open Archaeology, 4(1), 280–298. doi:10.1515/opar-2018-0017
- Ferraz de Arruda, H., Nascimento Silva, H. F., Queiroz Marinho, V., Amancio, D. R., & da Fontoura Costa, L. (2018). Representation of Texts as complex networks: A Mesoscopic Approach. Journal of Complex Networks, 6(1), 125–144. doi:10.1093/comnet/cnx023
- Gaenssle, S., Budzinski, O., & Astakhova, D. (2019). Conquering the box office: Factors influencing success of international movies in Russia. Review of Network Economics, 17(4), 245–266. doi:10.1515/rne-2019-0017
- Garcia-del-Barrio, P., & Zarco, H. (2017). Do movie contents influence box-office revenues? Applied Economics, 49(17), 1679–1688. doi:10.1080/00036846.2016.1223828
- Goff, B., Wilson, D., & Zimmer, D. (2017). Movies, mass consumers, and critics: Economics and politics of a two-sided market. Contemporary Economic Policy, 35(2), 269–277. doi:10.1111/coep.12180
- Green, S. J., Grorud-Colvert, K., Mannix, H., & Shanahan, M.-C. (2018). Uniting Science and Stories: Perspectives on the Value of Storytelling for Communicating Science. FACETS, 3(1), 164–173. doi:10.1139/facets-2016-0079
- Grubert, E., & Algee-Hewitt, M. (2017). Villainous or valiant? Depictions of oil and coal in American fiction and nonfiction narratives. Energy Research & Social Science, 31, 100–110. doi:10.1016/j.erss.2017.05.030
- Hong, J., Yu, W., Guo, X., & Zhao, D. (2014). Creative industries agglomeration, regional innovation and productivity growth in China. Chinese Geographical Science, 24(2), 258–268. doi:10.1007/s11769-013-0617-6
- Hornidge, A.-K. (2011). Creative industries: Economic programme and boundary concept. Journal of Southeast Asian Studies, 42(2), 253–279. doi:10.1017/S002246341100004X
- Hossein, N., & Miller, D. W. (2018). Predicting motion picture box office performance using temporal tweet patterns. International Journal of Intelligent Computing and Cybernetics, 11(1), 64–80. doi:10.1108/IJICC-04-2017-0033
- Hu, Y.-H., Shiau, W.-M., Shih, S.-P., & Chen, C.-J. (2018). Considering online consumer reviews to predict movie box-office performance between the years 2009 and 2014 in the US. The Electronic Library, 36(6), 1010–1026. doi:10.1108/EL-02-2018-0040
- Huang, D., Markovitch, D. G., & Strijnev, A. (2015). Exploring the small movie profitability puzzle. Marketing Letters, 26(1), 43–55. doi:10.1007/s11002-013-9266-x
- Hur, M., Kang, P., & Cho, S. (2016). Box-office forecasting based on sentiments of movie reviews and Independent subspace method. Information Sciences, 372, 608–624. doi:10.1016/j.ins.2016.08.027
- Hwang, Y., Kim, K., Kwon, O., Moon, I., Shin, G., Ham, J., & Park, J. (2017). Analyzing box-office hit factors using big data: Focusing on Korean films for the last 5 years. Journal of Information and Communication Convergence Engineering, 15(4), 217–226.
- Hwangbo, H., & Kim, J. (2019). A text mining approach for sustainable performance in the film industry. Sustainability (Switzerland), 11(11), 3207. doi:10.3390/su11113207
- Irjayanti, M., & Azis, A. M. (2017). Implementing technology in creative industry (Benchmarking study in developed countries). Advanced Science Letters, 23(9), 8113–8118. doi:10.1166/asl.2017.9845
- Jain, V. (2013). Prediction of movie success using sentiment analysis of tweets. International Conference on Soft Computing and Software Engineering 2013, 3(3), 308–313.
- Jockel, S., & Dobler, T. (2006). The event movie: Marketing filmed entertainment for transnational media corporations. The International Journal on Media Management, 8(2), 84–91. doi:10.1207/s14241250ijmm0802_4
- Joshi, A. (2015). Movie stars and the volatility of movie revenues. Journal of Media Economics, 28(4), 246–267. doi:10.1080/08997764.2015.1094079
- Kim, K., Yoon, S., & Choi, Y. K. (2019). The effects of eWOM volume and valence on product sales–an empirical examination of the movie industry. International Journal of Advertising, 38(3), 471–488. doi:10.1080/02650487.2018.1535225
- Kim, Y., Kang, M., & Jeong, S. R. (2018). Text mining and sentiment analysis for predicting box office success. KSII Transactions on Internet and Information Systems, 12(8), 4090–4102.
- Lash, M. T., & Zhao, K. (2016). Early predictions of movie success: The who, what, and when of profitability. Journal of Management Information Systems, 33(3), 874–903. doi:10.1080/07421222.2016.1243969
- Leaver, A. (2010). A different take: Hollywood’s unresolved business model. Review of International Political Economy, 17(3), 454–480. doi:10.1080/09692290903260249
- Lee, C., Xu, X., & Lin, C.-C. (2019). Using online user-generated reviews to predict offline box-office sales and online DVD store sales in the O2O era. Journal of Theoretical and Applied Electronic Commerce Research, 14(1), 0–83. doi:10.4067/S0718-18762019000100106
- Lee, H.-K. (2017). The political economy of ‘creative industries. Media, Culture and Society, 39(7), 1078–1088. doi:10.1177/0163443717692739
- Lee, J. H., Jung, S. H., & Park, J. H. (2017). The role of entropy of review text sentiments on online WOM and movie box office sales. Electronic Commerce Research and Applications, 22, 42–52. doi:10.1016/j.elerap.2017.03.001
- Lee, K., Park, J., Kim, I., & Choi, Y. (2018). Predicting movie success with machine learning techniques: Ways to improve accuracy. Information Systems Frontiers, 20(3), 577–588. doi:10.1007/s10796-016-9689-z
- Lee, N. (2014). The creative industries and urban economic growth in the UK. Environment and Planning A: Economy and Space, 46(2), 455–470. doi:10.1068/a4472
- Lee, S.-H., Lee, L.-S., & Hwang, H.-S. (2017). Does social opinion influence movie ticket revenues?: A case study. Advanced Science Letters, 23(3), 1627–1630. doi:10.1166/asl.2017.8616
- Liu, L., Wang, Y., Sinatra, R., Giles, C. L., Song, C., & Wang, D. (2018). Hot streaks in artistic, cultural, and scientific careers. Nature, 559(7714), 396–399. doi:10.1038/s41586-018-0315-8
- Lommerse, M., Eggleston, R., & Brankovic, K. (2011). Designing futures: A model for innovation, growth and sustainability of the craft and design industry. Design Principles and Practices: An International Journal—Annual Review, 5(4), 385–404. doi:10.18848/1833-1874/CGP/v05i04/38136
- Lu, W., & Xing, R. (2019). Research on movie box office prediction model with conjoint analysis. International Journal of Information Systems and Supply Chain Management, 12(3), 72–84. doi:10.4018/IJISSCM.2019070104
- Lyu, X., Jiang, C., Ding, Y., Wang, Z., & Liu, Y. (2019). Sales prediction by integrating the heat and sentiments of product dimensions. Sustainability (Switzerland), 11(3), 913. doi:10.3390/su11030913
- Ma, H., Kim, J. M., & Lee, E. (2019). Analyzing dynamic review manipulation and its impact on movie box office revenue. Electronic Commerce Research and Applications, 35, 100840. (September 2018), doi:10.1016/j.elerap.2019.100840
- Mak, K. M., & Choo, W. C. (2018). Forecasting movie demand using total and split exponential smoothing. Jurnal Ekonomi Malaysia, 52(2), 81–94.
- Marburger, D. R. (1997). Optimal ticket pricing for performance goods. Managerial and Decision Economics, 18(5), 375–381. doi:10.1002/(SICI)1099-1468(199708)18:5<375::AID-MDE833>3.0.CO;2-3
- Masih, S., & Ihsan, I. (2019). Using academy awards to predict success of bollywood movies using machine learning algorithms. International Journal of Advanced Computer Science and Applications, 10(2), 438–446. doi:10.14569/IJACSA.2019.0100257
- Maugis, C., Celeux, G., & Martin‐Magniette, M. L. (2009). Variable selection for clustering with Gaussian mixture models. Biometrics, 65(3), 701–709. doi:10.1111/j.1541-0420.2008.01160.x
- McMahon, J. (2019). Is Hollywood a risky business? A political economic analysis of risk and creativity. New Political Economy, 24(4), 487–509. doi:10.1080/13563467.2018.1460338
- Mohanty, S., Clements, N., & Gupta, V. (2018). Investigating the effect of eWOM in movie box office success through an aspect-based approach. International Journal of Business Analytics, 5(1), 1–15. doi:10.4018/IJBAN.2018010101
- Nemzer, L. R., & Neymotin, F. (2019). How words matter: Machine learning & movie success. Applied Economics Letters, doi:10.1080/13504851.2019.1676868
- Ng, I. C. (2014). Creating new markets in the digital economy. Cambridge: Cambridge University Press.
- Nic Theo, L. J. (2016). Considerations on conceptual frameworks for writing liminality into popular film. Journal of Screenwriting, 7(2), 155–172. doi:10.1386/josc.7.2.155_1
- Oh, C., Roumani, Y., Nwankpa, J. K., & Hu, H.-F. H. F. (2017). Beyond likes and tweets: Consumer engagement behavior and movie box office in social media. Information & Management, 54(1), 25–37. doi:10.1016/j.im.2016.03.004
- Oh, Y.-K. (2017). The impact of initial eWOM growth on the sales in movie distribution. Journal of Distribution Science, 15(9), 85–93.
- Oliver, J. J. (2017). Exploring industry level capabilities in the U.K. creative industries. Creative Industries Journal, 10(1), 75–88. doi:10.1080/17510694.2017.1282302
- Park, S., & Kim, T. (2017). Forecasting audience of motion pictures considering competitive environment. Journal of Theoretical and Applied Information Technology, 95(18), 4340–4348.
- Park, Y.-S., & Ham, S. (2016). Spatial analysis of various multiplex cinema types. Frontiers of Architectural Research, 5(1), 63–73. doi:10.1016/j.foar.2015.11.001
- Peltzman, D. (2012). The impact of runaway productions on Hollywood labor organizations. InMedia. The French Journal of Media Studies, (1). https://journals.openedition.org/inmedia/123.
- Piergiovanni, R., Carree, M. A., & Santarelli, E. (2012). Creative industries, new business formation, and regional economic growth. Small Business Economics, 39(3), 539–560. doi:10.1007/s11187-011-9329-4
- Pokorny, M., Miskell, P., & Sedgwick, J. (2019). Managing uncertainty in creative industries: Film sequels and Hollywood’s profitability, 1988–2015. Competition & Change, 23(1), 23–46. doi:10.1177/1024529418797302
- Purnomo, B. R., & Kristiansen, S. (2018). Economic reasoning and creative industries progress. Creative Industries Journal, 11(1), 3–21. doi:10.1080/17510694.2017.1403206
- Purse, L. (2007). Digital heroes in contemporary Hollywood: Exertion, identification, and the virtual action body. Film Criticism, 32(1), 5.
- Rajput, P., Computer Science Department, University of California, Los Angeles (UCLA), United States, Sapkal, P., & Sinha, S. (2017). Box office revenue prediction using dual sentiment analysis. International Journal of Machine Learning and Computing, 7(4), 72–75. doi:10.18178/ijmlc.2017.7.4.623
- Reagan, A. J., Mitchell, L., Kiley, D., Danforth, C. M., & Dodds, P. S. (2016). The emotional arcs of stories are dominated by six basic shapes. EPJ Data Science, 5(1), 31–43. doi:10.1140/epjds/s13688-016-0093-1
- Ru, Y., Li, B., Liu, J., & Chai, J. (2018). An effective daily box office prediction model based on deep neural networks. Cognitive Systems Research, 52, 182–191. doi:10.1016/j.cogsys.2018.06.018
- Skilton, M., & Hovsepian, F. (2017). The 4th industrial revolution: Responding to the impact of artificial intelligence on business. London: Springer.
- Smith, A. D. (2011). Shrinking-release window movie releases: Potential impacts on best business practices. International Journal of Services and Operations Management, 8(1), 1–26. doi:10.1504/IJSOM.2011.037438
- Somlo, B., Rajaram, K., & Ahmadi, R. (2011). Distribution planning to optimize profits in the motion picture industry. Production and Operations Management, 20(4), 618–636. doi:10.1111/j.1937-5956.2010.01166.x
- Steinley, D. (2006). K‐means clustering: A half‐century synthesis. British Journal of Mathematical and Statistical Psychology, 59(1), 1–34. doi:10.1348/000711005X48266
- Sudarwati, W., Prasetyawati, M., & Ramadhan, A. I. (2018). Development strategy of competitive health of the beginning industry through management of value added and non value added activity. International Journal of Scientific and Technology Research, 7(5), 178–182.
- Tao, J., Ho, C.-Y., Luo, S., & Sheng, Y. (2019). Agglomeration economies in creative industries. Regional Science and Urban Economics, 77, 141–154. doi:10.1016/j.regsciurbeco.2019.04.002
- Vanitha, V., Sumathi, V. P., & Soundariya, V. (2019). An exploratory data analysis of movie review dataset. International Journal of Recent Technology and Engineering, 7(4), 380–384.
- Ventura, M., Saulo, H., Leiva, V., & Monsueto, S. (2019). Log-symmetric regression models: Information criteria and application to movie business and industry data with economic implications. Applied Stochastic Models in Business and Industry, 35(4), 963–977. doi:10.1002/asmb.2433
- Vogel, H. L. (2001). Entertainment industry economics. Cambridge; New York: Cambridge University Press.
- Vonnegut, K. (1981). Palm Sunday. New York: Rosetta Books LLC.
- Wallin, Z. (2019). Pictures seem to run in cycles”: Industry discourse and the economics of film cycles in classical Hollywood. Film History: An International Journal, 31(1), 81–101. doi:10.2979/filmhistory.31.1.0081
- Walls, W.D., & McKenzie, J. (2019). Black swan models for the entertainment industry with an application to the movie business. Empirical Economics. doi:10.1007/s00181-019-01753-x
- Walls, W. D. (2009). Screen wars, star wars, and sequels. Empirical Economics, 37(2), 447–461. doi:10.1007/s00181-008-0240-z
- Wang, G., & Shin, S. Y. (2019). An improved text classification method for sentiment classification. Journal of Information and Communication Convergence Engineering, 17(1), 41–48.
- Wang, Y., Ru, Y., & Chai, J. (2019). Time series clustering based on sparse subspace clustering algorithm and its application to daily box-office data analysis. Neural Computing and Applications, 31(9), 4809–4818. doi:10.1007/s00521-018-3731-7
- World Economic Forum. (2017). Accelerating workforce reskilling for the fourth industrial revolution: An agenda for leaders to shape the future of education, gender and work. Geneva, Switzerland: World Economic Forum.
- Xiao, J., Li, X., Chen, S., Zhao, X., & Xu, M. (2017). An inside look into the complexity of box-office revenue prediction in China. International Journal of Distributed Sensor Networks, 13(1), 155014771668484. doi:10.1177/1550147716684842
- Xu, Y., Tang, Q., Hou, L., & Li, M. (2018). Decision model for market of performing arts with factorization machine. Journal of Shanghai Jiaotong University (Science), 23(1), 74–84. doi:10.1007/s12204-018-1912-2
- Zhang, X.-J., Tang, Y., Xiong, J., Wang, W.-J., & Zhang, Y.-C. (2019). How network topologies impact project alliance performance: Evidence from the movie industry. Entropy, 21(9), 859. doi:10.3390/e21090859
- Zhou, Y., Zhang, L., & Yi, Z. (2019). Predicting movie box-office revenues using deep neural networks. Neural Computing and Applications, 31(6), 1855–1865. doi:10.1007/s00521-017-3162-x
Appendix
Table A. Structured literature review on data science research for movie industry: a summary.