
 ?Mathematical formulae have been encoded as MathML and are displayed in this HTML version using MathJax in order to improve their display. Uncheck the box to turn MathJax off. This feature requires Javascript. Click on a formula to zoom.
Abstract
For several decades structural modelling has assisted decision makers with the cognitive burden of exploring and interpreting complex situations. Three well-known techniques – labelled collectively here as semi-quantitative problem structuring and modelling (SPSM) – include ISM (Interpretive Structural Modelling); MICMAC (Matrice d’Impacts Croisés-Multiplication Appliquée à un Classement); and DEMATEL (DEcision MAking Trial and Evaluation Laboratory). SPSM approaches pioneered the joint application of graph-theoretical principles and human-computer interaction. Yet today a template-style research approach prevails, focusing on the application context rather than seeking to advance or critically assess the individual techniques in their own right. This paper develops a unifying methodological view of SPSM, currently missing in the literature, by comparing and contrasting – for each technique – analytical and procedural aspects typically taken for granted. The paper’s findings highlight: (1) Previously unnoticed overlaps between techniques that up to now have been deemed mutually exclusive, and incongruences between those that are often applied jointly; 2) Potential issues that arise when key analytical principles of SPSM are either applied uncritically or dispensed with altogether; 3) The need to leverage human-computer interaction, a prominent aspect in early SPSM research that is now surprisingly neglected. These findings are illustrated by a review of SPSM applications in the context of supply chain risk management.
1. Introduction
Complexity is back in the headlines due to the societal problems and global disruption associated with the COVID-19 pandemic. But the need to make sense of complex challenges, and deal with them effectively, has been a recurring problem for managers for decades (e.g. Sargut & McGrath, Citation2011), and decision makers have long been advised to use a system lens to deal with the complexity of interacting societal problems (e.g. Warfield, Citation1976; WEF, Citation2013). It is an open debate, however, what level of mathematical formalism is appropriate for imparting structure on systems that are complex and poorly understood. To apply the methods of Management Science and Operations Research (MS/OR), the problems need to be clearly identified so that a shared understanding is possible. In the 1970s and 1980s the MS/OR community was deeply divided on whether its methods could really help address ill-structured, interdependent problems on which consensus was often lacking (Ackoff, Citation1974; Jackson, Citation2006; Simon et al., Citation1987).
A ‘soft’ OR view on this debate would be to dismiss problem solving and mathematical modelling in favour of problem structuring methods (PSM), underpinned by social theories other than positivism (Jackson, Citation2006; Citation2019). The argument is that formalised mathematical tools inevitably enforce a unitary view – a single right answer – on what makes up the system of interest, how its constituent elements are structured within the whole, and the nature of their interaction (Flood, Citation1988). Yet at the same time – despite some claims that it is in decline as a methodological framework – PSM is also commensurate with ‘hard’ OR, and certainly not exclusive of that approach a priori (Harwood, Citation2019). What is clear is that the methodological rigour and credibility of soft OR is still under debate, as is the scope to include software-based analytical routines in a soft OR approach (Ackermann, Citation2019; Ackermann et al., Citation2020).
Structural modelling adopts a hybrid stance between soft and hard OR, using a family of techniques that leverage both graph-theoretical principles and human-computer interaction. These tools help experienced practitioners with the cognitive burden of structuring and interpreting contextual situations in terms of a system (Lendaris, Citation1980). Under this approach qualitative data elicited from experts is often processed analytically, outcomes are visualised and then interactively played back to them for feedback.
The focus of this paper is a specific subset of structural modelling techniques, labelled collectively here as ‘semi-quantitative problem structuring and modelling’ (SPSM). SPSM includes the following techniques, which are specifically assessed in this paper: Equation(1)(1)
(1) Interpretive Structural Modelling – ISM; 2) Matrix-based cross-impact categorisation or Matrice d’Impacts Croisés-Multiplication Appliquée à un Classement – MICMAC; and 3) Structural analysis of the world ‘problematique’, developed within the Decision Making Trial and Evaluation Laboratory project – commonly referred to as DEMATEL. identifies foundational work for each technique.
Table 1. Subset of foundational works for selected techniques.
These three techniques originated in the 1970s – independently, but around the same time – and now represent a staple element of numerous business and management applications. It seemed appropriate to focus on these well-established techniques with a view to calling into question the commonly held assumption that they differ fundamentally – an assumption that has been used to justify separate research strands for each technique.
The early foundational works on SPSM share a ‘soft OR’ view: that a purely objectivist notion of problem solving has limitations, and could benefit from the application of social theories such as structuralism and interpretivism (Jackson, Citation2006). Unlike soft OR, however, the early SPSM work aimed to find synergies between natural language and the language of mathematics and graphs, consistent with a broader notion of systems science (Warfield, Citation2003). Indeed, ordinary prose is regarded in this early work as a ‘Procrustean bed’ – a scheme or pattern into which something is arbitrarily forced to fit – and hence is unsuitable to replace rational analysis in portraying problem situations (Warfield & Staley, Citation1996).
In recent years more publications have focused on specific managerial application contexts, rather than advancing or critically assessing individual SPSM techniques upfront. Providing a comprehensive literature review across all SPSM techniques is beyond the scope of this paper, but it can easily be ascertained from a quick assessment of the academic literature that a template-style approach to SPSM research is prevalent. The literature on SPSM reveals a tendency to trivialise, or even dispense with, the computational and procedural aspects of SPSM, which thus remain largely unappreciated and underplayed. It is also apparent that over the past two decades SPSM applications have mutated into ‘shortcut’ surrogates for survey research; thereby losing much of its original intent – to support challenging managerial decisions in the face of complexity. The literature on SPSM often confuses it with, or regards it as ancillary to, multi-criteria decision analysis – MCDA (e.g. Gölcük & Baykasoğlu, Citation2016; Mandic et al., Citation2015). These trends in the academic literature seem contrary to the methodological principles of SPSM, but the rigour and credibility of published research insights is rarely called into question.
Against this background, this paper’s contribution is methodological in nature, and has two aims. Equation(1)(1)
(1) To develop a unified analytical view on SPSM by comparing and contrasting procedural and algebraic features, across various SPSM techniques, that are currently underplayed. Equation(2)
(2)
(2) To enable a clearer positioning of individual SPSM techniques and their applicability in supporting challenging managerial decisions, as intended by the foundational SPSM literature. These aims are achieved by addressing the following research questions:
RQ1: What methodological building blocks justify separate SPSM research strands?
RQ2: How transparent and consistent is the implementation of these building blocks?
To ensure a reasonable scope, RQ2 is addressed by reviewing a subset of SPSM applications in the area of supply chain risk management (SCRM), which turns out to provide an ideal context for the application of SPSM. Supply chain risk management has gained renewed attention from the general public in the wake of the COVID-19 pandemic. Furthermore its focus has evolved from simply listing adverse events that organisations need to worry about (e.g. Olson & Wu, Citation2010), to addressing many of the complexities that arise from risk interdependency (WEF, Citation2018).
The remainder of this article is set out as follows. Section 2 compares and contrasts selected individual techniques analytically, and proposes a unifying methodological perspective on SPSM. Section 3 reviews selected applications in SCRM, illustrating key insights from the proposed unifying view with evidence from the extant literature. Findings are then discussed in Section 4, which elaborates on some theoretical as well as practical implications of the analysis. The closing section summarises the contribution and limitations of this research.
2. Comparative assessment of SPSM techniques
In this section we elevate the methodological building blocks of SPSM, with a view to identifying shared computational principles and procedures. These building blocks include a) contextual relationships; b) characteristic equations; c) visual analytics and d) expert engagement.
It is a common requirement across the selected techniques to elicit expert judgment about Equation(1)(1)
(1) the constituent elements of a problem situation (henceforth just ‘elements’), and Equation(2)
(2)
(2) the contextual relationships – perceived or factual – between these elements. These contextual relationships are specified by expert respondents in the form of a ‘structural analysis matrix’ (Godet, Citation1986) or, equivalently, a ‘relational map’ (Warfield, Citation1982). Regardless of the specific technique used, the structural analysis matrix and relational map thus obtained are further processed as a single mathematical object: a directed graph (digraph). Inevitably, the following comparative analysis refers to well-established principles of graph theory and matrix algebra.
2.1. Semi-quantitative contextual relationships
In SPSM a complex problem situation is typically broken down into relevant constituent elements. Popular categories include barriers, enablers, or success factors in the adoption of technologies (e.g. Chaudhary & Suri, Citation2021; Rajesh, Citation2017) and managerial practices (e.g. Dasaklis & Pappis, Citation2018; Sen et al., Citation2018). Problem elements may also resemble generic ‘variables’ e.g. epidemiological features at play in a pandemic (e.g. Lakshmi Priyadarsini & Suresh, Citation2020); suppliers features (e.g. Mohammed, Citation2020); or individual risks affecting a supply chain (e.g. Ali et al., Citation2019).
The choice of problem elements (barriers, enablers etc.) does not affect how a given SPSM technique works. Yet choosing a relationship statement that is contextually significant for the inquiry can have major analytical repercussions (Malone, Citation1975). Commonly employed contextual relationships include Equation(1)(1)
(1) influence (e.g. “A helps to achieve/leads to B”), and Equation(2)
(2)
(2) comparison (e.g. “A is more relevant than B”). The first kind of relationship generates intent structures, but the second generates priority structures (Warfield, Citation1982). For example, given a comparative relationship about age, it is unnecessary to evaluate whether “A is as old as B” if this can be inferred from “A is twice the age of C”, and “C is half the age of B” – an example of consistency. By asymmetry, one also infers automatically that e.g. “it is not the case that B is older than A”. Comparative relationships are sporadically assessed in SPSM applications (Janes, Citation1988; Malone, Citation1975) but are prevalent in the context of MCDA, where they are leveraged to attain greater parsimony and reduce the cognitive burden for the decision maker. Examples include improvements in MCDA techniques such as the Analytical Hierarchy Process (AHP) – e.g. Abastante et al. (Citation2018). In the case of SPSM, where relationships of influence prevail, there are fewer opportunities for automated inference as one cannot assume a priori properties such as consistency and symmetry.
By specifying a set of contextual relationships, the problem elements identified within the relevant situational context are weaved together into a digraph, whose adjacency matrix enables further computations. The adjacency matrix of a digraph with vertices is a matrix of size
denoted here as
with generic entry
if there is an edge from node
to node
and
otherwise (Deo, Citation1974: Ch. 9). In the context of SPSM,
will typically mean that, in the respondent’s opinion, problem element
exerts a direct influence on problem element
Often, a subjective evaluation of the strength of the relationships identified is also required. This process generates a scoring matrix – also of size
– whose entry
is either zero or some value on a given scale. When scores are expressed on a semi-numerical scale, they can be ordered, but no specific quantity is associated with the difference between consecutive values (Multon & Coleman, Citation2010).
From now on, the term ‘structural analysis matrix’ is used interchangeably for the scoring matrix and the adjacency matrix
as these are related. Knowing
the corresponding entries in the adjacency matrix can be obtained:
(1)
(1)
Unlike survey research, in SPSM there is no standard approach to filling a scoring matrix Even within a given technique the adopted scales vary – examples include DEMATEL (e.g. Fontela & Gabus, Citation1974b; Hsieh et al., Citation2016); MICMAC (e.g. Godet, Citation1986, Citation2007); and ISM (e.g. Gothwal & Raj, Citation2017; Warfield, Citation1982). One could argue that the algebraic analysis of subjective semi-numerical values generates numerical outcomes ex nihilo – out of thin air. Yet SPSM emphasises the topological information conveyed, rather than the numerical values per se. Some challenges of combining linguistic and numerical elements are addressed, through fuzzy set theoretic methods, in each SPSM technique (e.g. Ragade, Citation1976, Villacorta et al., Citation2014; Wu et al., Citation2017).
2.2. Comparative algebraic insights
It is a normative assumption that ISM, MICMAC and DEMATEL differ fundamentally in their computations, thus justifying separate strands of research for each (e.g. Gardas et al., Citation2019). In this section we argue against this commonly held view using analytical insights. To ease the comparison, and summarise the key equations for each technique, with Supplementary Materials S1 providing an illustrative example.
Figure 1. Schematic summary of key computational aspects and visualisation outputs for selected structural modelling techniques (see Supplementary Materials S1 for the detailed numerical example).
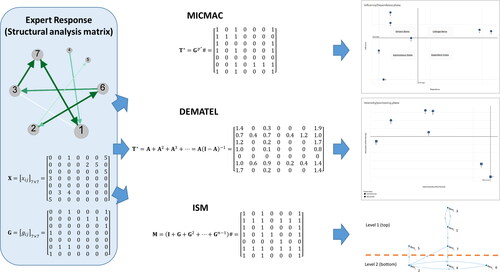
Table 2. Synoptic table of key matrix-based metrics underpinning foundational works on MICMAC, DEMATEL and ISM.
The equations highlighted in and have a common aim: to generate insights beyond the contextual relationships elicited from experts, which would be difficult to grasp without analytical support (Bolaños et al., Citation2005). The below comparison further investigates how specific techniques attain this shared aim.
2.2.1. Consecutive matrix powers: MICMAC
A key algebraic device for revealing higher-order interactions in the context of SPSM is to raise a structural analysis matrix to consecutive powers. Techniques such as MICMAC exploit this fact to rank individual problem elements based on the sum totals obtained along the corresponding rows and columns of a powered matrix. The underpinning assumption is that these powers converge to some stable value that can be used to obtain such a ranking (Duperrin & Godet, Citation1973; Godet, Citation1977, Citation1986, Citation2007).
The key intuition beneath this approach is a well-known result in graph theory – namely, the matrix obtained by raising an adjacency matrix to some integer power
(2)
(2)
has a generic entry
that corresponds to the number of different paths of length
originating in node
and terminating in node
of the corresponding digraph (Deo, Citation1974: p. 161). When applied in the context of MICMAC, EquationEquation 2
(2)
(2) measures the importance of a given problem element by the existence, number and length of the paths that link such an element with the others. Metrics of influence for each problem element are given by the row-sum vector
and metrics of dependence by the column-sum vector
(where
denotes a unity vector of appropriate dimensions, and
its transpose). If combined, these values provide coordinates for visualising the problem elements as a scatterplot on an “influence/dependence” Cartesian plane.
Yet the MICMAC approach just described has some shortcomings, which are rarely noticed. First, it is assumed without proof that there is a value producing a matrix
such that the ranking of the entries in
and
remain stable across consecutive iterations – e.g. Godet (Citation1986, Citation1977: p.73). Second, it is not always clear if the computations apply to a binary or to a semi-numerical matrix.
Recent work, even if methodology-oriented, rarely acknowledges these limitations (e.g. Hachicha & Elmsalmi, Citation2014; Manzano-Solís et al., Citation2019; Villacorta et al., Citation2014; Zhao et al., Citation2020). Exceptions include Georgantzas and Hessel (Citation1995), who point out that, depending on the presence of cyclical paths in the underlying digraph, the matrix powers in EquationEquation 2(2)
(2) may vanish rather than settle. Saaty (Citation2010: Ch. 5) addresses a similar issue, although in the adjacent context of MCDA. Yet these insights have rarely led to the introduction of additional checks and balances in MICMAC research.
2.2.2. Series of matrix powers: DEMATEL
The DEMATEL technique shares with MICMAC the concepts of total influence and dependence as the chief metrics to achieve a categorisation of interrelated problem elements (Fontela & Gabus, Citation1974a). Yet the computational strategy for obtaining these metrics is a power series (Fontela & Gabus, Citation1974b: Ch.1):
(3)
(3)
Where is the normalised matrix of semi-numeric scores
is the reciprocal of its largest row-sum;
and
are, respectively, a unity vector and an identity matrix of appropriate size; and the exponent
denotes matrix inversion.
Typically, DEMATEL applications refer to EquationEquation 3(3)
(3) without alterations, at times misreporting it (e.g. Ethirajan et al., 2021; Yazdani et al., Citation2019). Seldom is it emphasised that the normalisation that generates matrix
is designed to guarantee the existence of
This becomes clearer as one notices that EquationEquation 3
(3)
(3) is equivalent to multiplying
by both sides of the following expression (Waugh, Citation1950):
(4)
(4)
EquationEquation (4)(4)
(4) is well known in economics, a field familiar to the founders of DEMATEL (Pulido et al., Citation2008). In such context,
represents an interrelated system of industries, whose viability depends on the conditions under which the power series converges to the inverse matrix
One such condition is that
must decrease and eventually vanish – i.e. there is some value
such that
for all
In the context of DEMATEL, this intuition has been rephrased in non-mathematical terms as the ‘decreasing importance’ of a problem’s indirect influence (Fontela & Gabus, Citation1974b).
Waugh (Citation1950) demonstrates that this condition is met if the elements of are such that their column-sum is less than one for all columns
– in which case, the matrix norm is
and no element of a matrix can be larger than its norm. Suh and Heijungs (Citation2007) consider the case where
does not meet the requirement
due to e.g. mixed units such as those used to express physical flows between supply chain operations. In this case the power series in EquationEquation 4
(4)
(4) converges if the dominant eigenvalue
of
is less than one in modulus, a condition met by doubly-normalising
using its on-diagonal elements, if any, and a rescaling factor
In special cases, knowledge about the eigenvalues of a non-negative structural analysis matrix of size
is sufficient to conclude whether higher powers of such a matrix approach a limiting state or vanish. Strang (Citation1986) illustrates this result assuming that
has
linearly independent eigenvectors and
distinct eigenvalues, in which case for
the power
approaches
if and only if
for all
(a stronger condition than the requirement on the matrix norm previously described).
In the DEMATEL context, the literature does not build on the above insights to support its choice of normalisation factors (e.g. Gölcük & Baykasoğlu, Citation2016).
2.2.3. Linking consecutive matrix powers to series: ISM
ISM differs from the previous techniques as for the most part it consists of a graph partitioning algorithm whose aim is to lay bare a ‘backbone’ of the original digraph that contains fewer edges and is organised hierarchically, hence is easier to interpret for the experts (Warfield, Citation1974, Citation1976). A schematic summary of the algorithm is provided in Supplementary Materials S2. The algorithmic aspects of ISM pose distinct methodological challenges, which are discussed in a separate section.
For continuity with the previous sections, here we highlight how the starting point for ISM is analogous to the end-results for techniques such as DEMATEL and MICMAC. Specifically, the concept of a ‘reachability matrix’ in ISM is the counterpart of the matrix of total interactions in EquationEquation 2(2)
(2) and Equation3
(3)
(3) . The reachability matrix, too, is the result of consecutive matrix powers that are assumed to settle to a limiting value. Yet in ISM the structural analysis matrix
is typically binary and, before being powered, a suitably sized identity matrix
is added to it, yielding:
(5)
(5)
where the addition is Boolean since # denotes the operation described in EquationEquation 1
(1)
(1) . The matrix power
is also obtained by Boolean operations. It is assumed that some integer value
can be found such that (Malone, Citation1975):
(6)
(6)
where matrix inequalities apply entry-by-entry. In practice,
is replaced by its upper bound
which corresponds to the longest distinct path between any pair of nodes in a digraph with
nodes (Warfield, Citation1973a):
(7)
(7)
Most applications of ISM refer to EquationEquations 5(5)
(5) and Equation6
(6)
(6) , usually without mentioning EquationEquation 7
(7)
(7) . Yet the literature is favourably inclined towards a streamlined approach to determining the reachability matrix, in which the original equations are replaced by manual ‘transitivity checks’ performed by the researcher without the aid of a computer (e.g. Sushil, Citation2017, Citation2018). In this context, researchers rarely develop equations that are comparable with other SPSM techniques. To bridge this gap we expand the generic matrix power term in EquationEquation 6
(6)
(6) with the aid of Theorem 5.7 in Harary et al. (Citation1965):
(8)
(8)
Recalling EquationEquation 7(7)
(7) , the reachability matrix – initially defined by consecutive matrix powers – can be expressed as a finite sum of matrix powers:
(9)
(9)
Whilst the consecutive powers in EquationEquation 6(6)
(6) are reminiscent of MICMAC, EquationEquation 9
(9)
(9) is closer to the fundamental DEMATEL equation – shedding some light on how the two may be related. As in DEMATEL, it seems sensible to require that
vanishes after some value
so that the right-hand side of EquationEquation 8
(8)
(8) converges to the reachability matrix. This condition is met when the underlying digraph does not contain any directed edge sequence of length
or larger (Deo, Citation1974, p. 232). This approach replaces taking the limit of a finite sum of matrix powers – as EquationEquation 4
(4)
(4) does – since
is a binary matrix.
It is rarely noticed that the same condition described above, if met, prevents techniques such as MICMAC from yielding meaningful results as the matrix power in EquationEquation 2(2)
(2) vanishes.
2.2.4. Reconciliation of SPSM matrix equations
With reference to the shared use of matrix powers as a computational device, we suggest that MICMAC, ISM and DEMATEL build progressively on each other. Matrix powers are unrelated in MICMAC; but combined as a finite sum in ISM, and as a series (infinite sum) in DEMATEL. This progression is emphasised in the middle portion of .
We also notice a progressive refinement of assumptions regarding the behaviour of higher matrix powers. MICMAC is vague on whether these powers settle or vanish. ISM overcomes these limitations in the case of a binary matrix, and introduces an upper bound on the exponent. ISM and DEMATEL share the requirement that higher powers of a structural analysis matrix do vanish, which is detrimental for MICMAC. In all cases this behaviour depends on the presence of paths beyond a certain length in the underpinning digraph. For DEMATEL, the additional requirement of normalisation provides useful diagnostics for the behaviour, in the limit, of higher matrix powers.
Conceptually, the finite sum of matrix powers in ISM, and the infinite sum in DEMATEL (EquationEquations 4(4)
(4) and Equation9
(9)
(9) ) can be reconciled through the inequality:
(10)
(10)
where is used instead of
the right-hand term of EquationEquation 9
(9)
(9) , even though these may not be equivalent. Recalling that
is the adjacency matrix of a ‘transitive closure’ of a digraph with reachability matrix
(Harary et al., Citation1965), and that
one obtains:
(11)
(11)
EquationEquations 10(10)
(10) and Equation11
(11)
(11) help relate the ISM concept of a reachability matrix – represented by a finite sum of matrix powers – with the DEMATEL concept of a total interaction matrix – represented by a matrix inverse to which an infinite sum of matrix powers converges.
At the conceptual level, the suggested relationship can be strengthened if the right-hand side of EquationEquation 10(10)
(10) is turned into an equivalence invoking the Cayley-Hamilton theorem – a well-known result in linear algebra (Pal & Bhunia, Citation2015, chap. 3). With reference to the inequality
in EquationEquation 10
(10)
(10) , the theorem warrants that the inverse on the right-hand side can be cast into a finite sum containing up to the
th power of the matrix
(12)
(12)
The unknowns in this problem are the scalars If
has
distinct eigenvalues
one obtains these unknown scalars by solving the following (Lathi, Citation2002, p.62):
(13)
(13)
After obtaining through EquationEquation 13
(13)
(13) one substitutes back
for
in EquationEquation 12
(12)
(12) , and works out the scalars
that multiply
in the expression
– thus establishing an equivalence between a finite sum of powers of
and the inverse
In the context of SPSM, this distinction is often underplayed, generating some confusing notation (e.g. Ethirajan et al., 2021; Yazdani et al., Citation2019).
2.2.5. Matrix powers in fuzzy SPSM approaches
So far we have assumed that key SPSM equations were as defined in the foundational literature. Yet a growing number of applications in the literature use fuzzy structural analysis matrices, meaning that experts score the strength of a relationship using degrees of membership on a scale defined by extremes (1-0) instead of discrete values. Another approach is to use interval-type (‘grey’) matrices (e.g. Ethirajan et al., 2021). The algebra of fuzzy SPSM approaches differs from the general case examined so far, since the matrix (dot) product is replaced by max-min, or other compositions. Ragade (Citation1976) illustrates these compositions in the case of fuzzy ISM. It is still a requirement that the powers of the underpinning fuzzy matrix converge to a limiting value – a condition that is often assumed to occur (e.g. Zhao et al., Citation2020). Thomason (Citation1977) demonstrates that such powers may oscillate rather than converge, and that convergence may be subject to specific conditions on the entries of the fuzzy matrix i.e. that for any pair of problem elements
there is
such that
2.3. Comparison of visual analytics
The algebraic insights discussed above are used to develop visual analytics that are fed back to practitioners for interpretive analysis, collective learning, and group decisions. This idea is schematically illustrated in as one progresses towards the right-hand side, and through the example in Supplementary Materials S1. Below we identify two approaches, one of which requires further computations.
2.3.1. The influence/dependence plane approach
Techniques such as MICMAC and DEMATEL have a shared approach to visual analytics, although the underpinning calculations differ – as previously noticed. In both cases, the constituent elements of a problem situation are visualised as a scatterplot on an ‘influence/dependence’ Cartesian plane. The coordinates of each element on the plane are obtained from the influence/dependence vectors and
described in Sections 2.2.1 and 2.2.2. Once a scatterplot is obtained, the problem elements are segmented based on the pre-defined portion of the plane in which they fall.
In the specific case of MICMAC the ‘influence/dependence’ plane has four quadrants associated with the following segmentation (see Godet, Citation1986, p.153): Equation(1)(1)
(1) ‘influential’ elements (upper-left quadrant); Equation(2)
(2)
(2) ‘linkage/relay’ elements, which are unsteady (upper-right quadrant); 3) ‘dependent’ elements (lower right quadrant); and 4) ‘autonomous’ elements unlikely to play a role in future developments (lower left quadrant). An L-shaped plot on the influence/dependence plane denotes stability (Godet, Citation2007, p.173). This schematic proved to be popular in the ISM literature, which uses the term MICMAC improperly, as a synecdoche for this visualisation device.
The DEMATEL scatterplot has only two quadrants (top/bottom), and its coordinate system requires that the influence/dependence vectors are turned into combined measures of influence and dependence. Specifically, the ordinate indicates the ‘net position’ of an element: elements located in the top half (bottom half) of the plane are deemed highly influential (highly dependent) and classified as predominantly ‘dispatcher’ (‘receiver’). The abscissa
is a proxy for ‘total intensity’, so that the elements on the right-hand side of the plane have greater overall importance. This system of coordinates, originally devised by Fontela and Gabus (Citation1974b) has remained substantially unchanged (e.g. Ethirajan et al., 2021; Gölcük & Baykasoğlu, Citation2016).
2.3.2. The graph partitioning approach (ISM)
The second approach to visual analytics in SPSM is a minimum-edge, hierarchical digraph – a ‘backbone’ or ‘skeleton’ – which is characteristic of the ISM approach. This backbone is obtained through a partitioning algorithm (described in Supplementary Materials S2) which groups strongly connected problem elements, and re-arranges these groups by hierarchical levels (Warfield, Citation1973b). Similarly to the scatterplots described above, highly influential problem elements (shown at the bottom of the hierarchy) are separated from highly dependent or resultant elements (shown at the top).
As mentioned in Section 2.2.3, some methodological issues associated with this approach are substantially overlooked by the literature. One such issue stands out: the significant overlap with the joint problems – well known in computer science – of finding strongly connected components in a digraph (Deo, Citation1974) and a block-triangular permutation of its adjacency matrix (Strang, Citation1986: Ch.16).
The original ISM algorithm was developed before personal computing became commonplace (Warfield, Citation1974, Citation1976), which favoured manual implementation over automation (Farris & Sage, Citation1975). Yet the extant ISM literature continues to replicate –almost without exception (e.g. Babu et al., Citation2021; Sushil, Citation2017) – the same manual steps illustrated by Warfield (Citation1973b). Many observers fail to notice that these steps could be vastly simplified if the strongly connected components in the relevant digraph were initially identified by e.g. Depth-First Search – DFS (Deo, Citation1974: p. 302), a process that generates the required block-triangular permutation of the corresponding adjacency matrix almost as a by-product. The implementation of DFS for the identification of ‘strongly connected’ component is now a standard capability in network analysis software.
A second issue is that entire parts of the ISM algorithm are dismissed in the literature. For example, hardly any ISM application explicitly computes the so-called ‘skeleton’ matrix for the minimum-edge digraph, as originally intended by Warfield (Citation1974; Citation1976). Overall, attempts to advance the ISM partitioning algorithm remain sparse (e.g. Kim & Watada, Citation2009).
A third and final issue is that the literature rarely acknowledges that the ISM algorithm fails to apply to a reachability matrix filled with ones – an indicator that any node can be reached from any other node, thus defeating the rationale for partitioning a digraph (Warfield, Citation1973b). This feature is exacerbated by concerns about how the reachability matrix is usually computed, which were expressed in Section 2.2.3.
2.4. Elicitation of expert judgment
Concepts such as post-normal science recognise the challenges of comprehending and managing complex situations in the absence of a theoretical basis for factual predictions (Funtowicz & Ravetz, Citation1993). The original intent of SPSM is to address similar challenges, through a disciplined approach to expert judgment and intuition leading to relational maps and structural analysis matrices.
In principle, a range of approaches can be adopted to help individuals contribute their judgment, intuition, and creativity in participative SPSM activities (e.g. Lendaris, Citation1979). In practice, the experts go through a pre-established list of questions for each pair of constituent problem elements previously identified. These questions may differ – compare e.g. Godet (Citation1977, Citation1986, p. 67) and Saxena et al. (Citation1990). The latter introduces the concept of self-interaction matrix – a widely used instrument in extant ISM research – by which an experts score contextual relationships in
evaluation steps, each involving a four-question checklist.
It can be challenging to assess the specific benefits of a given mode of engagement in terms of reducing the cognitive burden for decision makers (e.g. Kolfschoten et al., Citation2014). In the adjacent field of AHP, research has explored ‘parsimonious’ approaches centred on the decision maker, which reduce the number of paired comparisons required in practical applications (e.g. Abastante et al., Citation2018). As mentioned in Section 2.1, the conditions to infer comparative relationships in MCDA may not hold for the influence relationships that are prevalent in SPSM.
The growing ambition of extant SPSM literature to resemble survey research corresponds to a general loss of interest in the cognitive effort required by decision makers, and in human-machine interaction as a way to build consensus through structured dialogue (e.g. Sushil, Citation2018). Yet few works estimate such effort with time-related metrics – some that do are summarised in .
Table 3. Available estimates of expert effort for different structural modelling techniques.
These works do not specify how the estimated time is allocated i.e. interaction with computers, processing etc. It is also unclear whether the time estimates provided account for human-computer interaction. Yet early ISM research was more prescriptive about the use of computers in facilitated group work (Janes, Citation1988).
Specifically, early ISM work sets out a human-machine interactive environment to elicit subjective judgment on contextual relationships (Malone, Citation1975). Warfield (Citation1982; Citation1976) illustrates such an environment as consisting of: Equation(1)(1)
(1) the individuals involved and their perception of the problem situation; Equation(2)
(2)
(2) the software and hardware embodying the necessary methodological steps; and Equation(3)
(3)
(3) the relevant information dealt with (i.e. substantive content). Early ISM work also aimed to support group learning, with benefits accruing not only from the models generated, but also from partaking in the process (Warfield, Citation1982). Warfield and Cárdenas (Citation1994) further develop the above principles through the concept of ‘interactive management’.
Unlike early ISM, most SPSM approaches are not prescriptive on how experts should be engaged. For example, MICMAC encourages seeking a plurality of viewpoints using intuitive means, brainstorming, and unstructured interviews with relevant stakeholders (Godet, Citation1986) – but is elusive on how to do so. DEMATEL has resembled survey research since the outset, allowing experts to separately complete and submit their judgment via questionnaires. In this context, interaction with computers is limited to the analysis of these questionnaires, as it brings “…some order into the apparent chaos of thought” (Fontela & Gabus, Citation1974a). Few applications have explored the overlaps with rigorous case study research and discursive processes (Bolaños et al., Citation2005; Kwak et al., Citation2018).
3. Illustrative applications of SPSM to SCRM
This section addresses RQ2 by illustrating evidence from the SCRM literature that substantiates claims made in previous sections. A sample of the literature was obtained by querying Web of Science for abstracts/keywords containing the terms (DEMATEL OR MICMAC OR ISM OR "interpret* structural model*") AND (risk OR resilien*) AND (SUPPLY CHAIN). This search yielded 112 journal papers. We excluded papers that Equation(1)(1)
(1) were deemed not pertinent based on closer examination of abstract and title; Equation(2)
(2)
(2) did not disclose sufficient analytical details; or Equation(3)
(3)
(3) were published in journals that are ‘author-pays’ only (as the rigour of this publishing approach is debated). Given the illustrative aim of this section, the selection process reached saturation with fewer papers than a systematic review. The final sample consists of 50 references, four of which are not journal papers. and illustrate the sample and the proposed evaluation grid.
Figure 2. Selected sample of reviewed papers on applications of SPSM in SCRM.
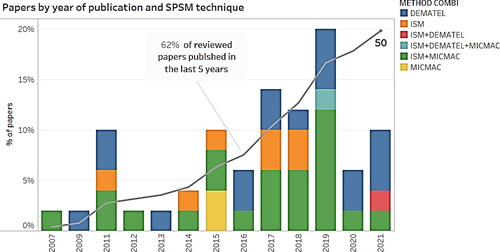
Figure 3. Summary metrics related to the expert-driven risk interdependency evaluation process for the selected references.
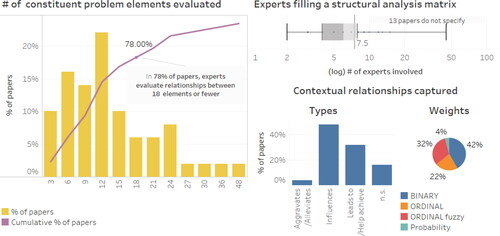
Table 4. Summary of relevant research data on structural modelling in the context of supply chain risk evaluation.
3.1. Constituent problem elements and contextual relationships
Conceptually, it is often recommended that risks should be regarded as interconnected rather than standalone (e.g. Chopra & Sodhi, Citation2004). However, the literature continues to focus on individual risks as opposed to risk interaction analysis using techniques such as SPSM (Kwak et al., Citation2018). Based on the 50 selected references (highlighted in ), experienced practitioners typically help identify an arbitrary number of risks, as well as possible contextual relationships between them. In 78% of cases, experts were asked to evaluate contextual relationships between 18 risk items or fewer (, left-hand side), with a clear prevalence of ‘influences’ (∼48%) and ‘leads to/helps achieve’ (∼32%) type of relationships (, right-hand side).
In 54% of cases, experts scored the intensity of the identified contextual relationships (22% by a fuzzy scale), but rarely outside DEMATEL applications. specifies alternatives to single-valued semi-numerical scores. Wu et al. (Citation2017) illustrate a simultaneous application of two such approaches. In other (fewer) cases, experts also assessed the probability that risk events occur (e.g. Bañuls et al., Citation2017).
3.2. Expert engagement
Less than half of the reviewed papers specify how experts were engaged to elicit contextual relationships. Formalised techniques include Delphi and/or focus groups (e.g. Chaudhuri et al., Citation2016; Han et al., Citation2019; Kwak et al., Citation2018); workshops (e.g. Faisal et al., Citation2007); and case studies (e.g. Pfohl et al., Citation2011). Often, the number of experts involved in identifying relevant risks differs compared to those involved in evaluating contextual relationships; for example the former may involve fully-fledged surveys. Works that assume a collective response are not often specific on how consensus among experts on paired risk assessments is arrived at. In only two cases is a voting system explicitly adopted (Alawamleh & Popplewell, Citation2011; Han et al., Citation2019). Where individual responses are sought instead, the averaging approach is used with few exceptions (an example of such exceptions is Song et al., Citation2017).
3.3. Algebraic and algorithmic aspects
As outlined in Section 2, the computational structures of MICMAC and ISM, if correctly applied, are incongruent; whereas ISM and DEMATEL are treated as mutually exclusive, despite their affinity. Yet 44% of cases considered here apply ISM and MICMAC in combination, while just 2% claim to combine ISM and DEMATEL. Only half of the reviewed papers disclose some equations, which reduces to less than 10% in the case of ISM-MICMAC combined. In hardly any cases does the ISM literature go beyond recalling some standard expression for the reachability matrix (e.g. Pfohl et al., Citation2011; Wu et al., Citation2015). Algebraic or algorithmic insights are often replaced by prose. For example, conceptual descriptions of the reachability matrix in ISM have little to do with its analytical derivation, examined in Section 2, and the underlying operations are manually implemented. Only one work (Hachicha & Elmsalmi, Citation2014) refers correctly to the original MICMAC algorithm. Applications of DEMATEL, on the other hand, are more likely to credit and disclose key equations. Some papers hint at the power series approximation of the inverse matrix, but without elaborating on the conditions for convergence (e.g. Ethirajan et al., 2021; Song et al., Citation2017).
3.4. Visualisation and human-computer interaction
The extant literature applies the conventional visualisations discussed in Section 2.3 without alteration. However, when MICMAC is implemented jointly with ISM, it is stripped of its characteristic computational aspects, and reduced to a four-quadrant visual categorisation procedure. In other cases the same treatment is used with ISM’s characteristic minimum-edge digraph (e.g. Vishnu et al., Citation2019). Across the reviewed cases SPSM software tools are hardly ever deployed for computational and visualisation purposes (e.g. Hachicha & Elmsalmi, Citation2014). Most ISM work employs a convention for matrix-filling that requires no computer assistance, first introduced by Saxena et al. (Citation1990) and denoted as ‘VAXO’ in .
4. Discussion
The idea of structuring complex problems as a system has been around for decades; the general intent being to ease managers’ sense of helplessness, lack of confidence, and inability to take responsibility in the face of complexity (e.g. Ackoff, Citation1974; Senge, Citation2006). In the ongoing debate on whether rational analysis alone is sufficient in the face of complexity, SPSM adopts a hybrid stance. Like soft OR, it embodies a disciplined attitude towards complexity, and places considerable emphasis on problem structuring. Like hard OR, it acknowledges the limitations of prose as an alternative to rational analysis.
The research presented in this paper compares and contrasts widely applied SPSM techniques through a methodological lens. The findings highlight algebraic and procedural aspects that are often taken for granted, as researchers now focus on specific application contexts. Our research shows that these aspects, whilst overlooked, affect the ability to impart a meaningful and sound relational structure on complex problem situations as perceived by experienced practitioners. summarises key insights in response to RQ1 and RQ2. These are discussed below.
Table 5. Summary of key findings.
4.1. Highlights from the methodological comparison
The most prominent building block in SPSM is reliance on structural analysis matrices (either binary, semi-numeric, or fuzzy), with graph-theoretical interpretations to capture influence-type contextual relationships. However, for techniques such as MICMAC it is unclear what checks and balances should be in place while filling such matrices, to ensure that later computations based on the matrices work out as desired. These checks and balances are more prescriptively defined in adjacent MCDA techniques such as AHP (for an overview, see Marttunen et al., Citation2017).
Our findings emphasise the importance of matrix powering operations as the common algebraic device which enables SPSM to generate insights that practitioners can interpret and act upon. Although they are often overlooked, the differing assumptions about how the powers of a structural analysis matrix behave offer an invaluable lens to identify similarities and differences between individual strands of research. As an example, the reachability matrix in ISM and the matrix of ‘total’ effects in DEMATEL are, in fact, analogous. Yet, reachability matrix equations are rarely developed in full (e.g. Li et al., Citation2019). Even work that jointly applies DEMATEL and ISM fails to recognise analogies between the two methods (e.g. Gardas et al., Citation2019; Liu et al., Citation2021). Discussions around apparent differences are usually hastily compiled and lack methodological depth (e.g. Ethirajan et al., 2021; Vishnu et al., Citation2019; Zhao et al., Citation2020).
Our research also shows that MICMAC appears to borrow a key assumption about the convergence of powers of a structural analysis matrix from paired comparison theory, which is actually concerned with priority rather than intent structures (see e.g. Kendall, Citation1955; Saaty, Citation1987). Unlike a paired comparison approach, however, MICMAC fails to guarantee that the conditions for the powered matrix working properly are always met. Our findings also promote the standard eigenvalue problem as a common theoretical foundation to address the issue of guaranteed convergence for powers of a structural analysis matrix, in turn also providing useful diagnostics.
All three of the SPSM techniques develop characteristic visual analytics for interpretive purposes. Our findings highlight that apparently unrelated visualisation approaches – such as ‘influence/dependence’ scatterplots (MICMAC, DEMATEL) and minimum-edge hierarchical digraphs (ISM) – are actually built on similar computational grounds. To correctly complement each other, however, the computational analogies or incongruences between the different approaches need to be recognised and addressed. For example, the term ‘MICMAC’ is often just a synecdoche, denoting the use of its 2-by-2 visualisation device within ISM applications. The literature also fails to recognise that a major portion of the ISM algorithm – currently laid out manually without computer aid in most papers – is equivalent to the identification of connected components in a digraph. This is a task that any network analysis software can effectively automate.
Regarding the preferred mode of engagement with experts, our research observed that survey-like approaches – as opposed to facilitated group learning – are now prevalent. Unlike survey research that is aimed at inductive generalisations, composing expert responses in an SPSM context can be a challenge (e.g. Fontela & Gabus, Citation1974b). Yet, the analysis of statistical significance in combining independent SPSM responses has barely advanced (e.g. Shieh & Wu, Citation2016). Even when group consensus replaces individual responses, the SPSM literature rarely discloses how it was reached, and whether human-computer interaction helped reduce the cognitive burden associated with the process. These overlooked areas of SPSM have received more attention elsewhere in the literature (e.g. Abastante et al., Citation2018; Kolfschoten et al., Citation2014), but few works place much emphasis on the design and deployment of digital tools to facilitate the task of engaging with the decision maker (e.g. Manzano-Solís et al., Citation2019; Settanni et al., Citation2018). The incumbent SPSM literature seems reticent to deploy specialised software tools, despite the availability of free resources (for ISM: www.jnwarfield.com/; and for MICMAC: en.laprospective.fr/). This is no coincidence. Widely implemented approaches such as ‘total’ ISM (Sushil, Citation2017, Citation2018) regard the use of computers as optional, and encourage prose instead. This appears to be a departure from the original intent of structural thinking (e.g. Warfield & Staley, Citation1996).
4.2. Practical and theoretical implications
From a practical perspective, our research calls into question the justifiability of ISM, DEMATEL and MICMAC as separate research strands; mainly on the grounds of similarities and differences concerning the respective computational structures. In the past, ISM would differ from DEMATEL and MICMAC due to its idiosyncratic approach to expert engagement, facilitated by human-computer interaction. Today that distinction appears hardly justifiable, considering how ISM research now underplays the automation of computational as well as expert engagement tasks. At first glance, DEMATEL and MICMAC appear to differ in terms of fundamental equations. But that difference is most likely due to the positioning of MICMAC half-heartedly between AHP and DEMATEL, without the methodological checks and balances of either.
From a theoretical perspective, one cannot help but notice how SPSM applications have mutated into ‘shortcut’ surrogates for survey research; thereby losing much of the original intent to support challenging managerial decisions in the face of complexity. A decision maker-centric approach is the exception rather than the rule in the extant academic literature. A further key aspect of SPSM often neglected today is that the benefits of the approach accrue not only from the analytical models that are generated, but also from participating in the process in itself (Warfield, Citation1982). In this context, it is worth noting that the foundational SPSM principles were developed at a time when cognitive biases and simplifying heuristics in human judgment were relatively unexplored (for an early overview see Schwenk, Citation1985).
These notions are now well established and being further developed in disciplines such as Behavioural Operations Research (Kunc, Citation2020). Looking back on the original intent and methodological principles behind SPSM, as this paper does, creates an opportunity to appreciate the merits of raising awareness of the limitations of human-bounded rationality in the face of complexity; at the same time promoting rigour, coherence and dialogue in the collective reflection (Fontela & Gabus, Citation1974b; Godet, Citation1986; Janes, Citation1988).
5. Concluding remarks
This paper compares and contrasts SPSM techniques (ISM, DEMATEL, MICMAC) that are considered a staple in the business and management literature, focusing in particular on methodology. As such this research is the first of its kind, and a major departure from the normative view in the extant literature, which rarely aims to advance or critically evaluate the techniques. Instead the extant literature focuses on specific applications contexts (e.g. technology adoption, risk, sustainable managerial practices, supplier selection) and constituent problem elements (e.g. barriers, enablers, risks).
The comparative evaluation presented in this paper offers a unifying view across SPSM techniques, which has never been done even though the applications have been in use for decades. Our arguments are developed by taking a closer look at some characteristic procedural and algebraic aspects of SPSM, which are normally taken for granted or underplayed in the literature. Of interest to both practitioners and academics, our findings identify previously unnoticed analogies between techniques that have always been regarded as mutually exclusive. We also raise concerns about possible incongruences between techniques that are often applied jointly. The research emphasises the eigenvalue problem as a common theoretical platform, aiming to raise awareness of its importance for practical diagnostics. This approach helps to determine whether or not a given technique reliably yields the outcome that is hoped for, based on the input provided by experienced practitioners.
Besides these more computational aspects, our findings highlight a lack of rigour in the approaches used to facilitate engagement with experts, which are only rarely assisted by digital tools that seek to leverage human-computer interaction. While there are adjacent academic fields which emphasise the need to reduce the cognitive burden for decision makers, this aspect has gradually lost relevance in the SPSM field. Instead, the literature favours an uncritical application of research templates with a view to achieving ‘shortcut’ survey surrogates.
It is acknowledged that this research has limitations. First, in order to maintain a reasonable scope it could not feasibly conduct a comprehensive review of four decades of literature across three well-established techniques. Instead, the paper’s claims are substantiated based on an in-depth analysis of models and equations for a subset of relevant applications and methodological development work. Second, the aspect of fuzzy set theory applied to SPSM, whilst mentioned in passing, has not been examined in detail. Third, the research does not consider crossovers between MCDA and SPSM.
Despite these limitations, this paper initiates a process of clarifying whether ISM, DEMATEL and MICMAC should be justified as autonomous research strands, a view which is currently widely assumed across the literature. The research challenges the legitimacy of the incumbent view, by providing a clearer, more analytical interpretation of the working requirements for each technique. Furthermore it provides academics and practitioners with the necessary insights and caveats to guide more informed applications of SPSM in the future. This approach of constructive criticism also opens up potential avenues for further research, especially with regard to the development of digital tools to automate and facilitate the process of expert engagement.
Supplemental Material
Download PDF (535.5 KB)Acknowledgements
The authors wish to thank three anonymous reviewers for their constructive comments. Howard Walwyn proofread the paper and provided invaluable assistance in improving its readability.
Disclosure statement
No potential conflict of interest was reported by the author(s).
Additional information
Funding
References (* denotes work reviewed in table 4)
- Abastante, F., Corrente, S., Greco, S., Ishizaka, A., & Lami, I. M. (2018). Choice architecture for architecture choices: Evaluating social housing initiatives putting together a parsimonious AHP methodology and the Choquet integral. Land Use Policy, 78, 748–762. https://doi.org/10.1016/j.landusepol.2018.07.037
- Ackermann, F. (2019). PSMs are dead; long live PSMs. Journal of the Operational Research Society, 70(8), 1396–1397. https://doi.org/10.1080/01605682.2018.1502630
- Ackermann, F., Alexander, J., Stephens, A., & Pincombe, B. (2020). In defence of Soft OR: Reflections on teaching Soft OR. Journal of the Operational Research Society, 71(1), 1–15. https://doi.org/10.1080/01605682.2018.1542960
- Ackoff, R. L. (1974). The systems revolution. Long Range Planning, 7(6), 2–20. https://doi.org/10.1016/0024-6301(74)90127-7
- *Aggarwal, S., & Srivastava, M. K. (2019). A grey-based DEMATEL model for building collaborative resilience in supply chain. International Journal of Quality & Reliability Management, 36(8), 1409–1437. https://doi.org/10.1108/IJQRM-03-2018-0059
- *Alawamleh, M., & Popplewell, K. (2011). Interpretive structural modelling of risk sources in a virtual organisation. International Journal of Production Research, 49(20), 6041–6063. https://doi.org/10.1080/00207543.2010.519735
- *Ali, S. M., Moktadir, M. A., Kabir, G., Chakma, J., Rumi, M. J. U., & Islam, M. T. (2019). Framework for evaluating risks in food supply chain: Implications in food wastage reduction. Journal of Cleaner Production, 228, 786–800. https://doi.org/10.1016/j.jclepro.2019.04.322
- *Alora, A., & Barua, M. K. (2019). An integrated structural modelling and MICMAC analysis for supply chain disruption risk classification and prioritisation in India. International Journal of Value Chain Management, 10(1), 1–25. https://doi.org/10.1504/IJVCM.2019.096538
- *Babu, H., Bhardwaj, P., & Agrawal, A. K. (2021). Modelling the supply chain risk variables using ISM: A case study on Indian manufacturing SMEs. Journal of Modelling in Management, 16(1), 215–239. https://doi.org/10.1108/JM2-06-2019-0126
- Bañuls, V. A., López, C., Turoff, M., & Tejedor, F. (2017). Predicting the impact of multiple risks on project performance: A scenario-based approach. Project Management Journal, 48(5), 95–114. https://doi.org/10.1177/875697281704800507
- Bolaños, R., Fontela, E., Nenclares, A., & Pastor, P. (2005). Using interpretive structural modelling in strategic decision-making groups. Management Decision, 43(6), 877–895. https://doi.org/10.1108/00251740510603619
- *Can, G. F., & Toktas, P. (2018). A novel fuzzy risk matrix based risk assessment approach. Kybernetes, 47(9), 1721–1751. https://doi.org/10.1108/K-12-2017-0497
- Chaudhary, S., & Suri, P. K. (2021). Modelling the enablers of e-trading adoption in agricultural marketing: A TISM-based analysis of eNAM. Vision, https://doi.org/10.1177/0972262920977979
- *Chaudhuri, A., Srivastava, S. K., Srivastava, R. K., & Parveen, Z. (2016). Risk propagation and its impact on performance in food processing supply chain. Journal of Modelling in Management, 11(2), 660–693. https://doi.org/10.1108/JM2-08-2014-0065
- Chopra, S., & Sodhi, M. S. (2004). Managing risk to avoid supply-chain breakdown. MIT Sloan Management Review, 46(1), 53.
- *Chowdhury, N. A., Ali, S. M., Mahtab, Z., Rahman, T., Kabir, G., & Paul, S. K. (2019). A structural model for investigating the driving and dependence power of supply chain risks in the readymade garment industry. Journal of Retailing and Consumer Services, 51, 102–113. https://doi.org/10.1016/j.jretconser.2019.05.024
- *Dandage, R. V., Mantha, S. S., & Rane, S. B. (2019). Strategy development using TOWS matrix for international project risk management based on prioritization of risk categories. International Journal of Managing Projects in Business, 12(4), 1003–1029. https://doi.org/10.1108/IJMPB-07-2018-0128
- Dasaklis, T. K., & Pappis, C. P. (2018). Critical success factors for implementing cholera vaccination campaigns in humanitarian emergencies: A DEMATEL-based approach. EURO Journal on Decision Processes, 6(1-2), 1–20. https://doi.org/10.1007/s40070-017-0062-3
- Deo, N. (1974). Graph theory: With applications to engineering and computer science. Prentice-Hall.
- *Diabat, A., Govindan, K., & Panicker, V. V. (2012). Supply chain risk management and its mitigation in a food industry. International Journal of Production Research, 50(11), 3039–3050. https://doi.org/10.1080/00207543.2011.588619
- Duperrin, J.-C., & Godet, M. (1973). Méthode de hiérarchisation des éléments d’un système: essai de prospective du système de l’énergie nucléaire dans son contexte sociétal (CEA-R-4541). Centre d'Etudes Nucléaire de Saclay.
- Duval, A., Fontela, E., & Gabus, A. (1974). Cross-impact analysis: A handbook on concepts and applications (DEMATEL Innovative methods No. 1. Battelle.
- *Etemadinia, H., & Tavakolan, M. (2021). Using a hybrid system dynamics and interpretive structural modeling for risk analysis of design phase of the construction projects. International Journal of Construction Management, 21(1), 93–112. 35 https://doi.org/10.1080/15623599.2018.15
- *Ethirajan, M., Arasu, M. T., Kandasamy, J., Vimal, K. E., Nadeem, S. P., & Kumar, A. (2021). Analysing the risks of adopting circular economy initiatives in manufacturing supply chains. Business Strategy and the Environment, 30(1), 204–236. https://doi.org/10.1002/bse.2617
- *Faisal, M. N., Banwet, D. K., & Shankar, R. (2007). Information risks management in supply chains: An assessment and mitigation framework. Journal of Enterprise Information Management, 20(6), 677–699. https://doi.org/10.1108/17410390710830727
- Farris, D. R., & Sage, A. P. (1975). On the use of interpretive structural modeling for worth assessment. Computers & Electrical Engineering, 2(2-3), 149–174. https://doi.org/10.1016/0045-7906(75)90004-X
- *Fazli, S., Kiani Mavi, R., & Vosooghidizaji, M. (2015). Crude oil supply chain risk management with DEMATEL-ANP. Operational Research, 15(3), 453–480. https://doi.org/10.1007/s12351-015-0182-0
- Flood, R. L. (1988). Situational complexity, systems modelling and methodology. Transactions of the Institute of Measurement and Control, 10(3), 122–129. https://doi.org/10.1177/014233128801000303
- Fontela, E., & Gabus, A. (1974a). DEMATEL: Progress achieved. Futures, 6(4), 361–363. https://doi.org/10.1016/0016-3287(74)90086-X
- Fontela, E., & Gabus, A. (1974b). Structural analysis of the world problematique: Methods (DEMATEL Innovative methods. Battelle.
- Funtowicz, S. O., & Ravetz, J. R. (1993). Science for the post-normal age. Futures, 25(7), 739–755. https://doi.org/10.1016/0016-3287(93)90022-L
- Gardas, B. B., Raut, R. D., Cheikhrouhou, N., & Narkhede, B. E. (2019). A hybrid decision support system for analyzing challenges of the agricultural supply chain. Sustainable Production and Consumption, 18, 19–32. https://doi.org/10.1016/j.spc.2018.11.007
- Georgantzas, N. C., & Hessel, M. P. (1995). The intermediate structure of designs for quality. International Journal of Quality & Reliability Management, 12(6), 97–108. https://doi.org/10.1108/02656719510089957
- Godet, M. (1977). Crise de la prévision. Essor de la prospective. Presses Universitaires de France.
- Godet, M. (1986). Introduction to la prospective: Seven key ideas and one scenario method. Futures, 18(2), 134–157. https://doi.org/10.1016/0016-3287(86)90094-7
- Godet, M. (2007). Manuel de prospective stratégique. Dunod.
- Gölcük, İ., & Baykasoğlu, A. (2016). An analysis of DEMATEL approaches for criteria interaction handling within ANP. Expert Systems with Applications, 46, 346–366. https://doi.org/10.1016/j.eswa.2015.10.041
- Gothwal, S., & Raj, T. (2017). Analyzing the factors affecting the flexibility in FMS using weighted interpretive structural modeling (WISM) approach. International Journal of System Assurance Engineering and Management, 8(2), 408–422. https://doi.org/10.1007/s13198-016-0443-1
- *Govindan, K., & Chaudhuri, A. (2016). Interrelationships of risks faced by third party logistics service providers: A DEMATEL based approach. Transportation Research Part E: Logistics and Transportation Review, 90(Supplement C), 177–195. https://doi.org/10.1016/j.tre.2015.11.010
- *Hachicha, W., & Elmsalmi, M. (2014). An integrated approach based-structural modeling for risk prioritization in supply network management. Journal of Risk Research, 17(10), 1301–1324. https://doi.org/10.1080/13669877.2013.841734
- *Han, Q., Zhu, Y., Ke, G. Y., & Hipel, K. W. (2019). Public private partnership in brownfield remediation projects in China: Identification and structure analysis of risks. Land Use Policy, 84, 87–104. https://doi.org/10.1016/j.landusepol.2019.01.034
- Harary, F., Norman, R. Z., & Catwright, D. (1965). Structural models: an introduction to the theory of directed graphs. (D. Cartwright & R. Z. Norman, Eds.). John Wiley & Sons, Inc.
- Harwood, S. (2019). Whither is problem structuring methods (PSMs)? Journal of the Operational Research Society, 70(8), 1391–1392. https://doi.org/10.1080/01605682.2018.1502628
- He, L., Wu, Z., Xiang, W., Goh, M., Xu, Z., Song, W., Ming, X., & Wu, X. (2021). A novel Kano-QFD-DEMATEL approach to optimise the risk resilience solution for sustainable supply chain. International Journal of Production Research, 59(6), 1714–1735. https://doi.org/10.1080/00207543.2020.1724343
- Hsieh, Y.-F., Lee, Y.-C., & Lin, S.-B. (2016). Rebuilding DEMATEL threshold value: An example of a food and beverage information system. SpringerPlus, 5, 1385. https://doi.org/10.1186/s40064-016-3083-7
- *Hung, S.-J. (2011). Activity-based divergent supply chain planning for competitive advantage in the risky global environment: A DEMATEL-ANP fuzzy goal programming approach. Expert Systems with Applications, 38(8), 9053–9062. https://doi.org/10.1016/j.eswa.2010.09.024
- Jackson, M. C. (2006). Beyond problem structuring methods: Reinventing the future of OR/MS. Journal of the Operational Research Society, 57(7), 868–878. https://doi.org/10.1057/palgrave.jors.2602093
- Jackson, M. C. (2019). Critical systems thinking and the management of complexity: Responsible leadership for a complex world. John Wiley & Sons, Ltd.
- *Jain, V., Kumar, S., Soni, U., & Chandra, C. (2017). Supply chain resilience: Model development and empirical analysis. International Journal of Production Research, 55(22), 6779–6800. https://doi.org/10.1080/00207543.2017.1349947
- Janes, F. R. (1988). Interpretive structural modelling: A methodology for structuring complex issues. Transactions of the Institute of Measurement and Control, 10(3), 145–154. https://doi.org/10.1177/014233128801000306
- *Kazemian, I., Torabi, S. A., Zobel, C. W., Li, Y. H., & Baghersad, M. (2021). A multi-attribute supply chain network resilience assessment framework based on SNA-inspired indicators. Operational Research: An International Journal, https://doi.org/10.1007/s12351-021-00644-3
- Kendall, M. G. (1955). Further Contributions to the Theory of Paired Comparisons. Biometrics, 11(1), 43–62. https://doi.org/10.2307/3001479
- Kim, I., & Watada, J. (2009). Decision making with an interpretive structural modeling method using a DNA-based algorithm. IEEE Transactions on Nanobioscience, 8(2), 181–191. https://doi.org/10.1109/TNB.2009.2023788
- Kolfschoten, G., French, S., & Brazier, F. (2014). A discussion of the cognitive load in collaborative problem-solving. EURO Journal on Decision Processes, 2(3-4), 257–280. https://doi.org/10.1007/s40070-014-0034-9
- Kunc, M. (2020). Behavioral operations and behavioral operational research: Similarities and differences in competences and capabilities. In L. White, M. Kunc, K. Burger, & J. Malpass (Eds.), Behavioral Operational Research: A Capabilities Approach (pp. 3–22). Springer International Publishing.
- *Kwak, D. W., Rodrigues, V. S., Mason, R., Pettit, S., & Beresford, A. (2018). Risk interaction identification in international supply chain logistics: Developing a holistic model. International Journal of Operations & Production Management, 38(2), 372–389. https://doi.org/10.1108/IJOPM-03-2016-0121
- Lakshmi Priyadarsini, S., & Suresh, M. (2020). Factors influencing the epidemiological characteristics of pandemic COVID 19: A TISM approach. International Journal of Healthcare Management, 13(2), 89–98. https://doi.org/10.1080/20479700.2020.1755804
- Lathi, B. P. (2002). Linear systems and signals. Oxford University Press.
- Lefebvre, J.-F. (1975). Une méthode d'analyse structurelle. METRA, 14(4), 635–659.
- Lendaris, G. G. (1979). On the human aspects in structural modeling. Technological Forecasting and Social Change, 14(4), 329–351. https://doi.org/10.1016/0040-1625(79)90033-7
- Lendaris, G. G. (1980). Structural Modeling a Tutorial Guide. IEEE Transactions on Systems, Man, and Cybernetics, 10(12), 807–840. https://doi.org/10.1109/TSMC.1980.4308410
- Li, G., Huang, D., Sun, C., & Li, Y. (2019). Developing interpretive structural modeling based on factor analysis for the water-energy-food nexus conundrum. The Science of the Total Environment, 651(Pt 1), 309–322. https://doi.org/10.1016/j.scitotenv.2018.09.188
- *Li, Y-F., Xie, Q-h. (2009). A method of identifying supply chain risk factors. In: Proceedings of the WRI World Congress on Software Engineering. https://doi.org/10.1109/WCSE.2009.275
- *Li, Y., Sankaranarayanan, B., Thresh Kumar, D., & Diabat, A. (2019). Risks assessment in thermalpower plants using ISM methodology. Annals of Operations Research, 279(1-2), 89–113. https://doi.org/10.1007/s10479-018-3121-7
- *Liu, X. L., Dou, Z. W., & Yang, W. (2021). Research on influencing factors of cross border E-Commerce supply chain resilience based on integrated Fuzzy DEMATEL-ISM. IEEE Access., 9, 36140–36153. https://doi.org/10.1109/ACCESS.2021.3059867
- Malone, D. W. (1975). An introduction to the application of interpretive structural modeling. Proceedings of the IEEE, 63(3), 397–404. https://doi.org/10.1109/PROC.1975.9765
- Mandic, K., Bobar, V., Delibasic, B. (2015). Modeling interactions among criteria in MCDM methods: A review. In B. Delibašić, J.E. Hernández, J. Papathanasiou, F. Dargam, P. Zaraté, R. Ribeiro, … V. Bobar (Eds.), Decision support systems V – big data analytics for decision making. Springer.
- *Mangla, S. K., Kumar, P., & Barua, M. K. (2014). Flexible decision approach for analysing performance of sustainable supply chains under risks/uncertainty. Global Journal of Flexible Systems Management, 15(2), 113–130. https://doi.org/10.1007/s40171-014-0059-8
- Manzano-Solís, L. R., Díaz-Delgado, C., Gómez-Albores, M. A., Mastachi-Loza, C. A., & Soares, D. (2019). Use of structural systems analysis for the integrated water resources management in the Nenetzingo river watershed. Land Use Policy, 87, 104029. https://doi.org/10.1016/j.landusepol.2019.104029
- Marttunen, M., Lienert, J., & Belton, V. (2017). Structuring problems for multi-criteria decision analysis in practice: A literature review of method combinations. European Journal of Operational Research, 263(1), 1–17. https://doi.org/10.1016/j.ejor.2017.04.041
- Mohammed, A. (2020). Towards 'gresilient' supply chain management: A quantitative study. Resources Conservation and Recycling, 155, 104641 https://doi.org/10.1016/j.resconrec.2019.104641
- Multon, K. D., & Coleman, J. S. M. (2010). Ordinal scale. In N. Salkind (Ed.), Encyclopedia of research design. Sage Publications
- Olson, D. L., & Wu, D. D. (2010). A review of enterprise risk management in supply chain. Kybernetes, 39(5), 694–706. https://doi.org/10.1108/03684921011043198
- Pal, S., & Bhunia, S. C. (2015). Engineering mathematics. Oxford University Press.
- *Parkouhi, S. V., Ghadikolaei, A. S., & Lajimi, H. F. (2019). Resilient supplier selection and segmentation in grey environment. Journal of Cleaner Production, 207, 1123–1137. https://doi.org/10.1016/j.jclepro.2018.10.007
- *Pfohl, H., Gallus, P., & Thomas, D. (2011). Interpretive structural modeling of supply chain risks. International Journal of Physical Distribution & Logistics Management, 41(9), 839–859. https://doi.org/10.1108/09600031111175816
- *Pitchaimuthu, S., Thakkar, J., & Gopal, P. R. C. (2019). Modelling of risk factors for defence aircraft industry using interpretive structural modelling, interpretive ranking process and system dynamics. Measuring Business Excellence, 23(3), 217–239. https://doi.org/10.1108/MBE-05-2018-0028
- *Prakash, S., Soni, G., Rathore, A. P. S., & Singh, S. (2017). Risk analysis and mitigation for perishable food supply chain: A case of dairy industry. Benchmarking: An International Journal, 24(1), 2–23. https://doi.org/10.1108/BIJ-07-2015-0070
- Pulido, A., Pérez, J., Dones, M., Rueda-Cantuche, J. .́., &., & Lahr, M. L. (2008). Obituary: Emilio Fontela Remembered. Economic Systems Research, 20(1), 129–131. https://doi.org/10.1080/09535310801892140
- Ragade, R. K. (1976). Fuzzy interpretive structural modeling. Journal of Cybernetics, 6(3-4), 189–211. https://doi.org/10.1080/01969727608927531
- *Rajesh, R. (2017). Technological capabilities and supply chain resilience of firms: A relational analysis using Total Interpretive Structural Modeling (TISM). Technological Forecasting and Social Change, 118, 161–169. https://doi.org/10.1016/j.techfore.2017.02.017
- *Rajesh, R., & Ravi, V. (2015). Modeling enablers of supply chain risk mitigation in electronic supply chains: A Grey–DEMATEL approach. Computers & Industrial Engineering, 87(Supplement C), 126–139. https://doi.org/10.1016/j.cie.2015.04.028
- *Rane, S. B., & Kirkire, M. S. (2017). Interpretive structural modelling of risk sources in medical device development process. International Journal of System Assurance Engineering and Management, 8(1), 451–464. https://doi.org/10.1007/s13198-015-0399-6
- Saaty, T. L. (1987). Rank according to Perron: A new insight. Mathematics Magazine, 60(4), 211–213. https://doi.org/10.2307/2689340
- Saaty, T. L. (2010). Principia mathematica decernendi: Mathematical principles of decision making: generalization of the analytic network process to neural firing and synthesis. RWS Publications.
- *Samvedi, A., Goh, M., de Souza, R. (2016). Handling network disruption risks for supply-chain information systems selection using fuzzy DEMOPSIS. In: Proceedings of the IEEE International Conference on Management of Innovation and Technology. https://doi.org/10.1109/ICMIT.2016.7605013
- *Samvedi, A., & Jain, V. (2013). A study on the interactions between supply chain risk management criteria using fuzzy DEMATEL method. International Journal of Operational Research, 18(3), 255–271. https://doi.org/10.1504/IJOR.2013.056685
- Sargut, G., & McGrath, R. G. (2011). Learning to live with. Harvard Business Review, 89(9), 68–76.
- Saxena, J. P., Sushil., & Vrat, P. (1990). Impact of indirect relationships in classification of variables—a MICMAC analysis for energy conservation. Systems Research, 7(4), 245–253. https://doi.org/10.1002/sres.3850070404
- Schwenk, C. R. (1985). Management illusions and biases: Their impact on strategic decisions. Long Range Planning, 18(5), 74–80. https://doi.org/10.1016/0024-6301(85)90204-3
- *Sen, D. K., Datta, S., & Mahapatra, S. S. (2018). On evaluation of supply chain's ecosilient (g-resilient) performance index: A fuzzy embedded decision support framework. Benchmarking: An International Journal, 25(7), 2370–2389. https://doi.org/10.1108/BIJ-03-2017-0038
- Senge, P. M. (2006). The fifth discipline. (2nd ed.). Random House Business.
- Settanni, E., Srai, J. S., Kumar, M. (2018). Identifying risk interdependencies in pharmaceutical supply chains through gamification-enabled structural modelling. In: Proceedings of the 49th Annual Meeting of the Decision Sciences Institute (pp. 731–745).
- Shieh, J.-I., & Wu, H.-H. (2016). Measures of consistency for DEMATEL method. Communications in Statistics - Simulation and Computation, 45(3), 781–790. https://doi.org/10.1080/03610918.2013.875564
- Simon, H. A., Dantzig, G. B., Hogarth, R., Plott, C. R., Raiffa, H., Schelling, T. C., Shepsle, K. A., Thaler, R., Tversky, A., & Winter, S. (1987). Decision making and problem solving. Interfaces, 17(5), 11–31. https://doi.org/10.1287/inte.17.5.11
- *Singh, R. K., Gupta, A., & Gunasekaran, A. (2018). Analysing the interaction of factors for resilient humanitarian supply chain. International Journal of Production Research, 56(21), 6809–6827. https://doi.org/10.1080/00207543.2018.1424373
- *Song, W., Ming, X., & Liu, H.-C. (2017). Identifying critical risk factors of sustainable supply chain management: A rough strength-relation analysis method. Journal of Cleaner Production, 143, 100–115. https://doi.org/10.1016/j.jclepro.2016.12.145
- *Srivastava, S. K., Chaudhuri, A., & Srivastava, R. K. (2015). Propagation of risks and their impact on performance in fresh food retail. The International Journal of Logistics Management, 26(3), 568–602. https://doi.org/10.1108/IJLM-02-2014-0032
- Strang, G. (1986). Introduction to Applied Mathematics. Wellesley-Cambridge Press.
- Suh, S., & Heijungs, R. (2007). Power series expansion and structural analysis for life cycle assessment. The International Journal of Life Cycle Assessment, 12(6), 381–390. https://doi.org/10.1065/lca2007.08.360
- *Sun, W. Y., Lin, W. T. (2011). Application Fuzzy DEMATEL to develop a cause and effect model of risk in supply chain. In: Proceedings of the International Conference on Management and Service Science. https://doi.org/10.1109/ICMSS.2011.5998293
- Sushil, (2017). Modified ISM/TISM process with simultaneous transitivity checks for reducing direct pair comparisons. Global Journal of Flexible Systems Management, 18(4), 331–351. https://doi.org/10.1007/s40171-017-0167-3
- Sushil, (2018). How to check correctness of total interpretive structural models? Annals of Operations Research, 270(1), 473–487. https://doi.org/10.1007/s10479-016-2312-3
- Thomason, M. G. (1977). Convergence of powers of a fuzzy matrix. Journal of Mathematical Analysis and Applications, 57(2), 476–480. https://doi.org/10.1016/0022-247X(77)90274-8
- *Tseng, C.-P., Chen, C.-W., & Tu, Y.-P. (2011). A new viewpoint on risk control decision models for natural disasters. Natural Hazards, 59(3), 1715–1733. https://doi.org/10.1007/s11069-011-9861-1
- *Venkatesh, V. G., Rathi, S., & Patwa, S. (2015). Analysis on supply chain risks in Indian apparel retail chains and proposal of risk prioritization model using Interpretive structural modeling. Journal of Retailing and Consumer Services, 26, 153–167. https://doi.org/10.1016/j.jretconser.2015.06.001
- Villacorta, P. J., Masegosa, A. D., Castellanos, D., & Lamata, M. T. (2014). A new fuzzy linguistic approach to qualitative Cross Impact Analysis. Applied Soft Computing, 24, 19–30. https://doi.org/10.1016/j.asoc.2014.06.025
- *Vishnu, C. R., Sridharan, R., Kumar, P. N., & Kumar, V. R. (2019). Analysis of the operational risk factors in public hospitals in an Indian state A hybrid DEMATEL-ISM-PROMETHEE approach. International Journal of Health Care Quality Assurance, 33(1), 67–88. https://doi.org/10.1108/IJHCQA-06-2018-0156
- *Wang, L. (2018). Research on Risk Management for Healthcare Supply Chain in Hospital. (Ph.D. thesis) Liverpool John Moores University.
- Warfield, J. N. (1973a). Binary matrices in system modeling. IEEE Transactions on Systems, Man, and Cybernetics, SMC-3(5), 441–449. https://doi.org/10.1109/TSMC.1973.4309270
- Warfield, J. N. (1973b). On arranging elements of a hierarchy in graphic form. IEEE Transactions on Systems, Man, and Cybernetics, SMC, 3(2), 121–132. https://doi.org/10.1109/TSMC.1973.5408493
- Warfield, J. N. (1974). Toward interpretation of complex structural models. IEEE Transactions on Systems, Man, and Cybernetics, SMC-4(5), 405–417. https://doi.org/10.1109/TSMC.1974.4309336
- Warfield, J. N. (1976). Societal systems: Planning, policy, and complexity. John Wiley & Sons, Ltd.
- Warfield, J. N. (1982). Interpretive structural modeling (ISM). In S.A. Olsen (Ed.), Group planning and problem-solving methods in engineering management. Wiley.
- Warfield, J. N. (2003). A proposal for systems science. Systems Research and Behavioral Science, 20(6), 507–520. https://doi.org/10.1002/sres.528
- Warfield, J. N., & Cárdenas, A. R. (1994). A handbook of interactive management (2nd ed.). Iowa State University Press.
- Warfield, J. N., & Staley, S. M. (1996). Structural thinking: Organizing complexity through disciplined activity. Systems Research, 13(1), 47–67. https://doi.org/10.1002/(SICI)1099-1735(199603)
- Waugh, F. V. (1950). Inversion of the Leontief Matrix by power series. Econometrica, 18(2), 142–154. https://doi.org/10.2307/1907265
- WEF [World Economic Forum] (2013). Perspectives on a Hyperconnected World: Insights from the Science of Complexity. World Economic Forum. https://www.weforum.org/reports/perspectives-hyperconnected-world
- WEF [World Economic Forum] (2018). The Global Risks Report. 2018 World Economic Forum.
- *Wu, K.-J., Liao, C.-J., Tseng, M.-L., Lim, M. K., Hu, J., & Tan, K. H. (2017). Toward sustainability: Using big data to explore the decisive attributes of supply chain risks and uncertainties. Journal of Cleaner Production, 142, 663–676. https://doi.org/10.1016/j.jclepro.2016.04.040
- *Wu, W.-S., Yang, C.-F., Chang, J.-C., Château, P.-A., & Chang, Y.-C. (2015). Risk assessment by integrating interpretive structural modeling and Bayesian network, case of offshore pipeline project. Reliability Engineering & System Safety, 142, 515–524. https://doi.org/10.1016/j.ress.2015.06.013
- *Yazdani, M., Chatterjee, P., Pamucar, D., & Abad, M. D. (2019). A risk-based integrated decision-making model for green supplier selection A case study of a construction company in Spain. Kybernetes, 49(4), 1229–1252. https://doi.org/10.1108/K-09-2018-0509
- *Zhao, G. Q., Liu, S. F., Lopez, C., Chen, H. L., Lu, H. Y., Mangla, S. K., & Elgueta, S. (2020). Risk analysis of the agri-food supply chain: A multi-method approach. International Journal of Production Research, 58(16), 4851–4876. https://doi.org/10.1080/00207543.2020.1725684