
 ?Mathematical formulae have been encoded as MathML and are displayed in this HTML version using MathJax in order to improve their display. Uncheck the box to turn MathJax off. This feature requires Javascript. Click on a formula to zoom.
Abstract
In this paper, we compare four policy instruments–tax, subsidy, binding emissions and cap-and-trade, to determine which policy is the most effective and whether they are equivalent. We also examine if a firm’s policy preference differs from that of a policymaker. Our motivation stems from the global use of a wide array of pollution instruments. Using a game theoretic approach, we analyze how carbon abatement, production quantity, profitability and welfare vary between different policy tools. We find that the tax policy is equivalent to the binding emission standards while welfare comparison shows that the highest welfare is attributed to either the tax or subsidy policy depending on the levels of environmental damage. We find that both the policymaker and the firm prefer a subsidy policy under lower thresholds of environmental damage. Exploring hybrid policies, we find that a multi-part tariff contract jointly implements the socially optimal outcomes and leads to a win-win situation for both the firm and the policymaker. Our findings offer guidance for policymakers and managers to implement appropriate policies based on the degree of environmental damage and to consider using hybrid policies that achieve higher pollution abatement and improved welfare.
1. Introduction
In response to the growing scientific evidence that human activities have contributed to climate change,Footnote1 policymakers have employed a variety of regulatory instruments to reduce carbon emissions. There is, however, a wide-ranging debate on the most effective environmental regulation for decarbonisation. Consider carbon tax for example that sets a price on carbon by levying a tax on greenhouse gas emissions.Footnote2 Deemed an effective instrument, a carbon tax is considered an enforceable, scalable, and transparent solution to limiting carbon emissions.Footnote3 To stress the need for carbon tax, 3600 economists in 2019 supported the introduction of a carbon tax in the US stating it as the most cost-effective lever to reduce carbon emissions.Footnote4 Several countries globally have adopted carbon taxes including Canada, Germany, Portugal, Norway and Sweden.Footnote5 Canada’s emission-based carbon tax charges $30 per metric tonne of CO2 equivalent,Footnote6 whereas, in the U.S., the Environmental Protection Agency (EPA), levies a penalty of ‘$5.50 for every 0.1 mpg over the standard’ for non-compliance to Corporate Average Fuel Economy (CAFE) standards.Footnote7 Carbon pricing, therefore, has emerged as a popular instrument.
Carbon pricing also includes cap-and-trade instrument, though its different in design and implementation from carbon tax. Whereas carbon tax sets the price of carbon emissions, and allows the firm to determine the quantity of carbon emissions, cap-and-trade in contrast determines the quantity of carbon emissions and lets the market determine the price. The World Bank reported that out of 61 carbon pricing policies implemented by industrialised nations and emerging economies, 30 have adopted carbon taxes and 31 have embraced emissions trading systems,Footnote8 reflecting the varied viewpoints of policymakers in choosing the appropriate policy instruments. In Europe, for example, the Emission Trading Scheme (ETS) was one of the first cap-and-trade programs to be introduced.Footnote9 The Canadian provinces of Quebec and Nova Scotia have implemented cap-and-trade programs beginning 2012Footnote10 and 2019Footnote11 respectively.
As an alternative to these policy tools, the landmark Inflation Reduction Act in the US declared significant subsidies to businesses engaged in the development of clean energy to the tune of $3.6 billion.Footnote12 The choice of subsidy as a policy instrument is also indicative of the array of regulatory tools employed for decarbonisation. Here as well, subsidies differ in their design and effects compared to carbon tax. Carbon subsidies may increase the emission control of firms, and lead to innovation and growth of abatement efforts, however, the opportunity costs of providing such subsidies could be high for the government. Contrarily, carbon taxes generate tax revenues for the government but may cause prices to rise as firms transfer the taxes to consumers.
Another policy tool—obligatory pollution regulation has been formulated for many industrial sectors and countries as binding emission cuts.Footnote13 For instance, in a landmark judgement in the Netherlands, a court ruled that Shell must reduce its carbon emissions by 45% by 2030, reflecting the binding nature of policies to create pressure on corporate emitters.Footnote14
We, thus, observe that environmental policies span a range of regulatory approaches that include carbon pricing, subsidies and administrative mandates. Given the variety of regulatory instruments at play, the question of which policy tool is the most effective naturally arises. We ask if a cap-and-trade or a subsidy policy delivers higher abatement efforts than a carbon tax or binding emissions policy. Which policies do a manufacturer and a policymaker prefer? Are the policy tools able to deliver socially optimal outcomes, and if not, can hybrid policies deliver such outcomes? Our research goal in this paper is to seek answers to the above questions and quantify and compare the effectiveness of the different policy instruments in achieving carbon reduction.
To this end, we consider a problem where a manufacturer undertakes production quantity and abatement decisions in a carbon-sensitive market under the regulatory decisions of a policymaker.Footnote15 We examine the policy instruments from two key dimensions, namely, (i) production output and abatement effort and (ii) social welfare. Our analysis helps to determine if the manufacturer’s and policymaker’s preferences differ. We also propose a multi-part tariff contract and highlight the distinguishing characteristics of such a hybrid contract in achieving social objectives.
Scholarly work in examining individual policies such as carbon tax (Caro et al., Citation2013; Chen & Hao, Citation2015; Hu & Zhou, Citation2014; Yonghong & Zhongkai, Citation2015; Yang & Chen, Citation2018), subsidy (Ma et al., Citation2013; Li et al., Citation2014; Chen et al., Citation2019) and cap-and-trade (Bai et al., Citation2017; He et al., Citation2017; Ji et al., Citation2020; Kuiti et al., Citation2020; Xu et al., Citation2017) have received growing attention. However, much of this literature has not delved into a comparison of the policy tools and examined the policy preferences of entities. Furthermore, studies comparing policy tools (Cheng, Ji, et al., Citation2022; Liu et al., Citation2015; Nault, Citation1996; Yang et al., Citation2014; Yang & Xu, Citation2023; Zhang & Xu, Citation2013) have typically not conducted a welfare comparison and explored hybrid policies as a means to achieve social goals as we have attempted in this paper. Lastly, with the continuous development of carbon emission regulations in various economies, there remains a considerable opportunity to engage in discussions on the implementation of the right policies. Our paper aims to contribute to this effort.Footnote16
1.1. Findings and contributions
One of our main findings is that the market based instruments (e.g., tax) and command-and-control instruments (e.g., binding emissions) are equivalent in their outcomes, that is, a policymaker would achieve the same carbon reduction and social welfare using either of the regulatory instruments. Furthermore, the comparisons of different environmental policies show that their effectiveness is driven by the environmental damage from emissions. Therefore, policymakers should consider this factor while formulating policies. To this end, we find that the subsidy policy not only yields the highest social welfare when the environmental damage parameter is low, it also yields the firm the highest profit. Additionally, if the policymaker were to implement a socially optimal outcome, this would require a hybrid instrument, namely, a combination of tax, subsidy, and a lump-sum transfer. Such a hybrid instrument leads to a win-win outcome for both the policymaker as well as the firm.
A multitude of environmental policies are prevalent globally and have sparsely been compared in scholarly domain to understand if there are any equivalencies between the policies. The paper seeks to address this gap by presenting an integrated model of policy making-firm choices-and-consumer characteristics as observed in practice. The paper also highlights the interactive effects of a firm’s emissions and environmental damage on the policymaker’s choices, and provides directions in designing hybrid mechanisms to achieve socially optimal outcomes, while benefiting the manufacturer.
The remainder of the paper is organised as follows. In Section 2, we discuss the relevant background literature. Section 3 presents the model details. Section 4 discusses the four policies and related results. Section 5 discusses social optimality and multi-part tariff contract. Managerial insights and concluding remarks are presented in Section 6.
2. Literature review
Literature on regulations such as carbon tax (Cao et al., Citation2020; Sinayi & Rasti-Barzoki, Citation2018), subsidy (Cohen et al., Citation2016; Chen et al., Citation2021; Cheng, Chen, et al., Citation2022; Lebeau et al., Citation2016) and cap-and-trade policy (He et al., Citation2017; Kuiti et al., Citation2020) is varied. Since our paper relates to environmental policies on pollution control and abatement, we, first discuss studies examining individual policies and subsequently delve into those comparing multiple policy tools.
2.1. Carbon tax
In examining the influence of carbon tax, Hu and Zhou (Citation2014) and Chen and Hao (Citation2015) analyze the pricing and production decisions for a supply chain and competing firms, respectively. The studies show that the manufacturer absorbing the carbon tax will raise the prices for its end consumers. The studies, do not, however, model the government’s decision which is exogenous. Yang, Luo, et al. (Citation2017); Yang and Chen (Citation2018) and Li et al. (Citation2018) also focus on decisions of supply chain players in dyadic settings considering revenue sharing and cost sharing contracts. Here as well, the papers do not consider the policymaker’s decisions and welfare implications as we do in our study. Mahmoudi et al. (Citation2014) in contrast endogenise the government’s decision and analyze competition between two power plants. However, their model does not consider emissions-sensitive consumer demand or social welfare outcomes. Caro et al. (Citation2013) consider a social planner’s problem (endogenous decision) concerning a supply chain under carbon tax. Whereas the study does consider the abatement effort of supply chain players, our model analyzes both production and abatement efforts and conducts a comparative analysis of different policy tools.
2.2. Carbon subsidy
Studies have examined various subsidy models. Ma et al. (Citation2013) for example, study the impact of carbon subsidy in a closed-loop supply chain. The study models consumption subsidy in the reverse supply chain whereas our paper models abatement subsidy for a manufacturing firm in a different setting. Chen et al. (Citation2019) analyze the government’s subsidy in a manufacturer-retailer dyad. The study considers a subsidy towards the investment cost of the firm whereas our model considers a subsidy for the abatement effort of the firm. Furthermore, we compare different policy outcomes in contrast to the study. Lastly, Bao et al. (Citation2020) consider government subsidy in parallel supply chains where the subsidy applies to the production quantity of electric vehicles. Here as well, our model differs as we consider subsidy transfer for the manufacturer’s abatement effort.
2.3. Cap and trade
Studies considering cap and trade policies have looked at supply chain decisions primarily concerning manufacturer-retailer channels. Du et al. (Citation2015) for example study the supply chain decisions in a cap and trade system where the manufacturer faces uncertain demand. The demand is not emissions dependent though as we consider in our model. Ji et al. (Citation2020), Bai et al. (Citation2017) and Bai et al. (Citation2018) examine wholesale price, cost, revenue and investment-sharing contracts respectively, to achieve channel coordination. Xu et al. (Citation2017) and Yang, Zhang, et al. (Citation2017) also consider different coordination and cooperation models between supply chain players. Compared to previous studies, our paper examines the decisions of a manufacturer and policymaker and evaluates a hybrid contract that leads to socially optimal outcomes. Furthermore, we are interested in comparing environmental policies, whereas the above studies focus on coordination strategies under the cap and trade system.
2.4. Emissions standards
Pollution control literature has also examined the role of emission standards as a policy instrument, albeit to a limited extent (Ghosh et al., Citation2020; Lade & Lawell, Citation2015; Saint Jean, Citation2008). A popular and debated emission standard is the CAFE standards in the US where studies have examined vehicle design and attributes to meet the standards and lower greenhouse gas (GHG) emissions (Luk et al., Citation2016; Shiau et al., Citation2009). Abatement policies have also been studied by El Ouardighi et al. (Citation2021), who consider abatement policies under horizontal and vertical competition. However, they do not endogenise government decisions on abatement policy which is our focus.
Since we examine different environmental policies from a policymaker’s and firm’s perspective, our review also spans literature that compares policy instruments. We discuss them below and provide a research gap analysis to position the current work.
2.5. Studies comparing environmental policies
Among early works, Nault (Citation1996) compares tax and subsidy policies, and shows their equivalence (under certain conditions) in achieving policy outcomes. Song and Leng (Citation2012) compare three carbon emission policies, namely, carbon tax, carbon emission capacity and cap-and-trade for the single period news vendor problem. The study does not, however, endogenise government decisions or consider environmental damage as a key consideration in policy making. Krass et al. (Citation2013) examine a monopolistic firm’s technology choices under tax and subsidy regimes set by the regulator. Zhang and Xu (Citation2013) investigate the multi-item production planning problem in the presence of cap-and-trade and carbon tax policy in a stochastic environment. The authors show that the cap-and-trade and carbon tax policies are equivalent in controlling carbon emissions if the carbon trading price and carbon tax rate are the same. In a remanufacturing context, Liu et al. (Citation2015) compare three carbon emission policies, namely, carbon tax, carbon emission capacity and cap-and-trade by considering the remanufacturing decision with limited information about demand distribution. The authors find that a carbon tax is preferable for policymakers. Xu et al. (Citation2016) compare the carbon tax and cap-and-trade policy for multiple products by considering price-sensitive demand. Further, Cao et al. (Citation2017) compare cap-and-trade and low carbon subsidy policy (LCSP) by considering price as well as green-sensitive consumer demand. The authors show that at a lower value of environmental damage, LCSP is preferable for societal benefit. In recent work, Chen et al. (Citation2020) study the impact of cap-and-trade and carbon tax on clean innovation techniques.
While extant literature has focused on certain aspects of government regulations, prior work does not discuss the comparison of these policies by considering the price premium effect of abatement effort in the presence of government intervention. Yet, such effects must be considered as established from the demand-side (consumer behaviour) perspectives as they have an important bearing on a firm’s decisions (Tang & Zhou, Citation2012). Furthermore, emission standards’ comparison with other policy instruments has also received limited attention in the OM literature. We endogenise government decisions considering environmental damage caused by pollution. We examine policies that are preferable from the policymaker’s perspective versus those that are preferable to the firm. Using socially optimal results, we propose a multi-part tariff contract that creates a win-win result for both the firm and the government. In below, we provide a summary of extant literature and position our current work.
Table 1. Carbon tax and subsidy literature.
Table 2. Cap and trade literature.
Table 3. Literature comparing environmental policies.
3. Model
We begin with the model preliminaries.
3.1. The firm
We consider a manufacturing firm that produces and sells a good directly to consumers. The production of the good leads to pollution as a byproduct, where each unit of output leads to e > 0 units of pollution (called the initial emissions rate). Therefore, when the firm produces q units of output, the pollution generated is eq units (Yuyin & Jinxi, Citation2018). A linear relationship between pollution emission and production volume is a common consideration in literature (Ji et al., Citation2020) and applies to industry sectors where emissions may be linearly correlated to fuel consumption of the machine. Initial emission rate consideration allows us to examine the impact of heterogeneous values of e on firm’s equilibrium decisions and as we show later, also affects the policymaker’s choices. Under any given policy environment, the firm has two decision choices—how much to produce and abate, represented by respectively, in our model.
3.2. The consumer
We consider a representative consumer with the quadratic utility function
(1)
(1)
The utility function implies that the consumer values the abatement effort τ undertaken by the firm and is willing to pay more for each unit of the product she buys (Singh & Vives, Citation1984). The consumer maximises her consumer surplus (), yielding the following inverse demand function
(2)
(2)
where,
is the maximum willingness to pay,
denotes the slope of the inverse demand curve, Equation(2)
(2)
(2) indicates that as consumers learn that the firm undertakes an abatement effort, their maximum willingness to pay increases from θ to
Studies on the impact of environmentally friendly products and efforts on consumers’ willingness to pay have been examined both empirically and analytically. See Smith and Paladino (Citation2010) and references therein. The specification of the inverse demand curve in Equation(2)
(2)
(2) is also considered in Desai and Srinivasan (Citation1995), Desai (Citation2000), Tsay and Agrawal (Citation2000), Azevedo et al. (Citation2011), Dan et al. (Citation2012), Li et al. (Citation2019), as well as in Jena et al. (Citation2018); Wu et al. (Citation2019).
3.3. The government’s policy
The government sets a specific environmental policy. We consider four forms of regulation, namely, aggregate tax and subsidy policies, binding emissions standard and a cap-and-trade policy. We discuss the tax policy in this section, while the other policies are described in later sections.
Under the tax policy, the government imposes an aggregate fee on net emissions. t > 0, indicates that the government imposes a tax on each unit of pollution that is not abated. In our model, t is endogenously chosen by the government. When the firm abates equal to its initial emissions, it does not incur a tax.
3.4. The cost structure and profit function of the firm
Abatement effort is costly for the firm. We assume that the cost of abatement is increasing at an increasing rate in the level of abatement effort that is if represents the cost of abatement effort, then
and
To represent the convex, increasing function, we consider the cost function as
where,
denotes the coefficient of investment of abatement effort. The convex cost function is not restrictive and is a common assumption in literature (Bhaskaran & Krishnan, Citation2009; Banker et al., Citation1998; Hosseini-Motlagh et al., Citation2021; Savaskan & Van Wassenhove, Citation2006), which considers that abatement efforts are expensive to implement. β can also be interpreted as a measure of inefficiency of the abatement investment. Higher the inefficiency, higher the cost of abatement. In addition, the firm incurs a marginal cost of production, given by c > 0. Thus, under the tax policy, when an aggregate tax t is imposed on the firm, the profit of the firm is given by
(3)
(3)
where,
denotes the net emissions. Net emissions can be interpreted as follows – at the extreme, when τ = 0, the firm’s net emissions remain the same as initial emissions; when
the firm abates exactly equal to its initial emissions; whereas, for
the firm underabates. Thus,
results in a net tax outlay for the firm.
3.5. Environmental damage and social welfare
Emissions lead to environmental damage (ED). We assume that the total environmental damage is increasing at an increasing rate in the quantity of net emissions, that is, and
The above assumes that pollution damage leads to tangible losses and represents the notion of climate change that “a double increase in GHG emissions more than doubles the environmental damage costs” (Richard, Citation1995; Tahvonen, Citation1995). Environmental studies have highlighted that rise in GHG emissions and global temperature may not only lead to the world crossing several tipping points in the climate system but the impact of such warming on natural environment and economies could be severe (Stern, Citation2008). To reflect this damage, we therefore, consider the environmental damage function to be given by
(4)
(4)
Here, d > 0, denotes the environmental damage coefficient of the firm’s emissions. The environmental damage function indicates that not just emissions, but marginal emissions are increasing in the amount of net emissions.
Lastly, the social welfare function is given by the combination of consumer surplus, firm’s profit, revenue from the transfer and environmental damage, and is represented in EquationEquation (5)(5)
(5) .
(5)
(5)
where,
Note that the social welfare function includes the objectives of all the stakeholders – consumers surplus measuring the gains to the consumers, profit measuring the gains to the firm, the government’s revenue from the tax transfer by the firm, as well as the reduction in overall welfare gains due to the negative environmental damage. The environmental damage is subtracted indicating that production activity generates a negative externality in the form of environmental damage which lowers the overall welfare. The expression of social welfare in EquationEquation (5)
(5)
(5) is identical to that observed in the literature (see for e.g., Jacobs & Subramanian, Citation2012; Pal & Saha, Citation2014, Citation2015; Shao et al., Citation2017). Note that the tax penalty is essentially a transfer between the firm and the government.
provides all the notations used in our model. All proofs are presented in the Appendix. Under the parametric conditions outlined in the Appendix, all our equilibrium solutions are positive.
Table 4. Model notations.
3.6. The social optimum
As a benchmark scenario, we evaluate the first-best or the socially optimal level of production and the level of abatement. Our objective here is to understand how do the decentralised regulatory frameworks (considering aggregate tax, subsidy, emissions standard, or a cap-and-trade system) compare to the socially optimal outcome? More importantly, we are interested in understanding which of the regulatory frameworks yields the socially optimal outcome? Furthermore, if these regulatory frameworks cannot implement the socially optimal outcome, then are there hybrid options which achieve the social optimal? We discuss these in detail in subsequent sections. We present the optimal solutions, namely the optimal output, abatement effort, net emissions, and the social welfare under the social optimum (SO) in .
Table 5. Optimal solutions under the social optimum for the two cases.
The above is obtained by solving EquationEquation (5)(5)
(5) for optimal q and τ. From , note that
Thus, the socially optimal output is decreasing in the environmental damage parameter d. This follows by observing that the total environmental damage increases as output increases, given a level of abatement. This in turn lowers the social welfare. Therefore, as d increases, to lower the environmental damage, the socially optimal output decreases.
A similar pattern occurs when we evaluate the change in abatement with respect to d. Formally, as
is always satisfied in our model (please see the Appendix for details). Essentially, as the degree of environmental damage increases, more abatement is costly. Next, we ask what regulatory policies can the government use to implement the socially optimal outcome and investigate if there is an equivalence between them. We consider the four commonly observed policies.
4. Environmental policies
4.1. Model 1: Aggregate tax policy
We begin the study of government regulations by considering an environmental tax policy and analyze the following two-stage game between the government and the firm: In Stage 1, the government decides the aggregate tax t to maximise social welfare SW. Thereafter, in Stage 2 the firm observes t, and then chooses to maximise its profit. Demand is realised and tax is accrued. represents the timeline of decisions. The aggregate tax model is given by
(6)
(6)
(7)
(7)
Figure 1. Timeline of decisions.
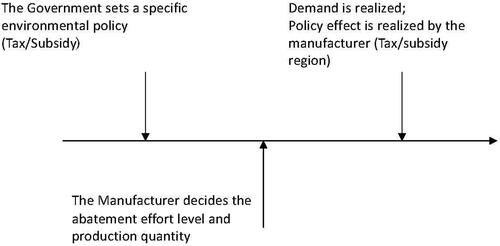
We solve the Stackelberg game backwards and compute the sub-game perfect Nash equilibrium. The equilibrium tax on net emissions chosen by the government, the production quantity and abatement effort chosen by the firm, the net emissions, profit and social welfare are given in .
Table 6. Equilibrium solutions for Model 1 – the aggregate tax policy.
The aggregate tax increases with an increase in the coefficient of the environmental damage (
), indicating that polluting firms with higher environmental damage face higher tax outlays. We next show how the abatement effort changes as the environmental damage coefficient d changes.
Remark 1.
(Impact of environmental damage on the abatement effort): The equilibrium abatement effort decreases with an increase in the coefficient of the environmental damage; i.e.,
Remark 1 shows that as the coefficient of environmental damage d increases, a polluting firm will not necessarily increase its abatement effort under the policymaker’s taxation policy. Contrary to expectations, the profit maximising firm, reduces its abatement effort. This is observed in practice. The Environmental Protection Agency’s proposed regulations for model year 2027 to control nitrogen oxide emissions from commercial trucks and buses in the US, led the Owner-Operator Independent Drivers Association and the Truck & Engine Manufacturers Association to remark that such regulations would raise the cost of new technology for existing vehicles and most manufacturers would not be able to produce a complying product.Footnote17
4.2. Model 2: Aggregate subsidy policy
We next consider an aggregate subsidy policy where the government provides a subsidy (s) to the firm in the form of a transfer payment for the abatement effort of the firm. The subsidy model is given by
(8)
(8)
(9)
(9)
The equilibrium subsidy chosen by the government, the production quantity and abatement effort chosen by the firm, the net emissions, profit and social welfare are given in .
Table 7. Equilibrium solutions for Model 2 – the aggregate subsidy policy.
Remark 2.
(Impact of environmental damage on the abatement effort): When the government provides a subsidy for abatement, an increase in the environmental damage coefficient decreases the optimal abatement effort; i.e.,
Surprisingly, even though the subsidy is provided for the abatement effort, when the environmental damage increases, the abatement effort decreases. The reason is that an increase in environmental damage and the abatement effort cost is not commensurate with the subsidy received. For policymakers, the important lesson to draw is that subsidy’s impact to increase abatement is limited by the environmental damage caused by the polluting firm. Metcalf (Citation2009) and Gugler et al. (Citation2021) argue in this context that the ability of subsidies to achieve key policy goals by reducing pollution-emanating activities is limited and that it is better to adhere to other policy instruments to achieve environmental goals. We analytically demonstrate the limitations of subsidy policy.
From a similar observation in the tax policy case (Remark 1), we infer that an individual policy instrument is limited by the degree of environmental damage. If the objective of the policymaker is to increase pollution abatement, a combination of policy regimes may result in better outcomes. We discuss one such hybrid policy instrument in §5.1.
4.3. Model 3: Binding limits on aggregate emissions policy
In this section, we consider a policy option, in which the government decides on a binding emissions standard, The European Union (EU) adopted binding annual emission targets in 2018 for its member states and sectors, such as, transport, buildings, agriculture etc.Footnote18 The policy reflects an administrative mandate that the firm has to achieve necessarily. The two-stage game between the government and the firm is as follows: Stage
The government chooses the binding emissions standard
to maximise social welfare. Stage
The firm observes
and then chooses the output to maximise its profit.
Before we solve the game, note that since there is a binding limit on emissions, it follows that the firm will abate exactly units of emissions. This implies that the profit of the firm and the social welfare function are given as,
(10)
(10)
(11)
(11)
We denote the equilibrium output, abatement effort, and social welfare using the notations and
respectively (). We present the comparative results in §4.5.
Table 8. Equilibrium solutions for Model 3 – the binding emissions standard.
Table 9. Optimal solutions for Model 4 – the cap and trade policy.
4.4. Model 4: The cap and trade policy
We discuss a commonly observed policy that is enforced in several geographies, namely, the cap-and-trade policy. Several local and national trading schemes have been implemented worldwide, for example, the Alberta Carbon Competitiveness Incentive Regulation, Beijing ETS, California ETS, EU ETS, Tokyo cap-and-trade system and several others (Stavins, Citation2020). The cap-and-trade policy is market driven (Mills et al., Citation2015; Stavins, Citation2008), that is designed with the objective of reducing carbon emissions and unlike the case of a pure taxation or subsidy policy, is both rewarding and penalising in nature.
In the cap-and-trade system we consider, a cap on the aggregate emissions is set exogenously, denoted by X. If the firm pollutes more than the total number of permits it has, then it has to buy more permits. Analogously, if it abates more and its emissions are lower than the cap, then the firm can sell the excess permits. Our model assumes that the firm can purchase or sell credits from the carbon market. Under such a policy, the profit of the firm is given by
(12)
(12)
In Equation(12)(12)
(12) , the first two terms denote the revenue less cost of production and cost of abatement effort, while the third term denotes the cost (or revenue) from the purchase (or sale) of permits. If
then the firm sells the extra permits given by
Similarly, if
then the firm buys the extra permits. We take the per unit price of permits to be given by η.
Our interest here is to derive the strategic decisions of the firm in the presence of a cap-and-trade regulation and examine any equivalency between the cap-and-trade regulation and other policy instruments. Under the cap-and-trade regulation, the optimal values are given in .
4.5. Comparative analysis
We compare the various environmental policies outlined in the previous sections. Our primary outcomes of interest across the various policies include the output produced, the abatement effort, and the social welfare. We begin with an equivalence result.
Proposition 1.
(Equivalence between binding emissions standard and aggregate tax policies) The output, abatement effort, and social welfare are identical under the binding emissions standard and aggregate tax policy.
An interesting insight is that the policymaker can achieve the same outcomes with respect to production quantity, abatement and social welfare using either the instrument of an aggregate tax on net emissions or a binding emissions standard. Analytically, t = 0, makes the objective functions of the firm and the government identical in both models. See the equivalence between EquationEquations (7)(7)
(7) and Equation(10)
(10)
(10) , and EquationEquations (6)
(6)
(6) and Equation(11)
(11)
(11) . As a result, there is a seamless transformation between the two policy regimes. Nationally binding standards have been debated and several countries have refrained from signing binding emission agreements in the past (Papadis & Tsatsaronis, Citation2020). We show in a straightforward analytical setting that a carbon pricing policy, that is, carbon tax and binding emissions deliver the same outcomes. Furthermore, while the carbon tax is a revenue generating mechanism, binding emissions is a non-revenue generating instrument. Proponents of carbon pricing would note therefore, that from a policy perspective, even command-and-control mechanisms can yield outcomes identical to that generated by pricing mechanisms.
We now compare the equilibrium solutions between the tax and the subsidy models.
Lemma 2.
(Comparison of quantity and abatement effort between the tax and subsidy models) There exist threshold levels of the damage coefficient d, such that
if
Lemma 2 states that the equilibrium quantity and abatement effort under the tax model are greater than those under the subsidy model provided the environmental damage parameter d is lower than a threshold or if d is greater than a threshold. For intermediate values of d (that is, values of d between the thresholds), the equilibrium solutions under the subsidy model are greater than those under the tax model. When the environmental damage parameter is low, the government lowers the optimal tax. As a result, the firm abates more, thereby reducing the tax penalty. The benefit of reducing the tax penalty more than offsets the transfer from the government in the form of a subsidy payment leading to higher production quantity and abatement decisions.
Furthermore, when d is above a threshold, the government increases the optimal tax (in the tax policy) and lowers the optimal subsidy (in the subsidy policy). Therefore, the firm has a greater incentive to abate more in the tax policy. Consequently, the firm also produces more in the tax policy. For moderate values of d, the converse is true. Here, the benefit of receiving a subsidy transfer from the government more than offsets the reduction in tax penalty due to the lowering of net emissions. As a result, production and abatement are higher in the subsidy regime.
Lemma 3.
(Comparison of quantity and abatement effort between the tax and cap and trade model) Comparing the equilibrium quantity and abatement effort under a tax policy with that under a cap and trade policy, we find that
Furthermore, the cap-and-trade model is equivalent to the aggregate tax model if the trading price (η) is equal to the optimal tax (
The intuition behind Lemma 3 is as follows. In the cap and trade model, the firm has to buy permits (that is, equivalently pay a tax) of η per unit of net emissions over its cap. As a result, if the penalty is less than η, the firm produces more under a tax policy as compared to a cap and trade policy. Furthermore, to keep the penalty lower, the firm also abates more. On the other hand, when
the penalty is the same in both regimes, leading to equivalence. Kaufman (Citation2016) notes the debate on the preferred choice of carbon pricing policy (that is, the carbon tax or cap-and-trade policy), and concludes that each has its own merit and depends on the design of the policy instrument. We demonstrate that the appropriate choice of tax or trading price creates equivalent outcomes in both these policies.
Lemmas 2 and 3 yield the following proposition.
Proposition 4.
(Comparison between the four policies: quantity and abatement) Comparing the equilibrium output and the abatement effort across the four policies, we have
Proposition 4 presents an ordering of the output and abatement efforts under the different policy choices. A key finding is that penalty or incentive schemes have the desired influence on a firm’s decisions. Crucially, depending on the magnitude of the environmental damage parameter, the government can choose the appropriate policy instrument to yield higher abatement effort as well as output from the firm. While a multitude of policy instruments may appear to pose a complexity of choices, we show that ultimately the choice of the appropriate instrument lies along a continuum.
We next compare the social welfare under the tax, subsidy and binding emissions policies.
Proposition 5.
(Social welfare comparison between tax, subsidy and binding emissions) The social welfare under a subsidy policy is conditionally greater than the social welfare under a tax policy (equivalently, binding emissions policy). Formally, there exist thresholds and
, such that
if
, and
otherwise. The expressions
and
are reported in the Appendix.
The intuition behind Proposition 5 follows from the fact that when the environmental damage parameter d is lower than a threshold, or larger than a threshold, the output, as well as the abatement effort under a tax policy, is greater than that under a subsidy policy. This leads to lower net emissions in the tax policy and thereby, lower environmental damage as well. Consequently, social welfare is also greater under the tax policy. For moderate values of d, the converse is true and social welfare under a subsidy policy is greater than that under a tax policy. Welfare comparison demonstrates clear choices for the policymaker under varying conditions of the environmental damage parameter.
4.6. Numerical analysis
Comparison of social welfare in the cap and trade policy poses some degree of analytical complexity and hence, we conduct a numerical analysis below. We assume the following values: θ = 700, c = 20, e = 10, α = 13, β = 16, γ = 7, and η = 30 within the bounds of the problem parameters.Footnote19 Our observations are robust to changes in problem parameters. For brevity, we show one set of results below. and show the welfare and profit plots respectively. shows the welfare comparison between tax, subsidy and social optimal values. shows the welfare comparison between cap and trade policy and social optimal values.
Figure 2. Social welfare comparison between the policies; θ = 700, c = 20, e = 10, α = 13, β = 16, γ = 7, η = 30. (a) Welfare comparison in tax, subsidy and social optimal cases. (b) Welfare comparison in cap and trade and social optimal cases
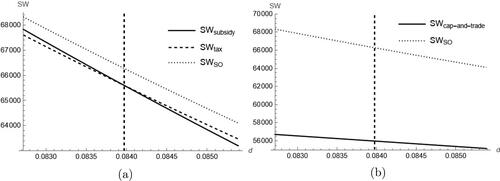
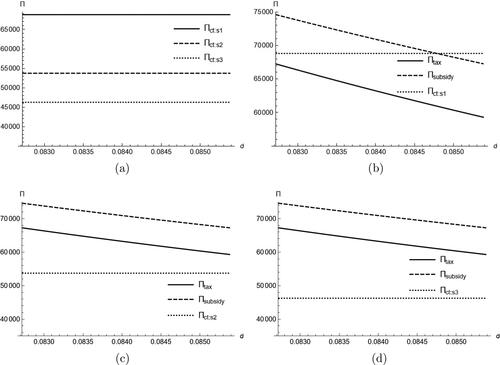
Figure 3. Profit comparison between the policies for parameter values θ = 700, c = 20, e = 10, α = 13, β = 16, γ = 7, s1: η = 30, X = 1500; s2: η = 35, X = 1000 and s3: η = 40, X = 800. (a) Firm’s profits in cap and trade policy in different scenarios. (b) Profits in tax, subsidy and cap and trade policy (s1). (c) Profits in tax, subsidy and cap and trade policy (s2). (d) Profits in tax, subsidy and cap and trade policy (s3).
4.6.1. Welfare comparison and the policymaker’s choice
From , we infer that the tax policy provides higher social welfare as d increases (above a threshold), whereas, the subsidy policy provides higher social welfare when d is lower than the threshold (see Proposition 5). Interestingly, cap and trade policy never maximises social welfare (among the three policies), and hence, is also not the optimal choice for the government (). We conclude that the government’s preference for a policy depends on the impact of net emissions on the environment, and in particular on the environmental damage parameter. Policymakers may be better off by adopting flexible policies that vary depending on the measures of environmental damage. Spearing (Citation2021) argues that policymakers should intervene by way of taxes that drive firms towards environmental initiatives. We find, however, that the welfare outcomes of such an intervention may not necessarily be beneficial. The specific choice of a policy instrument is more nuanced. When the extent of environmental damage is below a certain threshold, the subsidy policy is the policymaker’s preferred instrument.
4.6.2. Profit comparison and the firm’s preference
To examine the firm’s preference, we present a plot of the firm’s profit under the various policies (). In , we plot the firm’s profit for different values of cap and trading price. We consider three scenarios, s1: η = 30, X = 1500; s2: η = 35, X = 1000 and s3: η = 40, X = 800. The three scenarios depict an increase in the permit market price and a tightening of the cap. Conversely, one could interpret that the trading price falls when the regulations (cap) are easened. We notice that the firm incurs higher profits when there is slack in the market cap (s1), whereas profits are lower when the cap is stringent (s2 and s3) (see ).
show the comparison of the firm’s profits under different policies. We observe that the firm incurs higher profits under the subsidy policy. However, under increasing environmental damage and slack market cap, the firm incurs higher profits under the cap and trade policy ().
We find, therefore, that the subsidy transfer to the firm for its abatement efforts is the preferred policy for the firm (except under slack market cap). The firm’s resulting preference for a subsidy policy, thereby, leads to a preference convergence between the firm and the government, one where higher social welfare outcomes and higher profits for the manufacturer are observed. Our results explain why the electric vehicle manufacturers in Germany and the US have received significant subsidies to encourage them to invest in electric vehicles (equivalent to higher abatement effort) and in Shenzen, China where major bus operators were incentivised to transition to electric vehicles through annual subsidies per vehicle.Footnote20
The debate on which carbon policy to adopt has been ongoingFootnote21 and proponents of each policy outline several pros and cons of each policy. We demonstrate that there are outcome-based equivalencies in the policy continuum (vis-a-vis the abatement effort and production quantity). Additionally, social and profitability outcomes align, one that is preferable to the social planner as well as the firm (that is, the carbon subsidy policy below a threshold of environmental damage).
Policymakers also argue for the development of hybrid policies that combine some of the benefits of existing policies, and provide flexibility in decision making for firms (Frank, Citation2014). We explore such a policy in our paper and show that it achieves socially optimal outcomes.
5. Social optimality and contract
In our analysis above, we have examined different policies. An immediate observation is that none of the four policies yields socially optimal outcomes, as private and social objectives differ (). This naturally leads to the question – what contractual form can a social planner use to implement the socially optimal outcome? The question is particularly important in the context of increasing attention being paid by policymakers to designing regulatory instruments to lower environmental damage. To answer this question, we introduce a multi-part tariff contract and prove that it implements the first-best outcome.
5.1. Multi-part tariff contract
A multi-part tariff is a triplet where,
is a per unit tax (on net emissions),
is a subsidy to lower the cost of abatement for the firm, and
is a lump-sum transfer fee. Subsidies and fee transfers have increasingly been adopted in electric vehicle manufacturing by the state and federal governments in the US.Footnote22
implies that the firm receives a lump-sum transfer from the government. The triad of components is reflective of a flexible hybrid contract.
Under the multi-part tariff contract, the profit function of the firm is given by
(13)
(13)
where
is the profit that the firm earns under the tax policy.Footnote23 This constraint ensures that the firm does no worse (in the multi-part tariff contract) in comparison to the aggregate tax policy. We formalise the optimal contract below.
Proposition 6.
(The multi-part tariff contract:) The per-unit transfer fee , the cost sharing subsidy
, and the lump-sum transfer fee
in equilibrium, are given by
where
For the above contract parameters, the firm delivers socially optimal outcomes. When the environmental damage parameter d is large, the government wishes to disincentive the firm from producing too large an output. Therefore, it imposes a per unit fee The government also provides a cost-sharing subsidy smt to increase abatement effort. Imposition of the tax
lowers the profit of the firm. To compensate for this and to ensure that the individual rationality constraint binds, the government gives a lump sum transfer fee
to the firm. We conclude, therefore, that the triad of components in the contract, provides flexibility to the firm to undertake decisions that are equal to the first-best outcomes.
We show in that under the triad of components in the multi-part tariff contract, the production quantity and abatement effort are equal to the socially optimal outcomes and the manufacturer’s profits are equal to his profits in the tax policy (observe from the tables that and
).
Table 10. Comparison of production quantity and abatement effort decisions in the multi-part tariff contract with the socially optimal outcomes and firm’s profit in the tax policy; parameter values θ = 700, c = 20, d = 0.083–0.0845, e = 10, α = 13, β = 16, γ = 7; observe that and
6. Conclusion
The United Nations Climate Change Conference COP27 delivered a “package of decisions” designed to “cut greenhouse gases and adapt to the inevitable impacts of climate change”.Footnote24 Part of the agreements adopted at the conference highlight that transformation to a low-carbon economy will require government involvement as well as investments from stakeholders.Footnote25 It is expected, therefore, that strong environmental regulations be implemented in the forthcoming years. It is also imperative that clarity on the effectiveness of different environmental regulations be developed for both policymakers and firms to understand the right regulatory policies to choose. This paper attempts to draw insights into the effectiveness of four commonly observed policies. We make the following observations.
6.1. Insights for practice
We find that the policy instruments of taxation and binding emissions are equivalent to each other. Therefore, from a welfare viewpoint, the policymaker derives the same outcomes.
In contrast to the expectation that a firm will abate more when the degree of environmental damage increases, we find that the opposite holds true. Under both a tax as well as a subsidy policy, the optimal abatement effort decreases as the degree of environmental damage increases. Policymakers would note, therefore, that a wholesome increase in penalty or reward would not result in a greater reduction in carbon emissions. The reaction of the Owner-Operator Independent Drivers Association (in the example cited previously) to a regulation change in the US can be explained from this observation. Rather, hybrid policies will enhance pollution abatement efforts.
The tax and subsidy policy comparison shows that the choice of policy instrument depends on the magnitude of the environmental damage parameter. The highest welfare is attributed to the tax or subsidy policy under varying conditions of environmental damage. Interestingly, cap and trade policy never yields the highest social welfare.
Additionally, from a profitability standpoint, the subsidy policy is preferred by the firm. Therefore, the policy choice of a firm aligns with that of the policymaker. and summarise the preferences of the policymaker and the firm. Our results show that managers will be better off in a subsidy policy when the environmental damage from emissions is below a threshold. The result explains why subsidy grants in the US and EU have prompted large investments in green technologies, batteries, hydrogen, solar panels, wind turbines, and decarbonisation of steel manufacturing among others.Footnote26 Our results also demonstrate that when the degree of environmental damage increases, then a cap-and-trade system (albeit under a lenient market cap) benefits the manufacturer. The result paradoxically explains why some of the most polluting industries—oil and gas, cement and aluminium have benefited from cap and trade systems in part because carbon offset systems have been eased.Footnote27
Table 11. Welfare comparison and the policymaker’s preference, numerical comparison.
Table 12. Profit comparison and the firm’s policy preference, numerical comparison.
Lastly, policymakers would note that a triplet of transfer fee, cost sharing subsidy and lump-sum pay can achieve socially optimal outcomes. Such a contract also ensures that the firm is no worse off than the tax policy. Hybrid policies that combine the advantages of different policies are increasingly gaining traction in policy formulation (Goulder & Schein, Citation2009, Citation2013).Footnote28 van den Bergh et al. (Citation2021) suggest that integrating the positive attributes of a carbon tax, subsidy and a carbon market may likely have international acceptance and strengthen carbon mitigation. We analytically characterise such a contract that benefits both the firm and the policymaker.
6.2. Managerial insights
Our analysis obtains nuanced findings on the rankings of the four policies. Crucially, the degree of environmental damage is a critical factor influencing a firm’s decision of production and abatement. For lower thresholds of environmental damage, a subsidy policy yields the highest profit to the firm. However, under increasing environmental damage and a slack market cap, a cap-and-trade policy is most preferred by the firm. Thus, a firm’s profit and therefore incentives to invest in abatement technologies are dependent on the regulatory regime that it is operating under. Furthermore, managers may note that pricing instruments such as a tax on production emissions do not always lead to an increase in abatement effort in order to mitigate the penalty. This decision depends on the threshold of the degree of environmental damage.
6.3. Future research directions
This paper presents an integrated model of policy choices–firm’s decisions–and consumer characteristics that can be extended further to different supply chain structures. Specifically, models considering supplier and manufacturer entities where both or either face environmental regulations would be interesting to analyze. Another extension could be an analysis of environmental policies considering competing firms, with different production technologies or cost structures of abatement.
Our comparative models of regulatory instruments do not consider monitoring and auditing costs. These may further influence the policy choices of the regulator. Models that include these cost structures may help draw additional insights into policy decisions. Although debates are likely to continue on the relative merits of different carbon policy options, our study makes an attempt to contribute to the ongoing discourse. The present research work aims to build a platform for examining regulatory instruments and their effectiveness in reducing climate change.
Disclosure statement
The author(s) report there are no competing interests to declare.
Notes
1 Retrieved from: https://climate.ec.europa.eu/climate-change/causes-climate-change-en. Accessed on 7th July 2023
2 Retrieved from: www.worldbank.org/en/programs/pricing-carbon. Accessed on 10th July 2023
3 Retrieved from: https://mitsloan.mit.edu/ideas-made-to-matter/6-arguments-carbon-taxes. Accessed on 8th August 2023
4 Retrieved from: https://clcouncil.org/economists-statement/ Accessed on 7th October 2023
5 Retrieved from: www.carbontax.org/where-carbon-is-taxed-overview/. Accessed on 3rd December 2021
6 Retrieved from: www.carbontax.org/where-carbon-is-taxed-overview/canada-british-columbia/. Accessed on 5th March 2022
7 Retrieved from: www.eelp.law.harvard.edu/2019/08/corporate-average-fuel-economy-penalties/. Accessed on 6th February 2022
8 Retrieved from: https://openknowledge.worldbank.org/entities/publication/bcc20088-9fbf-5a71-8fa0-41d871df4625 Accessed on 16th September 2023
9 Retrieved from: www.ucsusa.org/resources/existing-cap-and-trade-programs-cut-global-warming-emissions. Accessed on 6th January 2022
10 Retrieved from: www.centreforpublicimpact.org/case-study/cap-and-trade-system. Accessed on 8th September 2021
11 Retrieved from: www.climatechange.novascotia.ca/nova-scotias-cap-trade-program. Accessed on 9th May 2022
12 Retrieved from: www.whitehouse.gov/wp-content/uploads/2022/12/Inflation-Reduction-Act-Guidebook.pdf Accessed on 9th May 2023
13 Retrieved from: www.bbc.com/news/world-europe-56828383. Accessed on 27th May 2022
14 Retrieved from: www.cnbc.com/2021/05/26/dutch-court-rules-oil-giant-shell-must-cut-carbon-emissions-by-45percent-by-2030-in-landmark-case.html. Accessed on 11th June 2022
15 Carbon sensitivity consideration allows us to introduce the demand-side effects of carbon abatement (Ghosh & Shah, Citation2015; Hammami et al., Citation2018)
16 Retrieved from: www.economist.com/finance-and-economics/2023/06/01/what-does-the-perfect-carbon-price-look-like. Accessed on 9th May 2023
17 Retrieved from: www.wsj.com/articles/epa-aims-to-cut-toxic-emissions-from-commercial-trucks-11646670626?page=1. Accessed on 13th April 2023
18 Retrieved from: https://ec.europa.eu/clima/eu-action/effort-sharing-member-states-emission-targets/effort-sharing-2021-2030-targets-and-flexibilities_en Accessed on 20th May 2022
19 The parametric values satisfy the concavity nature of the firm’s profit function, positive demand and social welfare function for all cases and meet all problem assumptions. Furthermore, the value of the parameters related to carbon emissions are based on the values from literature (see for example—the ‘Carbon Green Growth Roadmap for Asia and the Pacific’(https://shorturl.at/cxDEX), Lee (Citation2019) and Ritchie and Rosado (Citation2022)).
20 Retrieved from: www.ey.com/en_uk/government-public-sector/six-ways-that-governments-can-drive-the-green-transition Accessed on 23rd September 2023
21 Retrieved from: https://www.theguardian.com/environment/2013/jan/31/carbon-tax-cap-and-trade Accessed on 5th June 2023
22 Retrieved from: https://www.bnnbloomberg.ca/there-s-a-billion-dollar-bidding-war-for-ev-plants-across-the-us-1.1832076 Accessed 12th December 2022
23 For brevity, we illustrate how the multi-part tariff contract under the tax policy (and equivalently, the binding emissions policy) can implement the socially optimal outcome. A similar approach can be followed with the subsidy and the cap and trade policies.
24 Retrieved from: https://unfccc.int/cop27 Accessed on 6th December 2022
25 Retrieved from: https://unfccc.int/documents/624444 Accessed on 6th December 2022
26 Retrieved from: https://www.reuters.com/sustainability/year-europe-less-fearful-us-green-subsidies-push-2023-08-17/ Accessed on 1st September 2023
27 Retrieved from: www.theguardian.com/environment/2023/sep/19/do-carbon-credit-reduce-emissions-greenhouse-gases. Accessed on 7th October 2023
28 Retrieved from: https://www.theguardian.com/environment/2013/jan/31/carbon-tax-cap-and-trade Accessed on 18th June 2022
References
- Azevedo, S. G., Carvalho, H., & Machado, V. C. (2011). The influence of green practices on supply chain performance: A case study approach. Transportation Research Part E: Logistics and Transportation Review, 47(6), 850–871. https://doi.org/10.1016/j.tre.2011.05.017
- Bai, Q., Chen, M., & Xu, L. (2017). Revenue and promotional cost-sharing contract versus two-part tariff contract in coordinating sustainable supply chain systems with deteriorating items. International Journal of Production Economics, 187, 85–101. https://doi.org/10.1016/j.ijpe.2017.02.012
- Bai, Q., Xu, J., & Zhang, Y. (2018). Emission reduction decision and coordination of a make-to-order supply chain with two products under cap-and-trade regulation. Computers & Industrial Engineering, 119, 131–145. https://doi.org/10.1016/j.cie.2018.03.032
- Banker, R. D., Khosla, I., & Sinha, K. K. (1998). Quality and competition. Management Science, 44(9), 1179–1192. https://doi.org/10.1287/mnsc.44.9.1179
- Bao, B., Ma, J., & Goh, M. (2020). Short-and long-term repeated game behaviours of two parallel supply chains based on government subsidy in the vehicle market. International Journal of Production Research, 58(24), 7507–7530. https://doi.org/10.1080/00207543.2020.1711988
- Bhaskaran, S. R., & Krishnan, V. (2009). Effort, revenue, and cost sharing mechanisms for collaborative new product development. Management Science, 55(7), 1152–1169. https://doi.org/10.1287/mnsc.1090.1010
- Cao, K., He, P., & Liu, Z. (2020). Production and pricing decisions in a dual-channel supply chain under remanufacturing subsidy policy and carbon tax policy. Journal of the Operational Research Society, 71(8), 1199–1215. https://doi.org/10.1080/01605682.2019.1605471
- Cao, K., Xu, X., Wu, Q., & Zhang, Q. (2017). Optimal production and carbon emission reduction level under cap-and-trade and low carbon subsidy policies. Journal of Cleaner Production, 167, 505–513. https://doi.org/10.1016/j.jclepro.2017.07.251
- Caro, F., Corbett, C. J., Tan, T., & Zuidwijk, R. (2013). Double counting in supply chain carbon footprinting. Manufacturing & Service Operations Management, 15(4), 545–558. https://doi.org/10.1287/msom.2013.0443
- Chen, X., Chan, C. K., & Lee, Y. (2016). Responsible production policies with substitution and carbon emissions trading. Journal of Cleaner Production, 134, 642–651. https://doi.org/10.1016/j.jclepro.2015.10.083
- Chen, J.-Y., Dimitrov, S., & Pun, H. (2019). The impact of government subsidy on supply chains’ sustainability innovation. Omega, 86, 42–58. https://doi.org/10.1016/j.omega.2018.06.012
- Cheng, F., Chen, T., & Chen, Q. (2022). Cost-reducing strategy or emission-reducing strategy? The choice of low-carbon decisions under price threshold subsidy. Transportation Research Part E: Logistics and Transportation Review, 157, 102560. https://doi.org/10.1016/j.tre.2021.102560
- Cheng, P., Ji, G., Zhang, G., & Shi, Y. (2022). A closed-loop supply chain network considering consumer’s low carbon preference and carbon tax under the cap-and-trade regulation. Sustainable Production and Consumption, 29, 614–635. https://doi.org/10.1016/j.spc.2021.11.006
- Chen, X., & Hao, G. (2015). Sustainable pricing and production policies for two competing firms with carbon emissions tax. International Journal of Production Research, 53(21), 6408–6420. https://doi.org/10.1080/00207543.2014.932928
- Chen, Y-h., Wang, C., Nie, P-y., & Chen, Z-r (2020). A clean innovation comparison between carbon tax and cap-and-trade system. Energy Strategy Reviews, 29, 100483. https://doi.org/10.1016/j.esr.2020.100483
- Chen, X., Wu, Y., Ji, A., & Xu, X. (2021). Offering subsidies to logistics providers and consignors. Journal of the Operational Research Society, 72(1), 35–60. https://doi.org/10.1080/01605682.2019.1650622
- Cohen, M. C., Lobel, R., & Perakis, G. (2016). The impact of demand uncertainty on consumer subsidies for green technology adoption. Management Science, 62(5), 1235–1258. https://doi.org/10.1287/mnsc.2015.2173
- Dan, B., Xu, G., & Liu, C. (2012). Pricing policies in a dual-channel supply chain with retail services. International Journal of Production Economics, 139(1), 312–320. https://doi.org/10.1016/j.ijpe.2012.05.014
- Desai, P. S. (2000). Multiple messages to retain retailers: Signaling new product demand. Marketing Science, 19(4), 381–389. https://doi.org/10.1287/mksc.19.4.381.11793
- Desai, P., & Srinivasan, K. (1995). A franchise management issue: Demand signaling under unobservable service. Management Science, 41(10), 1608–1623. https://doi.org/10.1287/mnsc.41.10.1608
- Dong, C., Shen, B., Chow, P.-S., Yang, L., & Ng, C. T. (2016). Sustainability investment under cap-and-trade regulation. Annals of Operations Research, 240(2), 509–531. https://doi.org/10.1007/s10479-013-1514-1
- Du, S., Ma, F., Fu, Z., Zhu, L., & Zhang, J. (2015). Game-theoretic analysis for an emission-dependent supply chain in a ‘cap-and-trade’ system. Annals of Operations Research, 228(1), 135–149. https://doi.org/10.1007/s10479-011-0964-6
- El Ouardighi, F., Sim, J., & Kim, B. (2021). Pollution accumulation and abatement policies in two supply chains under vertical and horizontal competition and strategy types. Omega, 98, 102108. https://doi.org/10.1016/j.omega.2019.102108
- Frank, C. (2014). Pricing carbon: A carbon tax or cap-and-trade. Brookings Institute, 12, 1-4.
- Ghosh, D., & Shah, J. (2015). Supply chain analysis under green sensitive consumer demand and cost sharing contract. International Journal of Production Economics, 164, 319–329. https://doi.org/10.1016/j.ijpe.2014.11.005
- Ghosh, D., Shah, J., & Swami, S. (2020). Product greening and pricing strategies of firms under green sensitive consumer demand and environmental regulations. Annals of Operations Research, 290(1–2), 491–520. https://doi.org/10.1007/s10479-018-2903-2
- Goulder, L. H., & Schein, A. R. (2013). Carbon taxes versus cap and trade: A critical review. Climate Change Economics, 04(03), 1350010. https://doi.org/10.1142/S2010007813500103
- Goulder, L. H., Schein, A. (2009). Carbon taxes vs. cap and trade. Stanford University Working paper.
- Gugler, K., Haxhimusa, A., & Liebensteiner, M. (2021). Effectiveness of climate policies: Carbon pricing vs. subsidizing renewables. Journal of Environmental Economics and Management, 106, 102405. https://doi.org/10.1016/j.jeem.2020.102405
- Hafezalkotob, A. (2015). Competition of two green and regular supply chains under environmental protection and revenue seeking policies of government. Computers & Industrial Engineering, 82, 103–114. https://doi.org/10.1016/j.cie.2015.01.016
- Hammami, R., Nouira, I., & Frein, Y. (2018). Effects of customers’ environmental awareness and environmental regulations on the emission intensity and price of a product. Decision Sciences, 49(6), 1116–1155. https://doi.org/10.1111/deci.12302
- He, P., Dou, G., & Zhang, W. (2017). Optimal production planning and cap setting under cap-and-trade regulation. Journal of the Operational Research Society, 68(9), 1094–1105. https://doi.org/10.1057/s41274-016-0123-1
- Hosseini-Motlagh, S.-M., Ebrahimi, S., & Jokar, A. (2021). Sustainable supply chain coordination under competition and green effort scheme. Journal of the Operational Research Society, 72(2), 304–319. https://doi.org/10.1080/01605682.2019.1671152
- Hu, H., & Zhou, W. (2014). The impact of carbon tax policy on the carbon emission reduction and profit. International Journal of Smart Home, 8(5), 175–184. https://doi.org/10.14257/ijsh.2014.8.5.16
- Jacobs, B. W., & Subramanian, R. (2012). Sharing responsibility for product recovery across the supply chain. Production and Operations Management, 21(1), 85–100. https://doi.org/10.1111/j.1937-5956.2011.01246.x
- Jena, S. K., Ghadge, A., & Sarmah, S. P. (2018). Managing channel profit and total surplus in a closed-loop supply chain network. Journal of the Operational Research Society, 69(9), 1345–1356. https://doi.org/10.1080/01605682.2017.1392408
- Ji, T., Xu, X., Yan, X., & Yu, Y. (2020). The production decisions and cap setting with wholesale price and revenue sharing contracts under cap-and-trade regulation. International Journal of Production Research, 58(1), 128–147. https://doi.org/10.1080/00207543.2019.1641239
- Ji, J., Zhang, Z., & Yang, L. (2017). Carbon emission reduction decisions in the retail-/dual-channel supply chain with consumers’ preference. Journal of Cleaner Production, 141, 852–867. https://doi.org/10.1016/j.jclepro.2016.09.135
- Kaufman, N. (2016). Carbon tax vs. cap-and-trade: What’s a better policy to cut emissions?
- Krass, D., Nedorezov, T., & Ovchinnikov, A. (2013). Environmental taxes and the choice of green technology. Production and Operations Management, 22(5), 1035–1055. https://doi.org/10.1111/poms.12023
- Kuiti, M. R., Ghosh, D., Basu, P., & Bisi, A. (2020). Do cap-and-trade policies drive environmental and social goals in supply chains: Strategic decisions, collaboration, and contract choices. International Journal of Production Economics, 223, 107537. https://doi.org/10.1016/j.ijpe.2019.107537
- Lade, G. E., & Lawell, C.-Y C. L. (2015). The design and economics of low carbon fuel standards. Research in Transportation Economics, 52, 91–99. https://doi.org/10.1016/j.retrec.2015.10.009
- Lebeau, P., Macharis, C., & Van Mierlo, J. (2016). Exploring the choice of battery electric vehicles in city logistics: A conjoint-based choice analysis. Transportation Research Part E: Logistics and Transportation Review, 91, 245–258. https://doi.org/10.1016/j.tre.2016.04.004
- Lee, J. (2019). Operational decision model with carbon cap allocation and carbon trading price. Journal of Open Innovation: Technology, Market, and Complexity, 5(1), 11. https://doi.org/10.3390/joitmc5010011
- Li, J., Du, W., Yang, F., & Hua, G. (2014). The carbon subsidy analysis in remanufacturing closed-loop supply chain. Sustainability, 6(6), 3861–3877. https://doi.org/10.3390/su6063861
- Li, G., Li, L., & Sun, J. (2019). Pricing and service effort strategy in a dual-channel supply chain with showrooming effect. Transportation Research Part E: Logistics and Transportation Review, 126, 32–48. https://doi.org/10.1016/j.tre.2019.03.019
- Liu, B., Holmbom, M., Segerstedt, A., & Chen, W. (2015). Effects of carbon emission regulations on remanufacturing decisions with limited information of demand distribution. International Journal of Production Research, 53(2), 532–548. https://doi.org/10.1080/00207543.2014.957875
- Li, Q., Xiao, T., & Qiu, Y. (2018). Price and carbon emission reduction decisions and revenue-sharing contract considering fairness concerns. Journal of Cleaner Production, 190, 303–314. https://doi.org/10.1016/j.jclepro.2018.04.032
- Luk, J. M., Saville, B. A., & MacLean, H. L. (2016). Vehicle attribute trade-offs to meet the 2025 cafe fuel economy target. Transportation Research Part D: Transport and Environment, 49, 154–171. https://doi.org/10.1016/j.trd.2016.09.005
- Ma, W-m., Zhao, Z., & Ke, H. (2013). Dual-channel closed-loop supply chain with government consumption-subsidy. European Journal of Operational Research, 226(2), 221–227. https://doi.org/10.1016/j.ejor.2012.10.033
- Mahmoudi, R., Hafezalkotob, A., & Makui, A. (2014). Source selection problem of competitive power plants under government intervention: A game theory approach. Journal of Industrial Engineering International, 10(3), 1–15. https://doi.org/10.1007/s40092-014-0059-5
- Metcalf, G. E. (2009). Tax policies for low-carbon technologies. National Tax Journal, 62(3), 519–533. https://doi.org/10.17310/ntj.2009.3.10
- Mills, S., Rabe, B. G., & Borick, C. P. (2015). Cap-and-trade support linked to revenue use. Issues in Energy and Environmental Policy, (23), June 2015, Available at SSRN: https://ssrn.com/abstract=2651682.
- Nault, B. R. (1996). Equivalence of taxes and subsidies in the control of production externalities. Management Science, 42(3), 307–320. https://doi.org/10.1287/mnsc.42.3.307
- Pal, R., & Saha, B. (2014). Mixed duopoly and environment. Journal of Public Economic Theory, 16(1), 96–118. https://doi.org/10.1111/jpet.12056
- Pal, R., & Saha, B. (2015). Pollution tax, partial privatization and environment. Resource and Energy Economics, 40, 19–35. https://doi.org/10.1016/j.reseneeco.2015.01.004
- Papadis, E., & Tsatsaronis, G. (2020). Challenges in the decarbonization of the energy sector. Energy, 205, 118025. https://doi.org/10.1016/j.energy.2020.118025
- Richard, S. T. (1995). The damage costs of climate change toward more comprehensive calculations. Environmental & Resource Economics, 5(4), 353–374. https://doi.org/10.1007/BF00691574
- Ritchie, H., Rosado, P. (2022). Which countries have put a price on carbon? Our World in Data. https://ourworldindata.org/carbon-pricing.
- Saint Jean, M. (2008). Polluting emissions standards and clean technology trajectories under competitive selection and supply chain pressure. Journal of Cleaner Production, 16(1), S113–S123. https://doi.org/10.1016/j.jclepro.2007.10.009
- Savaskan, R. C., & Van Wassenhove, L. N. (2006). Reverse channel design: The case of competing retailers. Management Science, 52(1), 1–14. https://doi.org/10.1287/mnsc.1050.0454
- Shao, L., Yang, J., & Zhang, M. (2017). Subsidy scheme or price discount scheme? Mass adoption of electric vehicles under different market structures. European Journal of Operational Research, 262(3), 1181–1195. https://doi.org/10.1016/j.ejor.2017.04.030
- Shiau, C.-S N., Michalek, J. J., & Hendrickson, C. T. (2009). A structural analysis of vehicle design responses to corporate average fuel economy policy. Transportation Research Part A: Policy and Practice, 43(9–10), 814–828. https://doi.org/10.1016/j.tra.2009.08.002
- Sinayi, M., & Rasti-Barzoki, M. (2018). A game theoretic approach for pricing, greening, and social welfare policies in a supply chain with government intervention. Journal of Cleaner Production, 196, 1443–1458. https://doi.org/10.1016/j.jclepro.2018.05.212
- Singh, N., & Vives, X. (1984). Price and quantity competition in a differentiated duopoly. RAND Journal of Economics, 15(4), 546–554. https://doi.org/10.2307/2555525
- Smith, S., & Paladino, A. (2010). Eating clean and green? Investigating consumer motivations towards the purchase of organic food. Australasian Marketing Journal, 18(2), 93–104. https://doi.org/10.1016/j.ausmj.2010.01.001
- Song, J., & Leng, M. (2012). Analysis of the single-period problem under carbon emissions policies. In Handbook of Newsvendor Problems (pp. 297–313). Springer.
- Spearing, J. (2021). We need to look beyond the market to beat climate change. Financial Times. https://www.ft.com/content/bb92c7aa-aa1d-4797-9739-81ce1054ceaa
- Stavins, R. N. (2008). Cap-and-trade or a carbon tax? The Environmental Forum, 26, 16.
- Stavins, R. N. (2020). The future of US carbon-pricing policy. Environmental and Energy Policy and the Economy, 1, 8–64. https://doi.org/10.1086/706792
- Stern, N. (2008). The economics of climate change. American Economic Review, 98(2), 1–37. https://doi.org/10.1257/aer.98.2.1
- Tahvonen, O. (1995). Dynamics of pollution control when damage is sensitive to the rate of pollution accumulation. Environmental & Resource Economics, 5(1), 9–27. https://doi.org/10.1007/BF00691907
- Tang, C. S., & Zhou, S. (2012). Research advances in environmentally and socially sustainable operations. European Journal of Operational Research, 223(3), 585–594. https://doi.org/10.1016/j.ejor.2012.07.030
- Tsay, A. A., & Agrawal, N. (2000). Channel dynamics under price and service competition. Manufacturing & Service Operations Management, 2(4), 372–391. https://doi.org/10.1287/msom.2.4.372.12342
- van den Bergh, J., Castro, J., Drews, S., Exadaktylos, F., Foramitti, J., Klein, F., Konc, T., & Savin, I. (2021). Designing an effective climate-policy mix: Accounting for instrument synergy. Climate Policy, 21(6), 745–764. https://doi.org/10.1080/14693062.2021.1907276
- Wang, Z., Brownlee, A. E., & Wu, Q. (2020). Production and joint emission reduction decisions based on two-way cost-sharing contract under cap-and-trade regulation. Computers & Industrial Engineering, 146, 106549. https://doi.org/10.1016/j.cie.2020.106549
- Wu, J., Wang, H., & Shang, J. (2019). Multi-sourcing and information sharing under competition and supply uncertainty. European Journal of Operational Research, 278(2), 658–671. https://doi.org/10.1016/j.ejor.2019.04.039
- Xu, X., He, P., Xu, H., & Zhang, Q. (2017). Supply chain coordination with green technology under cap-and-trade regulation. International Journal of Production Economics, 183, 433–442. https://doi.org/10.1016/j.ijpe.2016.08.029
- Xu, X., Xu, X., & He, P. (2016). Joint production and pricing decisions for multiple products with cap-and-trade and carbon tax regulations. Journal of Cleaner Production, 112, 4093–4106. https://doi.org/10.1016/j.jclepro.2015.08.081
- Yang, H., & Chen, W. (2018). Retailer-driven carbon emission abatement with consumer environmental awareness and carbon tax: Revenue-sharing versus cost-sharing. Omega, 78, 179–191. https://doi.org/10.1016/j.omega.2017.06.012
- Yang, H., Luo, J., & Wang, H. (2017). The role of revenue sharing and first-mover advantage in emission abatement with carbon tax and consumer environmental awareness. International Journal of Production Economics, 193, 691–702. https://doi.org/10.1016/j.ijpe.2017.08.032
- Yang, Y., & Xu, X. (2023). Production and carbon emission abatement decisions under different carbon policies: Supply chain network equilibrium models with consumers’ low-carbon awareness. International Transactions in Operational Research. 1-31. https://doi.org/10.1111/itor.13242
- Yang, L., Zhang, Q., & Ji, J. (2017). Pricing and carbon emission reduction decisions in supply chains with vertical and horizontal cooperation. International Journal of Production Economics, 191, 286–297. https://doi.org/10.1016/j.ijpe.2017.06.021
- Yang, L., Zheng, C., & Xu, M. (2014). Comparisons of low carbon policies in supply chain coordination. Journal of Systems Science and Systems Engineering, 23(3), 342–361. https://doi.org/10.1007/s11518-014-5249-6
- Yonghong, C., & Zhongkai, X. (2015). The optimal emission reduction and pricing strategies and coordination based on the perspective of supply chain under carbon tax policy. Science Research Management, 36(6), 81.
- Yuyin, Y., & Jinxi, L. (2018). The effect of governmental policies of carbon taxes and energy-saving subsidies on enterprise decisions in a two-echelon supply chain. Journal of Cleaner Production, 181, 675–691. https://doi.org/10.1016/j.jclepro.2018.01.188
- Zhang, B., & Xu, L. (2013). Multi-item production planning with carbon cap and trade mechanism. International Journal of Production Economics, 144(1), 118–127. https://doi.org/10.1016/j.ijpe.2013.01.024
Appendix.
Proofs
For the existence of feasible solutions and to ensure that the equilibrium outcomes are positive, we assume the following: For Models and the multi-part tariff contract, we assume the following parametric conditions:
and
where,
and
Additional notations in the analysis are provided below. The notations are positive under the parametric assumptions above: and
Derivation of the socially optimal outcomes
The proof of case is straightforward and omitted for brevity.
For differentiating EquationEquation (5)
(5)
(5) w.r.t. q and τ, the first order conditions are given by
(A1)
(A1)
The second-order conditions are and
Solving the first order conditions, we get,
(A2)
(A2)
Substituting the optimal qSO, τSO from Equation(A2)(A2)
(A2) into EquationEquations (4)
(4)
(4) and Equation(5)
(5)
(5) , we have the environmental damage, and social welfare as
(A3)
(A3)
(A4)
(A4)
Aggregate tax policy
We first begin with the proof for the case Substituting
in the profit function, then the problem becomes
The first and second order conditions are given by
Hence the profit function is concave at the optimum value of Solving first order equation, the optimum value is
The expressions for equilibrium abatement effort, net emissions, profit and social welfare follow by substituting the equilibrium values of
For the first-order necessary conditions for the firm’s problem is given by
(A5)
(A5)
The second-order conditions are given by and
Therefore, the determinant of the Hessian is given by
and the firm’s profit function is jointly concave in q and τ. Solving the first order conditions, we get,
(A6)
(A6)
Substituting Equation(A6)(A6)
(A6) in Equation(6)
(6)
(6) , the first-order necessary condition with respect to t is
(A7)
(A7)
The second-order condition is From Equation(A7)
(A7)
(A7) , the optimal tax is given by
(A8)
(A8)
Substituting the optimal in Equation(A6)
(A6)
(A6) , we get,
and
The expressions for equilibrium net emissions and social welfare follow by substituting the equilibrium values of
and
Proof of Remark 1
Differentiating with respect to d, we get,
(A9)
(A9)
Aggregate subsidy policy
The Lagrangian function for manufacturers’ profit function is given by
(A10)
(A10)
The KKT conditions are
(A11)
(A11)
(A12)
(A12)
Case 1:
After substituting in KKT conditions, and solving the equations, we get,
(A13)
(A13)
After substituting the above values in EquationEquation (8)(8)
(8) , the first order condition of social welfare with respect to subsidy s is
(A14)
(A14)
The second-order condition is From Equation(A14)
(A14)
(A14) , the optimal subsidy is given by
(A15)
(A15)
Substituting the optimal in Equation(A13)
(A13)
(A13) , we have the optimal solution for output and abatement effort, social welfare as given in .
Case 2: λ = 0
After substituting λ = 0 in KKT conditions and solving the equations, we get,
(A16)
(A16)
After substituting the above values in EquationEquation (8)(8)
(8) , the first-order condition of social welfare with respect to subsidy s is
(A17)
(A17)
The second-order condition is From Equation(A17)
(A17)
(A17) , the optimal subsidy is given by
(A18)
(A18)
Substituting the optimal in Equation(A16)
(A16)
(A16) , we have the optimal solution for output and abatement effort, social welfare as given in .
Proof of Remark 2
Differentiating with respect to d, we get,
Binding limits on aggregate emissions policy
The first-order condition for the firm’s problem is
(A19)
(A19)
The second-order condition is Therefore, the firm’s profit function is concave in q and the second stage optimal value of the order quantity is given by
(A20)
(A20)
Moving to stage one, the first-order condition of the government’s problem is given by
(A21)
(A21)
The second-order condition is given by Hence the social welfare function is negative definite with respect to the binding emissions standard
and hence concave at the optimal value of
From Equation(A21)
(A21)
(A21) , we have the optimal emissions standard given as
which is positive for
Substituting the optimal solution for
into Equation(A20)
(A20)
(A20) , we have the optimal
The other optimal solutions follow directly by substitution into the inverse demand curve and the social welfare function.
Cap and trade policy
Differentiating Equation(12)(12)
(12) with respect to q and τ, the first order conditions are given by
(A22)
(A22)
The second-order conditions are given by Therefore, the determinant of the Hessian matrix is given by
by our assumption. Hence, the Hessian matrix is negative definite, implying that the firm’s profit function is jointly concave in q and τ. Solving the first-order conditions, we get
(A23)
(A23)
After substituting these optimal values in the profit function the profit function becomes πct =
The corresponding social welfare function under cap-and-trade policy is given by
Proof of Proposition 1
The proof follows from comparing the equilibrium values for the tax and binding emission models in and .
Proof of Lemma 2
Note that,
where,
Therefore,
where,
and
Proof of Lemma 3
Comparing the equilibrium solutions of cap and trade and aggregate tax model, we get and
Therefore, it follows that
and,
and
Proof of Proposition 4
From the proposition Equation(1)(1)
(1) , lemmas Equation(2)
(2)
(2) and Equation(3)
(3)
(3) , we can write as
Proof of Proposition 5
Note that,
Therefore,
where,
and
Thus, using proposition Equation(1)(1)
(1) , we can write,
if
and otherwise,
Proof of Proposition 6
The profit function under multi-part tariff contract is given by
(A24)
(A24)
The first order conditions are given by
(A25)
(A25)
Substituting the socially optimal values of in the first order conditions, the optimal values of t and s are given by
Substituting the value of and smt in the equation
the profit function under the multi-part tariff contract becomes
The profit function under tax model is given by
The firm’s individual rationality constraint requires Therefore,