
 ?Mathematical formulae have been encoded as MathML and are displayed in this HTML version using MathJax in order to improve their display. Uncheck the box to turn MathJax off. This feature requires Javascript. Click on a formula to zoom.
ABSTRACT
A common rationale for offering online courses in K-12 schools is that they allow students to take courses not offered at their schools; however, there has been little research on how online courses are used to expand curricular options when operating at scale. We assess the extent to which students and schools use online courses for this purpose by analyzing statewide, student-course level data from high school students in Florida, which has the largest virtual sector in the nation. We introduce a “novel course” framework to address this question. We define a virtual course as “novel” if it is only available to a student virtually, not face-to-face through their own home high school. We find that 7% of high school students in 2013–14 enrolled in novel online courses. Novel courses were more commonly used by higher-achieving students, in rural schools, and in schools with relatively few Advanced Placement/International Baccalaureate offerings.
Even before the onset of the COVID-19 pandemic, the use of online courses for K-12 students had been climbing dramatically over the last two decades. While there were only about 317,000 online enrollments in the K-12 sector in 2002–03, by 2009–10, over 1.8 million K-12 enrollments were taken online (National Center for Education Statistics, Citation2012). Enrollments have continued to grow since then, and a recent survey of principals found that over 21% of public schools reported offering their students access to at least some fully online courses (National Center for Education Statistics, Citation2016).
There are two common educational rationales provided for how online courses may benefit students.Footnote1 First, advocates argue that some students may be better served by online courses than in face-to-face courses due to the unique instructional environment they provide (Archambault et al., Citation2010; Bush, Citationn.d.). For instance, because online courses can be self-paced, students may benefit if their preferred pace is either faster or slower than their peers’.
Second, advocates argue that online courses may open up course options for students that are not available at their home institutions (Clark, Citation2008). For instance, students may be able to enroll in more advanced versions of courses than their home institution offers (e.g., by taking Advanced Placement [AP] US History when only a standard US history course is offered at the home institution), or by taking course subjects not offered at the home institution (e.g., by taking American Sign Language when no analogous class exists at the home institution).
While there has been a small but growing body of literature conducting large-scale evaluations of the extent to which online courses are associated with student performance for K-12 students (Ahn & McEachin, Citation2017; Cavalluzzo et al., Citation2012; Hart et al., Citation2019; Heinrich et al., Citation2019; Heissel, Citation2016; Heppen et al., Citation2017; Woodworth et al., Citation2015), the second justification has received far less attention from researchers looking at large populations of students (but see Darling-Aduana & Heinrich, Citation2020, looking at a single district). We fill this gap in the literature, using statewide administrative data from Florida to look descriptively at the types of classes that students take online that are not available at their home institutions (which we call “novel” online courses). We also look at school and student characteristics associated with using online classes to supplement existing offerings.
We find that a small but growing share of students enroll in novel online courses each year. We observe roughly 7% of Florida high school students taking novel online courses by 2013–14. We distinguish between cases where students take online courses that relatively few other students in their home institutions take – cases where we argue that students may be strategically using online options to supplement course offerings in their high school – and cases where schools seem to rely on online offerings to potentially outsource courses that might otherwise be offered through the home institution.
We find that students who attend certain types of schools – including rural schools and schools that have fewer AP offerings – are more likely to use online courses to supplement the courses available to them, and that the use of online courses to supplement course offerings is more common among certain student subgroups, including higher-achieving students, Asian students, more affluent students, and female students. We discuss the implications of these findings in a post-COVID era in the conclusion of the paper.
Prior literature and context
Opportunity to learn framework
In the face of long-standing gaps in the educational outcomes of students from different socioeconomic backgrounds, researchers have argued that one source of disparities is inequitable access to “opportunity to learn” (OTL). Originally conceived of as a construct to help researchers capture international differences in curricular coverage that were posited to explain variation in performance on cross-national tests (McDonnell, Citation1995; McPartland & Schneider, Citation1996), the concept of OTL has been broadened to include a range of resources that are needed for student academic achievement. In addition to curricula that are topically aligned to relevant assessments, such resources may include the quality of instruction provided; time spent covering particular concepts; the level of challenge provided in the classroom; high-quality, curriculum-aligned textbooks; and clear information about available academic opportunities (Cooper & Liou, Citation2007; Elliott & Bartlett, Citation2016; Floden, Citation2002; Scheerens, Citation2017). While definitions of what constitutes equal access are not firmly settled, researchers argue that without access to equal opportunities to learn, children will not be able to achieve equal educational outcomes (Guiton & Oakes, Citation1995).
While the traditional use of OTL frameworks tends to focus on the extent to which students are adequately prepared to meet standards to which they are held accountable—e.g., through state tests (Herman et al., Citation2000; Kurz, Citation2011)—researchers have also used the framework to consider disparities in access to resources that promote educational attainment (such as college enrollment) more broadly (Kimura-Walsh et al., Citation2009). Below, we review evidence that builds on this extension of the OTL framework to build intuition for our focus on online courses’ provision of opportunities for curricular intensification (taking more demanding courses; see, e.g., Domina & Saldana, Citation2012) or curricular expansion (which we define as taking courses generally not required for, or taken in, mainstream educational pathways). We review evidence on how curricular intensification and expansion may affect academic outcomes like college enrollment, and evidence on disparities in access to advanced-track or specialized courses in brick-and-mortar schools. Finally, we review arguments for why access to online courses may expand access to demanding or specialized curriculum. In the discussion section, we return to limitations around aspects of OTL that are not guaranteed simply by access to online courses that potentially expand the available curriculum.
Curricular intensification, curricular expansion, and student outcomes
A number of prior studies suggest that taking advanced or specialized courses is associated with stronger student outcomes. With respect to advanced course-taking, The College Board (Citation2014) argues that AP courses help develop college-level knowledge and skills; colleges may view enrollment in AP and other advanced courses as an indicator of student ability (National Research Council, Citation2002; Santoli, Citation2002), giving students who take these courses an edge in admissions. Indeed, observational evidence suggests that students who take more advanced courses—particularly AP courses—fare better in terms of college outcomes, including enrollment (Speroni, Citation2011) and graduation (Dougherty et al., Citation2006), although these correlational findings may be substantially attenuated with stronger controls for factors that influence students’ access to and likelihood of participation in these courses (Geiser & Santelices, Citation2006; Klopfenstein & Thomas, Citation2009; see Warne, Citation2017 for a nuanced review of this evidence).
Experimental and quasi-experimental evidence on the same question shows mixed evidence of downstream benefits to advanced secondary coursework.Footnote2 For instance, a difference-in-differences analysis in Texas shows that college graduation rates improved among students induced to take AP courses by the adoption of an incentive program rewarding students and teachers for passing scores on AP exams (Jackson, Citation2010). Likewise, studies using propensity score matching find that enrollment in more rigorous courses is positively associated with college enrollment, selectivity, and graduation (Attewell & Domina, Citation2008; Long et al., Citation2012). Finally, an instrumental variables analysis using national data shows that advanced course-taking is positively associated with adult labor outcomes (Rose & Betts, Citation2004).
Recent experimental evidence suggests mixed results when students are induced to take advanced options newly introduced to schools that previously lacked them. An experiment offering access to a new AP science course found benefits to students’ science skill and interest in pursuing STEM majors, but negative outcomes on grades, stress, and confidence in ability to succeed in college science (Conger et al., Citation2021). A follow-up to the same study found that while students who received offers to take AP courses aspired to more selective colleges, they were no more likely to enroll in such colleges (Conger et al., CitationForthcoming). Overall, the evidence base on curricular intensification suggests that students may see some downstream benefits to curricular intensification, although not necessarily in all domains.
Taking unique elective courses may also offer advantages to students, although there is less literature on this point. Elective courses are those not required to meet graduation standards, and they may allow students to explore individual interests more deeply. Conceptually, taking courses that allow students to explore specialized interests—for instance, by taking low-enrollment courses like American Sign Language or Forensic Science—may help them to develop firmer ideas of career or academic pathways they would like to explore in the future. Taking such courses may also demonstrate depth of interest in particular subjects to colleges. For instance, in a discourse analysis of college application essays, Do Monte Junior (Citation2019) elucidates how some successful US-based college applicants point to their enrollment in relevant electives to demonstrate passion for particular subjects and bolster their arguments for admission. Advice books by former college admissions officers also recommend strategically choosing electives that help craft a story about students will fit into a school in order to increase chances of admission to more selective schools (Kramer & London, Citation2006). Thus, students may expect advantages from taking courses that may allow them to stand out to admissions officers.
Access to curricular intensification and expanded curriculum
Despite the potential value of access to opportunities for students to take advanced or unique course offerings, students in some schools have systematically poorer access to advanced-track courses or varied course options (Gagnon & Mattingly, Citation2015; Long et al., Citation2012; Theokas & Saaris, Citation2013). For instance, a 2013 report found that nearly 30% of high schools nationwide had no students taking AP tests, although because these schools tended to be smaller than average, less than 10% of students attended schools with such sparse offerings (Theokas & Saaris, Citation2013). Small and rural schools tended to have sparse AP offerings; for instance, less than 60% of rural schools had AP students, compared to nearly 75% (85%) of urban (suburban) schools (Theokas & Saaris, Citation2013). Long et al. (Citation2012) found fewer differences across school size using a broader definition of rigorous courses that includes honors and upper-level courses, but their results still suggest that students in smaller schools are less likely to have access to rigorous courses in foreign languages and social studies in particular.
In addition to having fewer offerings of advanced courses, smaller high schools may also have less varied elective offerings. Larger high schools are more likely to offer a wide range of course offerings because the larger student population increases the likelihood that a niche course will receive enough enrollments to justify staffing it (Lee et al., Citation2000; Monk & Haller, Citation1993). These disparities in student access to rich curricular opportunities may contribute to persisting achievement gaps in US education.
Online courses and curricular intensification and expansion
Online courses have increasingly been discussed as a way to expand opportunities to learn for students. For instance, online courses may offer a cost-effective way to expand curricular opportunities for students in small or rural schools with more limited course offerings (Barbour & Mulachy, Citation2006; Barbour, Citation2007; de la Varre et al., Citation2014; Hannum et al., Citation2009). Survey evidence suggests that educators consider the ability of online courses to expand the existing curriculum to be among the most important potential benefits to virtual education. Roughly 75% of K-12 administrators surveyed from 2005–08 reported that the ability of online courses to provide access to courses “not otherwise available at the school” was an important reason for a district to offer fully online courses or blended courses, which offer some online and some face-to-face instructional components (Picciano & Seaman, Citation2007; Picciano et al., Citation2012). The ability to offer “Advanced Placement or college-level courses” was endorsed as an important benefit to online courses by roughly two-thirds of respondents (Picciano & Seaman, Citation2007; Picciano et al., Citation2012). Some districts have developed online course offerings specifically in an attempt to increase access to AP and elective offerings (Darling-Aduana & Heinrich, Citation2020).
A few experimental or quasi-experimental studies find benefits associated with access to rigorous online courses. The strongest evidence comes from a randomized controlled trial that extended access to an online Algebra I course to academically ready 8th-graders in schools that did not offer a similar on-ground course. It found that students given access to the online algebra course had higher math achievement at the end of 8th grade and were almost twice as likely to take advanced math coursework in high school than students without access (Heppen et al., Citation2011). A study of rural Tennessee high schools used propensity score matching to examine effects of a bundle of interventions including investment in academically rigorous online courses (Mokher et al., Citation2019). The intervention modestly improved AP participation, college enrollment, and college persistence, though effect sizes were not significant for all student cohorts. These studies suggest the potential benefits of online classes to expand access to advanced courses.Footnote3
While there is reason for optimism that online course access will enrich students’ curricular opportunities, there are also concerns over whether access to online courses, including for curricular expansion, may also be inequitably distributed. This is a concern even in a state like Florida where online course-taking is a statewide graduation requirement: online course-taking is more common among more affluent students and in areas with greater broadband availability, although broadband access does not positively predict online course-taking in models where controls for student and school SES are all included (Jacob et al., Citation2016).
While these questions are of growing importance, there has been little prior large-scale work exploring how students use online courses to access expanded course offerings. This paper fills this gap in the literature by providing descriptive evidence of the extent to which students access courses not otherwise available to them in their home institutions, the students most likely to use courses in this way, and the types of courses they take.
We look at students’ enrollment in novel courses in the context of Florida public schools. Florida is an ideal context for this study as it is at the forefront of the use of online education in K-12 schools. Florida is home to the largest state-run virtual school in the nation (Digital Learning Collaborative, Citation2020). Florida students took over 510,000 virtual course enrollments in 2017–18; the state with the next largest virtual course sector was North Carolina with just over 110,000 virtual enrollments (Digital Learning Collaborative, Citation2020). Florida is also one of a handful of states that includes online learning as a graduation requirement (Florida Department of Education, Citation2011). Students have the option to enroll part-time (e.g., in single courses) from the statewide Florida Virtual School or other state-approved online-course providers such as district-operated virtual instruction programs (Florida Department of Education, Citation2018). Students are not required to pay for these courses.Footnote4 They enroll for courses in consultation with guidance counselors at their home institutions, who may limit enrollment if students are not academically ready for a given class (Florida Department of Education, Citation2021). All instruction is provided by the virtual school where the student enrolls for the class. The widespread use of virtual course-taking in Florida makes it an ideal setting to explore to what extent a mature virtual sector is used by students to expand their curricular options.
Methods
Data and sample
We draw on administrative data from the Florida Department of Education (FLDOE), which maintains a rich trove of student and course-level data on all students in the state. Importantly, Florida data allows us to distinguish between the institution where students were enrolled while taking the course and the institution that provides instruction for the course. This allows us to observe students taking courses through online providers, but attending traditional brick-and-mortar schools as their primary institutions.Footnote5
We observe student course enrollments from 2005–06 to 2013–14. Most analyses focus on the 2013–14 school-year to provide the most recent picture of online course use. However, we also use prior years of data to establish trends over time. Because online course-taking is more prevalent among high school students than among younger students, we limit our sample to students in grades 9–12. We also limit our sample to traditional public schools, excluding such schooling options as Department of Juvenile Justice schools, alternative education programs, and schools serving hospital and homebound students. Importantly, we also exclude students in full-time virtual schools, so that our estimates here represent only the online course-taking patterns that supplement curriculum provided at traditional brick-and-mortar high schools. This yields a sample of 732,408 unique students in the 2013–14 school-year that comprises our main sample.
We draw on additional sources to measure school characteristics. Measures of urbanicity, choice status (e.g., charter/magnet status), and school demographics come from the National Center for Education Statistics Common Core of Data. Data on school grades (A-F) assigned by the Florida Department of Education come from the Florida School Indicator Reports.
Measures
Types of online course enrollments
We distinguish between four types of online course enrollments: duplicate, novel, supplemental, and displaced. Each of these course-taking measures captures whether a given student takes at least one online course of the specified type in a given academic year. Below we describe how we classify each type of virtual enrollment. also presents the classification rules visually in a flow chart, taking as an example a student enrolled in a Chinese 1 class through an online course provider. In some cases, a course that a student takes online (e.g., Chinese 1) is also offered face-to-face at her home high school. We classify such cases as “duplicate” enrollments, because the online course offering duplicates an enrollment opportunity already available to the student through face-to-face instruction.
Figure 1. Decision rules for classifying student virtual enrollments: Example of a virtual enrollment in Chinese 1.
However, this paper focuses on what we call “novel” online enrollments. We classify a course enrollment for a given student attending a given home high school as a novel virtual enrollment when (1) we observe the student taking the class through an online instructional institution and (2) no other students attending the student’s home high school took the same course (e.g., Chinese 1) through the home high school in the same academic year. When these conditions are met, we infer that the course was not offered face-to-face in the year that the student takes it, and thus, the use of the online course operates as an elective extending the student’s options past those available at her home institution.
We further categorize novel courses as either “supplemental” or “displaced” to identify two separate reasons why virtual courses may not be offered at a given high school. First, courses may not be offered if few students want to take them, either because they are very advanced (e.g., AP Physics) or because they represent relatively niche interests (e.g., Forensic Science). These may be online classes that students use strategically to pursue specialized interests or to differentiate themselves on college applications. Because of the limited density of students interested in these courses, it may not be reasonable for the high school to spend the money to staff sections of these classes face-to-face. We call these “supplemental” online courses since we infer that students use them to extend the curriculum beyond anything the high school would be likely to offer. We classify a novel course enrollment as supplemental when (1) no other student in their high school took the same course face-to-face in the same academic year, and (2) fewer than 15 students from the same high school took the course virtually.
Second, courses may not be offered face-to-face because schools elect not to staff classes despite healthy student interest in those courses. This may be at least partially due to the availability of online options to serve interested students; in other words, it may represent a strategic decision by schools to concentrate their staff time in other courses by outsourcing instruction to online providers for certain courses. We call these “displaced” online courses because high schools have a density of students interested in taking the course (as revealed by online enrollments), but the high school opts not to offer it despite the demonstrated interest. We classify a novel course enrollment as displaced when (1) no students took the same course face-to-face from the student’s home high school in the same academic year, and (2) at least 15 students were enrolled in an online version of the course in the same academic year.
While we use 15 students as the cut-off to distinguish between supplemental and displaced classes, in practice, the number of students from a given high school enrolled in supplemental classes is generally well below the 15-student threshold. For roughly 20% of supplemental course enrollments, the student enrolled is the sole person from their school taking that course in that year, while nearly two-thirds of supplemental enrollments represent cases where five or fewer same-school students are enrolled in the same course in the same academic year. This suggests that in most cases, the “supplemental” designation captures cases where schools would be unlikely to offer face-to-face options due to relatively light student demand.
School characteristics
We examine whether several types of school characteristics are associated with the likelihood that students take at least one online novel course. First, we characterize schools according to urbanicity (urban, rural, suburban, or town). To capture school performance, we characterize schools based on the grades they earn from the FLDOE as part of the state’s accountability system; D and F grades are combined because few schools earn such low grades. We also capture whether schools are charter or magnet schools vs traditional public schools. To capture school affluence, we characterize schools based on whether they have a relatively high (> 50%) vs relatively low (≤ 50%) share of students using free or reduced-price lunch (FRPL). Finally, we generate a variable that captures the number of AP or International Baccalaureate (IB) courses offered at each school as a way of distinguishing schools with relatively diverse vs more limited course offerings. We distinguish schools that offer fewer than 10 unique AP/IB courses from those that offer 10 or more such courses.
Student characteristics
We distinguish course-taking patterns by student grade (9–12), student sex (male vs female), race/ethnicity (white, black, Hispanic, Asian, multiracial or other race)Footnote6; exceptionality status (gifted, other exceptionality, nonexceptional); and English proficiency status (limited English proficient vs English proficient). We also distinguish students based on prior standardized test performance; we average students’ standardized Grade 8 math and reading scores on the Florida Comprehensive Assessment Test (FCAT), and create categorical variables that split students according to the quartile of FCAT average achievement that they fall into.
provides sample descriptive statistics for the 2013–14 school-year, the year we focus on for most analyses, for the overall sample and based on different types of novel virtual course-taking. These descriptive statistics suggest that higher-grade students and female students tend to be particularly over-represented in the sample of novel virtual course-takers (Column 2) compared to the overall sample (Column 1), while students using free and reduced-price lunch, students in special education, and students designed as limited English proficient (LEP) are all under-represented. Students taking novel virtual courses also have higher 8th grade standardized test scores compared to the overall sample. Students attending “A”-graded schools are somewhat over-represented among novel virtual course-takers, as are magnet school students. In general, groups that are over-represented among the novel virtual course-takers become over-represented to a slightly greater degree when we zero in on supplemental virtual course-takers (Column 3).
Table 1. Sample descriptive statistics, 2013–14 school-year.
Models
Analyses in this study are primarily descriptive. We document the classes most commonly taken as novel online courses, and trace trends in novel online course-taking rates over time.
We also examine student and school characteristics associated with taking novel online courses. To establish whether student or school characteristics are differentially associated with novel online course-taking, we conduct regressions using 2013–14 data that include a vector of dummy indicators for each set of student or school characteristics in turn. This allows us to estimate and compare the average rates of students from each group who take at least one online course. For instance, we estimate equations of the following form:
where AnyNovelCourseis is an indicator for whether student i attending home high school s takes at least one course that we categorize as a novel online course in 2013–14. We also estimate other models of the same form that substitute in outcomes indicating whether students take any supplemental online enrollments or any displaced online enrollments in 2013–14.
Each outcome is related to CharTypeis, which represents a vector that captures a single set of school characteristics of interest (e.g., urbanicity, school grade received from the FLDOE in 2013–14, etc.) or student characteristics of interest (e.g., student grade; sex; race; exceptionality status; English proficiency status; or quartiles capturing students’ performance on 8th grade standardized tests). Each set of characteristics is initially entered into the model in isolation, without any additional controls included.
Additional analyses include multiple sets of characteristics simultaneously in regressions to determine which school and student characteristics are most predictive of use of novel, supplemental, or displaced online courses, controlling for other factors. To explore school characteristics, we use 2013–14 data to estimate equations of the form:
where we estimate whether student i in school s takes at least one novel course in 2013–14 based on several different vectors of school characteristics, including urbanicity (Urbanicitys, distinguishing urban, rural, and town schools: suburban schools omitted); an indicator for whether a school offered fewer than 10 AP/IB courses (APScarces)Footnote7; a vector of indicators for FLDOE-assigned grades for the school (SchGrades, distinguishing A, B, and D/F schools: C schools omitted); an indicator for whether the share of the student body using free or reduced-price lunch is greater than 50% (HighPctFRLs) and a vector of indicators for whether the student’s home institution is a school of choice (Choices, distinguishing magnet and charter schools; traditional public schools omitted). These regressions identify which school-level factors are the most influential on online course-taking patterns, holding other factors constant.
A final set of school fixed effect regressions identifies which student-level characteristics are most influential, holding the high school that each student attends constant. As before, we use 2013–14 data to estimate equations of the following form:
This equation relates the outcome for student i attending home high school s to vectors of indicators for student grade (Gradei; grade 9 omitted); indicators for the quartile placement of students based on averaged math and reading 8th grade standardized test scores (Gr8Quartilei: quartile 2 omitted); student exceptionalities (Excepi: indicators for gifted status or other exceptionality; students with no exceptionalities omitted); limited English proficiency status (LEPi); use of free or reduced-price lunch (FRPLi); student sex (Femalei); and a vector of indicators for student race (Racei: indicators for Black, Hispanic, Asian, multiracial or other race; white omitted). We include a school fixed effect term θs to ensure that comparisons are made in relation to peers attending the same schools. All regressions run using EquationEquations (2)(2)
(2) and (Equation3
(3)
(3) ) include omitted variable dummies to preserve information from observations with missing data. All regressions use robust standard errors clustered at the school level.
Results
Trends over time in virtual course enrollment types
A growing number of Florida students have enrolled in virtual courses over time. traces the growth of the use of these courses. For each year, we document the share of unique students with at least one of each type of virtual enrollment. The solid line represents total virtual enrollments, and shows that nearly 20% of high school students took at least one virtual enrollment during the 2013–14 school-year.Footnote8 Many of these enrollments were “duplicate” enrollments (courses that were also offered face-to-face at their home high school).
Figure 2. Fraction of students with virtual enrollments by enrollment type, over time.
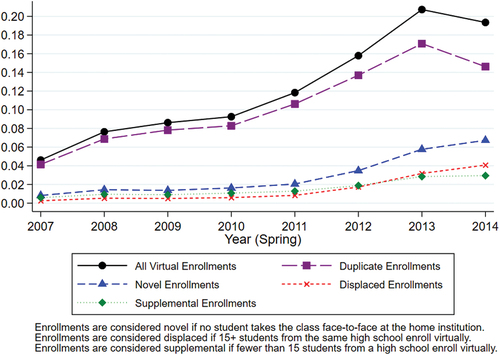
However, the total virtual enrollment and duplicate virtual enrollment lines diverge to a growing extent in later years, as novel course enrollments (courses that were not offered face-to-face) make up a larger share of students’ online course enrollments. By the 2013–14 school-year, nearly 7% of students took at least one novel virtual enrollment. Within the category of novel enrollments, the share of students taking supplemental enrollments (low total enrollment from student’s home institution) and displaced enrollments (high total enrollment from student’s home institution) grow at similar rates over time; nearly 3% (over 4%) of students took at least one supplemental (displaced) enrollment in the 2013–14 academic year. Note that students may take multiple types of virtual classes in a given year.
Although only a small share of students took each type of virtual enrollment in a given academic year, students accumulated greater probabilities of having ever taken each type of enrollment over the duration of their entire high school careers. Among students in 12th grade in the 2013–14 academic year, roughly 13% had taken at least one novel virtual enrollment throughout their high school careers. This included roughly 8% who had taken at least one supplemental virtual enrollment and 7% who had taken at least one displaced virtual enrollment; about 1.5% of students had taken at least one of both types of novel virtual course enrollments.
Courses taken through novel, supplemental, and displaced virtual enrollments
We next explore the types of courses for which students use online options to take novel course offerings not available in their home institutions. presents the 20 courses for which online novel course offerings make up the largest share of total enrollments statewide. The first column presents the total, statewide share of students enrolled in each class (including both virtual and face-to-face offerings) who took the course online as a novel virtual course opportunity (i.e., through online instructional providers where no student took the same course face-to-face in the student’s home high school). The next three columns respectively provide the total number of unique students taking the course as a novel virtual enrollment (Column 2), as a virtual enrollment generally (i.e., including both novel enrollments and duplicate enrollments; Column 3), and as face-to-face (FtF) enrollments (Column 4).
Table 2. Courses with highest share of total statewide enrollments through novel online enrollments, 2013–14.
The table shows that the classes taken as novel online enrollments include a mix of both courses often considered standard for a high school curriculum (e.g., Driver’s Education or Physical Education classes such as Health 1), as well as those serving students with more specialized interests (e.g., Latin, Social Media, Forensic Science). There are also a mix of courses that offer opportunities for unique advancement (e.g., Art History and Criticism 1 Honors or AP Computer Science A) or remediation (courses for credit recovery).
Columns 5 and 6 delve into the extent to which novel enrollments tend to represent either supplemental enrollments, where students fulfill niche interests, or displaced enrollments, which may represent strategic staffing decisions by schools. These columns document the share of total novel enrollments classified as supplemental or displaced, respectively. We observe two important patterns. First, for most courses on this list (15/20), a majority of novel enrollments represent supplemental, rather than displaced enrollments, although for an additional course (Social Media 1), displaced enrollments make up nearly half (49.7%) of novel enrollments. However, four of the top five courses on the list are dominated by displaced enrollments. This suggests that schools are not supplanting face-to-face instruction with virtual options for many classes, but where they do, the volume in those classes is substantial.
A related question is whether displaced enrollments represent cases where schools scale back face-to-face offerings, or whether they simply represent online courses that have become popular, but not at the expense of existing face-to-face offerings. provides evidence on this question for the six courses where displaced enrollments made up over half (or, in the case of Social Media, just under half) of novel enrollments. Columns 1–3 provide the count of unique enrollments in 2013–14 classified as displaced, virtual (including all novel and duplicate virtual enrollments), and face-to-face. To compare the latter column to historical numbers, Column 4 shows face-to-face enrollments for each course in 2005, when few students enrolled online.
Table 3. Displaced enrollments.
suggests that both explanations are at play for different classes. For some classes, notably Social Media and Reading for College Success, the “displaced” label may not strictly apply as these classes were created only after 2005 and therefore may not have had the opportunity to gain large face-to-face enrollments before online classes emerged as an option. Yet other classes, such as Parenting Skills, saw sharp reductions in face-to-face enrollments between 2005 and 2013, with comparable increases in virtual enrollments over the same period.
Driver’s Education presents an interesting case. The comparisons between face-to-face enrollments of the classroom-based Driver’s Education/Traffic Safety class in 2005 and 2013 show that face-to-face enrollments declined only modestly, even while virtual enrollments grew rapidly: While there were no virtual enrollments in 2005, there were nearly 30,000 by 2013. However, this is somewhat misleading. A second version of the Driver’s Education class, which included a lab-based component (i.e., driving practice), saw precipitous declines in face-to-face enrollments between 2005 and 2013; this is shown in the final row of . These two courses are substitutes for one another; only about 4% of students in our sample who take at least one of the Driver’s Education classes enroll in both formats. Taken together, these figures suggests that schools decreased their face-to-face driver’s ed offerings as online offerings grew in popularity.
These results illuminate variability in the ways that online courses are used to expand the high school curriculum. In some cases, they seem to be used strategically by schools to expand high school offerings by soaking up a level of student demand that could justify staffing a face-to-face version of a course in the absence of a virtual alternative (e.g., for Parenting Skills or Driver’s Education). In other cases, online courses seem to be used strategically by students to allow them to take offerings that are relatively specialized and that are unlikely ever to be staffed at many high schools (e.g., Latin 2). Although it still makes up a limited share of overall virtual enrollments, this latter use of online courses is notable because it accords well with the benefits of online courses predicted by virtual education advocates.
School characteristics associated with novel virtual course enrollments
We next conduct a series of regressions to determine whether rates of novel course-taking are different across schools based on different characteristics. We run regressions on one set of school characteristics at a time to tease out whether rates of novel virtual course-taking differ based on each set of school characteristics in turn. Regressions include a saturated set of mutually exclusive categories (e.g., for urbanicity, indicators for urban, rural, suburban and town are all included), and the constant term is suppressed. This means that coefficients can be interpreted as the fraction of unique students in each school type with at least one enrollment for each type of virtual enrollment studied (novel, supplemental, displaced). We also test whether coefficients are significantly different from each other within each set of characteristics. Results of these tests are given at the bottom of each panel and indicate differences at p ≤ .05.Footnote9 Within each set of characteristics, the group number for each subgroup is given next to the group label.
shows that when we consider novel virtual course-taking generally as the outcome (Column 1), rates of course-taking are relatively similar across different school types. For instance, although a higher share of students in rural schools (7.8%) than in urban schools (6.4%) take novel virtual enrollments, the difference between these groups is not statistically significant. There are some exceptions: Schools that earned “A” grades on the Florida state accountability system (7.4%) have a significantly higher rate of novel course-taking than do “C” schools (5.8%), more affluent schools (7.5%) have higher rates than do less affluent schools (6.1%), and magnet schools have higher rates (10.8%) than do traditional public schools (6.5%) or charter schools (6.2%). However for the most part, differences across groups are modest. This seems to be largely driven by a lack of differentiation in course-taking rates between school types for displaced courses (Column 3).
Table 4. Rates of novel virtual course-taking, by school characteristics, 2013–14.
However, differences based on school characteristics emerge more clearly when rates of supplemental virtual course-taking are the outcome (Column 2). Supplemental virtual course-taking rates are significantly higher in rural schools (3.8%) than in suburban (2.8%) or urban (2.8%) schools, although the rates of novel course-taking overall and displaced virtual course-taking do not differ by urbanicity. Likewise, students in schools with fewer AP/IB opportunities are more likely (3.8%) to take supplemental enrollments than are those in schools with more AP/IB options (2.8%), but we see no difference between these schools on displaced enrollments.
A similar set of patterns remains when we include all characteristics together in a multivariate regression: For each enrollment type, magnet school students are more likely than their peers in other school settings to take online courses to expand school offerings (, Columns 1–3), but other characteristics are less consistently predictive. High rates of school poverty (> 50% of students on FRPL) are negatively associated with supplemental course-taking, while rural location and AP/IB sparsity are also significant and positive predictors of the likelihood of taking supplemental enrollments (Column 2).
Table 5. Multivariate regressions with school-level variables predicting novel virtual course-taking, 2013–14: School fixed effects estimates.
These analyses suggest that, in accordance with predictions, students in schools with sparser elective options seem more likely to avail themselves of online courses that they use to extend the curriculum to take relatively specialized offerings. At the same time, more affluent schools, as well as magnet schools, seem especially disposed to the use of online courses to promote course-taking for options not offered in the home high school.
Student characteristics associated with novel virtual course enrollments
We next explore student characteristics associated with the likelihood of taking different types of virtual enrollments. Similar to provides results from regressions where mutually exclusive, exhaustive vectors of indicator variables for a single set of characteristics (e.g., exceptionality status) are entered in turn. Like for , the coefficients represent the fraction of students in each subgroup who take at least one of each type of enrollment indicated in the column headers in 2013–14, and results from tests of whether the group means differ from each other at p ≤ .05 are presented in the bottom row of each panel.
Table 6. Rates of novel virtual course-taking, by student academic characteristics, 2013–14.
We observe more consistent variation in course-taking patterns based on student academic placement characteristics than across school characteristics (). For instance, 11th and 12fth graders are more likely to take novel courses generally (Column 1) than are younger students (Panel A). This is driven both by higher supplemental course-taking for higher-grade students (Column 2), and for 11th graders in particular, by a greater use of displaced courses compared to all other grades (Column 3).
Novel virtual course-taking rates are monotonically higher for students higher in the FCAT quartile distribution (Panel B, Column 1). This is driven by the fact that higher achieving students make greater use of supplemental courses (Column 2). However, achievement is associated with use of displaced courses only at the lowest end of the skill distribution. Very low-scoring (quartile 1) students are less likely to be in enrolled in displaced courses than are other students, but there are no significant differences between other groups for these courses.
We see a similar pattern for student exceptionality (Panel C). Gifted students (4.1%) are more likely than students with no exceptionalities (3.0%) to use supplemental virtual courses (Column 2), who are more likely to take supplemental enrollments than students in special education (1.7%). While the distinction between special education students (2.8%) and the other groups remains for displaced enrollments (Column 3), gifted (4.6%) and nonexceptional students (4.2%) take displaced enrollments at similar rates. Finally, students with limited English proficiency are consistently less likely to take each type of virtual enrollment compared to students not designated as limited English proficient (Panel D).
We also observe consistent differences across students of different demographic characteristics (). Female students are more likely to take each type of virtual enrollment than are male students (Panel A), and students using free and reduced-price lunch are less likely to take each type of virtual enrollment than are more affluent students (Panel C). With respect to race/ethnicity (Panel B), Asian students have particularly high rates of novel virtual course-taking (8.5%), driven by high rates of supplemental virtual course-taking (5.2%); they are statistically no more likely than any other group to take displaced enrollments. Multiracial students also have high rates of novel virtual course-taking of all types; this suggests that Asian and multiracial students use virtual courses especially strategically to expand course offerings.
Table 7. Rates of novel virtual course-taking, by student demographic characteristics, 2013–14.
The general trends observed in are repeated in when we enter all student covariates simultaneously into a multivariate regression. Because these regressions include fixed effect terms for the student’s home high school, the model compares the likelihood of novel virtual course-taking among students attending the same school. Higher-grade and higher-achieving students are more likely to take novel virtual courses than their peers (Column 1), driven by higher use of supplemental enrollments (Column 2), while lower-achieving students, students enrolled in special education, or limited English proficient students are less likely to use such enrollments. Also similar to the results in , female students have higher rates of novel virtual course-taking than do males, while students using subsidized lunch have lower rates compared to their more affluent peers. Patterns of racial differences do not mirror as closely; notably, once other covariates are controlled, all other racial groups are more likely to take novel and supplemental courses compared to white students (omitted).
Table 8. Multivariate regressions with student-level variables predicting novel virtual course-taking, 2013–14: School fixed effects estimates.
Again, this pattern of results suggests that groups with higher average levels of achievement are particularly likely to use supplemental virtual courses, while there is less differentiation between students in the likelihood of enrolling in displaced virtual courses. This further suggests that the use of supplemental courses reflects strategic decisions by students.
Discussion
This paper explores how students use online courses to take courses not available at their home institutions. A growing share of students use online courses this way, with about 7% of students taking courses online that were not available in their home schools by 2013–14. These were split roughly evenly between enrollments that allowed students to take courses that were specialized and may have attracted too few enrollments from same-school peers to justify staffing a course, and enrollments where a sufficient density of same-school peers took the course to potentially justify staffing a face-to-face version of the course. Courses in the former group (supplemental enrollments) tended to represent courses that could allow students to take curriculum at nonstandard levels (either more advanced, like AP/IB courses, or credit recovery classes), or in subjects that were relatively specialized (e.g., Chinese, Creative Photography).
Consistent with the relatively specialized nature of many of these courses, students were most likely to take supplemental enrollments in rural schools and schools with limited curriculum (proxied by the number of AP/IB courses offered). Higher-achieving students were also more likely to take supplemental courses. These results suggest competing interpretations on the equity implications of virtual courses. By allowing students in schools with limited course offerings to take unique or advanced courses, they may improve equity among students across schools. However, because the students taking most advantage of these opportunities are those already best-poised for academic success, they may exacerbate inequality within schools.
Our study has important limitations. For instance, our analysis highlights students who accessed courses not readily available in their home high schools. In this sense, they expanded their opportunity to learn. At the same time, the OTL framework outlines a range of resources that must be in place for students to have truly equal educational opportunities. In addition to simply the availability of classes, the framework considers aspects like quality of curricular materials and instruction. Looking at those aspects is beyond the scope of this study, but these facets of OTL will have important implications for whether expanded access truly translates into improvements in downstream outcomes. The limited prior research on this question for advanced courses suggests this may be a concern (Barbour & Mulachy, Citation2006; de la Varre et al., Citation2014). If student performance in novel online courses is poorer than in face-to-face versions of the same courses, then the expansion of OTL represented by online options will not be fully realized.
In a similar vein, future work should explore conditions that best support the use of online courses to expand opportunity to learn. For instance, the OTL framework also includes the extent to which students have access to information and advice that allows them to fully choose among available educational options (e.g., Cooper & Liou, Citation2007; Kimura-Walsh et al., Citation2009). Future work should look into the role of counselors and teachers in connecting students to supplemental online courses—and the ways in which students understand and learn about opportunities to expand the curriculum through online classes—with an eye to promoting equitable use of such classes. Future work should also look into whether there are particular thresholds at which the use of online education to supplement the available curriculum becomes more likely; for instance, when the availability of AP or IB courses drops below a certain point.
There are generalizability limitations to the current study as well. For instance, Florida’s virtual sector is particularly large and mature, and students in states that have put fewer resources into virtual learning may see lower take-up of virtual courses to broaden access beyond existing face-to-face offerings. Importantly, this study also looks at online course-taking prior to the COVID-19 pandemic. Policymakers and schools invested to expand student access to devices and reliable wireless access during the pandemic (Klein, Citation2021; Slavin & Storey, Citation2020). If students’ pre-COVID-19 online course take-up was hampered by lack of devices or connectivity, continuation of these policies going forward may ease access to online courses. Moreover, students’ taste for online courses may have been altered by experiences during the pandemic. Students who enjoyed remote learning may be more likely to search out novel online learning opportunities going forward due to greater comfort with online courses than pre-COVID-19 students may have had. In contrast, students who struggled during remote learning may shy away from exploring novel course options through online instruction in the future. Researchers will do well to study how online courses are used post-COVID-19, and particularly whether the pandemic is associated with changes in how students use online courses to expand their curricular choices.
Despite these limitations, observing the historical use of supplemental enrollment is illustrative because this use of online courses is a common justification for the expansion of virtual offerings. While more research is needed, our study offers important initial information on how students and schools have used online courses to expand existing, face-to-face curricula.
Acknowledgements
The authors thank seminar participants in the Multidisciplinary Program in Education Sciences at Northwestern University for comments. Results, information, and opinions are the authors’ and do not reflect the views or positions of any funding agency or research partner.
Disclosure statement
No potential conflict of interest was reported by the authors.
Additional information
Funding
Notes on contributors
Cassandra M. D. Hart
Cassandra Hart is an associate professor in the School of Education at the University of California, Davis. Her work evaluates the effects of school, state, and national education policies and practices on overall student achievement, and on the equity of student outcomes.
Robert Linden
Robert Linden is a research fellow at Wheelhouse: The Center for Community College Leadership and Research at the University of California, Davis. His current research focuses on community college finance and policy.
Brian Jacob
Brian Jacob is the Walter H. Annenberg Professor of Education Policy and professor of public policy, economics and education at the Gerald R. Ford School of the University of Michigan, where he also co-directs the Youth Policy Lab. His primary fields of interest are labor economics, policy evaluation, and the economics of education.
Susanna Loeb
Susanna Loeb is professor of education at Stanford University, where she also serves as the director of the Annenberg Institute. Her research focuses broadly on education policy and its role in improving educational opportunities for students.
Notes
1 Other common rationales for online courses—such as the potential to offer courses less expensively—appeal to economic rather than educational advantages (Bush, Citationn.d.).
2 This evidence is especially important if factors other than curricular intensification per se—e.g., differences in teacher or peer quality in advanced courses (Long et al., Citation2012)—are the driving factors behind student outcomes.
3 While most arguments that online courses expand curricula focus on allowing acceleration, districts have also used them to support credit recovery. In Florida, students aiming to improve grades in some core courses may take “credit recovery” versions of classes, which have the same content requirements but require fewer instructional minutes than standard version (Florida Department of Education, Citation2017). Online versions of these classes allow new approaches toward classes traditionally offered face-to-face, but do not offer curricular expansion in the same way as online courses offering students entirely new course content (unlike the curricular intensification/advancement possibilities we outline above). We refer readers to a burgeoning literature on online courses for credit recovery (Hart et al., Citation2019; Heinrich & Darling-Aduana, Citation2021; Rickles et al., Citation2018; Viano, Citation2018, Citation2021).
4 However, funding for the home school may be reduced in proportion to the number of students’ full-time equivalent schedule taken online through outside providers.
5 Indicators for blended courses were not available in our data; some face-to-face courses may be using blended components that we cannot observe. Looking at blended courses separately is beyond the scope of this paper.
6 The data did not allow us to differentiate between race and ethnicity; categories are mutually exclusive.
7 We looked at other cutpoints for AP scarcity; while differences are even more pronounced at lower thresholds of AP/IB courses (e.g., at five courses), very few schools (serving < 4% of students) have such limited offerings.
8 Note that while Florida requires virtual course-taking experiences in order for students to graduate, this came into effect for the cohort entering 9th grade in the 2010–11 school-year (Florida Department of Education, Citation2011). Therefore, the older cohorts of students in our sample were not subject to this requirement.
9 Since we exclude the constant, the tests of significance for coefficients in regressions compare each group mean to 0. All group means are statistically significant from 0. We omit symbols indicating significance for table clarity.
References
- Ahn, J., & McEachin, A. (2017). Student enrollment patterns and achievement in Ohio’s online charter schools. Educational Researcher, 46(1), 44–57. https://doi.org/10.3102/0013189X17692999
- Archambault, L., Diamond, D., Brown, R., Cavanaugh, C., Coffey, M., Foures-Aalbu, D., Richardson, J., & Zygouris-Coe, V. (2010). An exploration of at-risk learners and online education. International Association for K-12 Online Learning. Retrieved June 3, 2020, from https://files.eric.ed.gov/fulltext/ED509620.pdf
- Attewell, P., & Domina, T. (2008). Raising the bar: Curricular intensity and academic performance. Educational Evaluation and Policy Analysis, 30(1), 51–71. https://doi.org/10.3102/0162373707313409
- Barbour, M. (2007). Portrait of rural virtual schooling. Canadian Journal of Educational Administration and Policy, 59, 1–21. https://eric.ed.gov/?id=EJ806974
- Barbour, M., & Mulachy, D. (2006). An inquiry into retention and achievement differences in campus based and web based AP courses. The Rural Educator, 27(3), 8–12. https://doi.org/10.35608/ruraled.v27i3.489
- Bush, J. (n.d.). Students should have the choice of digital schools. K-12 Newsroom. Retrieved June 3, 2020, from http://newsroom.k12.com/jeb-bush-students-should-have-the-choice-of-digital-schools/
- Cavalluzzo, L., Lowther, D. L., Mokher, C., & Fan, X. (2012). Effects of the Kentucky virtual schools’ hybrid program for algebra I on grade 9 student math achievement. Institute of Education Sciences. https://ies.ed.gov/ncee/edlabs/regions/appalachia/pdf/20124020.pdf
- Clark, T. (2008). Online learning: Pure potential. Educational Leadership, 65(8). https://www.researchgate.net/profile/Tom-Clark-5/publication/237238690_Online_Learning_Pure_Potential/links/577c026608ae355e74f1692e/Online-Learning-Pure-Potential.pdf
- The College Board. (2014). The 10th annual AP report to the nation. The College Board. https://secure-media.collegeboard.org/digitalServices/pdf/ap/rtn/10th-annual/10th-annual-ap-report-to-the-nation-single-page.pdf
- Conger, D., Kennedy, A., Long, M., & McGhee, R. (2021). The effect of Advanced Placement science on students’ skills, confidence and stress. The Journal of Human Resources, 56(1), 93–124. https://doi.org/10.3368/jhr.56.1.0118-9298R3
- Conger, D., Long, M., & McGhee, R., Jr. (Forthcoming). Advanced Placement and initial college enrollment: Evidence from an experiment. Education Finance and Policy. https://doi.org/10.1162/edfp_a_00358
- Cooper, R., & Liou, D. (2007). The structure and culture of information pathways: Rethinking opportunity to learn in urban high schools during the ninth grade transition. The High School Journal, 91(1), 43–56. https://doi.org/10.1353/hsj.2007.0020
- Darling-Aduana, J., & Heinrich, C. (2020). The potential of telepresence for increaseing advanced courses in high schools. Educational Researcher, 49(6), 415–425. https://doi.org/10.3102/0013189X20932461
- de la Varre, C., Irvin, M., Jordan, A., Hannum, W., & Farmer, T. (2014). Reasons for student dropout in an online course in a rural K-12 setting. Distance Education, 35(3), 324–344. https://doi.org/10.1080/01587919.2015.955259
- Digital Learning Collaborative. (2020). Snapshot 2020: A review of K-12 online, blended, and digital learning. Digital Learning Collaborative. Retrieved April 29, 2020, from https://static1.squarespace.com/static/5a98496696d4556b01f86662/t/5e61341d879e630db4481a01/1583428708513/DLC-KP-Snapshot2020.pdf
- Domina, T., & Saldana, J. (2012). Does raising the bar level the playing field?: Mathematics curricular intensification and inequality in American high schools, 1982–2004. American Educational Research Journal, 49(4), 685–708. https://doi.org/10.3102/0002831211426347
- Do Monte Junior, J. (2019). (Inter)personal statements: A discursive analysis of college application essays written in English by U.S. American and Brazilian students. Revista X, 14(6), 218–241. https://doi.org/10.5380/rvx.v14i6.68377
- Dougherty, C., Mellor, L., & Jian, S. (2006). The relationship between Advanced Placement and graduation. National Center for Educational Accountability.
- Elliott, S., & Bartlett, B. (2016). Opportunity to learn. Oxford Handbooks Online. https://doi.org/10.1093/oxfordhb/9780199935291.013.7
- Floden, R. (2002). The measurement of opportunity to learn. In A. Porter & A. Gamoran (Eds.), Methodological advances in cross-national surveys of educational achievement (pp. 231–266). National Academy Press.
- Florida Department of Education. (2011). Florida’s guide to public high school graduation: For students entering grade 9 2011-2012 school-year. http://www.fldoe.org/core/fileparse.php/3/urlt/1112hs-brochure.pdf
- Florida Department of Education. (2017). Secondary student progression: 2017-2018 frequently asked questions. Florida Department of Education. https://www.fldoe.org/core/fileparse.php/7764/urlt/SSP1718FAQ.pdf
- Florida Department of Education. (2018). Fact sheet, Florida’s public virtual education programs. Florida Department of Education. https://www.fldoe.org/core/fileparse.php/5606/urlt/Virtual-Sept.pdf
- Florida Department of Education. (2021). Memo: Information on virtual school choice options for Florida students. https://info.fldoe.org/docushare/dsweb/Get/Document-9080/dps-2021-19.pdf
- Gagnon, D. J., & Mattingly, M. J. (2015). Limited access to AP courses for students in smaller and more isolated rural school districts. University of New Hampshire Carsey School of Public Policy. https://scholars.unh.edu/cgi/viewcontent.cgi?article=1234&context=carsey
- Geiser, S., & Santelices, V. (2006). The role of Advanced Placement and honors courses in college admissions. In P. Gandara, G. Orfield, & C. Horn (eds.), Expanding opportunity in higher education: Leveraging promise. (pp. 75–114). State University of New York Press.
- Guiton, G., & Oakes, J. (1995). Opportunity to learn and conceptions of educational equity. Educational Evaluation and Policy Analysis, 17(3), 323–336. https://doi.org/10.3102/01623737017003323
- Hannum, W., Irvin, M., Banks, J., & Farmer, T. (2009). Distance education use in rural schools. Journal of Research in Rural Educaion, 24(3), 1–15.
- Hart, C., Berger, D., Jacob, B., Loeb, S., & Hill, M. (2019). Online learning, offline outcomes: Online course taking and high school student performance. AERA Open, 5(1), 1–17. https://doi.org/10.1177/2332858419832852
- Heinrich, C., & Darling-Aduana, J. (2021). Does online course-taking increase high school completion and open pathways to postsecondary education opportunities? Educational Evaluation and Policy Analysis, 43(3), 367–390. https://doi.org/10.3102/0162373721993485
- Heinrich, C. J., Darling-Aduana, J., Good, A., & Cheng, H. (2019). A look inside online educational settings in high school: Promises and pitfalls for improving educational opportunities and outcomes. American Educational Research Journal, 56(6), 2147–2188. https://doi.org/10.3102/0002831219838776
- Heissel, J. (2016). The relative benefits of live versus online delivery: Evidence from virtual algebra I in North Carolina. Economics of Education Review, 53, 99–115. https://doi.org/10.1016/j.econedurev.2016.05.001
- Heppen, J., Sorensen, N., Allensworth, E., Walters, K., Rickles, J., Stachel Taylor, S., & Michelman, V. (2017). The struggle to pass algebra: Online vs. face-to-face credit recovery for at-risk urban students. Journal of Research on Educational Effectiveness, 10(2), 272–296. https://doi.org/10.1080/19345747.2016.1168500
- Heppen, J., Walters, K., Clements, M., Faria, A., Tobey, C., Sorenson, N., & Culp, K. (2011). Access to Algebra I: The effects of online mathematics for grade 8 students. IES National Center for Education Evaluation and Regional Assistance. https://files.eric.ed.gov/fulltext/ED527394.pdf
- Herman, J., Klein, D., & Abedi, J. (2000). Assessing students’ opportunity to learn: Teacher and student perspectives. Educational Measurement: Issues and Perspectives, 19(4), 16–24. https://doi.org/10.1111/j.1745-3992.2000.tb00042.x
- Jackson, C. (2010). A little now for a lot later: A look at the Texas Advanced Placement incentive program. The Journal of Human Resources, 45(3), 591–639. https://doi.org/10.1353/jhr.2010.0019
- Jacob, B., Berger, D., Hart, C., & Loeb, S. (2016). Can technology help promote equality of educational opportunities? RSF: The Russell Sage Foundation Journal of the Social Sciences, 2(5), 242–271. https://doi.org/10.7758/RSF.2016.2.5.12
- Kimura-Walsh, E., Yamamura, E., Griffin, K., & Allen, W. (2009). Achieving the college dream? Examining disparities in access to college information among high achieving and non-high achieving Latina students. Journal of Hispanic Higher Education, 8(3), 298–315. https://doi.org/10.1177/1538192708321648
- Klein, A. (2021, April 20). During COVID-19 pandemic, districts have made mad dash for 1-to-1 computing. What happens next? Education Week. https://www.edweek.org/technology/during-covid-19-schools-have-made-a-mad-dash-to-1-to-1-computing-what-happens-next/2021/04
- Klopfenstein, K., & Thomas, M. (2009). The link between Advanced Placement experience and early college success. Southern Economic Journal, 75(3), 873–891. https://doi.org/10.1002/j.2325-8012.2009.tb00935.x
- Kramer, S., & London, M. (2006). The new rules of college admissions: ten former admissions officers reveal what it takes to get into college today. Fireside.
- Kurz, A. (2011). Access to what should be taught and will be tested: Students’ opportunity to learn the intended curriculum. In S. N. Elliott, R. J. Kettler, P. A. Beddow, & A. Kurz (Eds.), Handbook of accessible achievement tests for all students (pp. 99–129). Springer. https://doi.org/10.1007/978-1-4419-9356-4_6
- Lee, V. E., Smerdon, B. A., Alfred-Liro, C., & Brown, S. L. (2000). Inside large and small high schools: Curriculum and social relations. Educational Evaluation and Policy Analysis, 22(2), 147–171. https://doi.org/10.3102/01623737022002147
- Long, M. C., Conger, D., & Iatarola, P. (2012). Effects of high-school course-taking on secondary and postsecondary success. American Educational Research Journal, 49(2), 285–322. https://doi.org/10.3102/0002831211431952
- McDonnell, L. (1995). Opportunity to learn as a research concept and a policy instrument. Educational Evaluation and Policy Analysis, 17(3), 305–322. https://doi.org/10.3102/01623737017003305
- McPartland, J., & Schneider, B. (1996). Opportunities to learn and student diversity: Prospects and pitfalls of a common core curriculum. Sociology of Education, 69, 66–81. https://doi.org/10.2307/3108456
- Mokher, C., Lee, S., & Sun, C. (2019). Evaluating innovations for improving college and career readiness in rural schools. Research in the Schools, 26(1), 48–63.
- Monk, D. H., & Haller, E. J. (1993). Predictors of high school academic course offerings: The role of school size. American Educational Research Journal, 30(1), 3–21. https://doi.org/10.3102/00028312030001003
- National Center for Education Statistics. (2012). Digest of education statistics. Table 121. U.S. Department of Education. https://nces.ed.gov/programs/digest/d12/tables/dt12_121.asp
- National Center for Education Statistics. (2016). Table 3. Number and percentage of schools that offered any courses entirely online, and among those schools that offered courses entirely online, the percentage distribution of schools, by number of courses that are offered online and selected school char. National Teacher and Principal Survey. from https://nces.ed.gov/surveys/ntps/tables/Table_3_042617_fl_school.asp
- National Research Council. (2002). Learning and understanding: Improving advanced study of mathematics and science in U.S. high schools. National Research Council. https://www.nap.edu/read/10129/chapter/4#54
- Picciano, A. G., & Seaman, J. (2007). K-12 online learning: A survey of U.S. school district administrators. Sloan Consortium. https://files.eric.ed.gov/fulltext/ED530103.pdf
- Picciano, A. G., Seaman, J., Shea, P., & Swan, K. (2012). Examining the extent and nature of online learning in American K-12 education: The research initiatives of the Alfred P. Sloan foundation. The Internet and Higher Education, 15(2), 127–135. https://doi.org/10.1016/j.iheduc.2011.07.004
- Rickles, J., Heppen, J., Allensworth, E., Sorenson, N., & Walters, K. (2018). Online credit recovery and the path to on-time high school graduation. Educational Researcher, 47(8), 481–491. https://doi.org/10.3102/0013189X18788054
- Rose, H. M., & Betts, J. (2004). The effect of high school courses on earnings. The Review of Economics and Statistics, 86(2), 497–513. https://doi.org/10.1162/003465304323031076
- Santoli, S. (2002). Is there an Advanced Placement advantage? American Secondary Education, 30(3), 25–35.
- Scheerens, J. (Ed.). (2017). Conceptualization. In J. Scheerens (Ed.), Opportunity to learn, curriculum alignment and test preparation. (pp. 7–22). Springer.
- Slavin, R., & Storey, N. (2020). The US educational response to the COVID-19 pandemic. Best Evidence in Chinese Education, 5(2), 617–633. https://doi.org/10.15354/bece.20.or027
- Speroni, C. (2011). Determinants of students’ success: The role of Advanced Placement and dual enrollment programs. National Center for Postsecondary Research.
- Theokas, C., & Saaris, R. (2013). Finding America’s missing AP and IB students. The Education Trust. https://edtrust.org/wp-content/uploads/2013/10/Missing_Students.pdf
- Viano, S. (2018). At-risk high school students recovering course credits online: What we know and need to know. The American Journal of Distance Education, 32(1), 16–26. https://doi.org/10.1080/08923647.2018.1412554
- Viano, S. (2021). A choice between second chances: An analysis of how students address course failure. American Journal of Education, 128(1), 29–58. https://doi.org/10.1086/716549
- Warne, R. (2017). Research on the academic benefits of the Advanced Placement program: Taking stock and loking forward. SAGE Open, 7(1), 215824401668299. https://doi.org/10.1177/2158244016682996
- Woodworth, J. L., Raymond, M. E., Chirbas, K., Gonzalez, M., Negassi, Y., Snow, W., & Van Donge, C. (2015). Online charter school study. Center for Research on Education Outcomes.