
 ?Mathematical formulae have been encoded as MathML and are displayed in this HTML version using MathJax in order to improve their display. Uncheck the box to turn MathJax off. This feature requires Javascript. Click on a formula to zoom.
Abstract
Aim
The Observable Movement Quality (OMQ) scale measures generic movement quality and is used alongside standardized age-adequate motor performance tests. The scale consists of 15 items, each focusing on a different aspect; together, the entire construct of movement quality is assessed. This study aimed to determine interrater and intrarater reliability, and responsiveness of the OMQ scale.
Methods
A prospective intervention study with pre-post design in pediatric physical therapy practices. For interrater reliability, 3 physical therapists observed video-recorded motor assessments of 30 children with mild to moderate motor impairments —aged 4 to 12 years—using the OMQ scale. One therapist scored baseline assessment a second time for intrarater reliability, and to calculate smallest detectable change (SDC). Responsiveness (n = 28) was tested by comparing outcomes before and after intervention.
Results
Interrater reliability was moderate to good (ICC2,1: 0.79); intrarater reliability was high (ICC2,1: 0.97). Responsiveness results revealed an SDC of 2.4 and a minimal important change of 2.5; indicating sufficient validity in differentiating groups of children showing improved versus unchanged movement quality.
Conclusion
The OMQ scale is reliable and responsive to change when used to assess movement quality in clinical practice for children with mild to moderate motor impairments, aged 4–12 year.
The assessment of movement quality is perceived by physical therapists as relevant for recognizing motor problems, evaluating interventions and predicting recovery and offers insight into the developing child’s possibilities for reacting or adapting to changing conditions (Harris & Heriza, Citation1987; Heineman & Hadders-Algra, Citation2008; Knudson & Morrison, Citation2002; Sorsdahl, Moe-Nilssen, Kaale, Rieber, & Strand, Citation2010; Wright et al., Citation2014). Movement quality represents the interaction between personal characteristics and learning experiences; the task difficulty; and environmental conditions (Skjaerven, Kristoffersen, & Gard, Citation2008). Furthermore, movement quality gives an impression of how movements are controlled and coordinated (Magill & Anderson, Citation2014).
During children’s development, the mastery of new movements and skills increases, which can be observed through quantitative and qualitative changes (Boyce et al., Citation1991). Quantitative changes reflect the acquisition of new and more complex motor skills, whereas changes in quality of movements are demonstrated by more subtle characteristics such as an increase in accuracy, fluency and automated movements (Schmidt & Wrisberg, Citation2008). Available and commonly used discriminative motor tests in pediatric physical therapy specifically assess quantitative aspects by comparison with peers. These motor tests are validated and norm-referenced. For movement quality, however, available and commonly used measurement instruments are designed for particular diagnostic groups (e.g., children with cerebral palsy) for children in a specific age frame or to assess the functioning of extremities (DeMatteao et al., Citation1993; Hadders-Algra, Citation2004; Hecker, Baer, Stark, Herkenrath, & Hadders-Algra, Citation2016; Sorsdahl et al., Citation2010; Wright et al., Citation2014).
The Observable movement Quality (OMQ) scale (Janssen et al., Citation2012) can be used to assess movement quality in children, over time and for all age categories, as a generic evaluative measurement instrument. The OMQ scale is a criterion-based measurement instrument containing 15 items, each measuring one aspect of the whole construct of movement quality. The pediatric physical therapist completes the OMQ scale directly after the assessment with an age-specific, discriminative or disease-specific motor test, in approximately 5-10 minutes. During the development of the OMQ scale, content validity was established (Janssen et al., Citation2012), followed by the determination of the scale’s interrater reliability in a group of children from 6 months to 6 years of age (Dekkers, Nijhuis-Van Der Sanden, Jonker, De Swart, & Janssen, Citation2018). To test the OMQ scale in a broader age group, research is needed with a focus on reliability among older children. Furthermore, to use the OMQ scale as an evaluative instrument, it is necessary to gain insight into its ability to detect change over time as a result of either development or intervention (Mokkink et al., Citation2018, Citation2010; Portney & Watkins, Citation2009). For the latter, the smallest detectable change (SDC) (de Vet et al., Citation2006) and the minimal important change (MIC) (de Vet et al., Citation2006; Jaeschke, Singer, & Guyatt, Citation1989; Revicki et al., Citation2006) are important outcomes to determine the applicability and interpretability of the OMQ scale (Mokkink, Prinsen, Bouter, de Vet, & Terwee, Citation2016; Rysstad, Røe, Haldorsen, Svege, & Strand, Citation2017).
The aim of this study is to determine interrater and intrarater reliability as well as responsiveness of the OMQ scale (including SDC and MIC) in daily physical therapist practice among children from 4 to 12 years of age.
Methods
Design and Setting
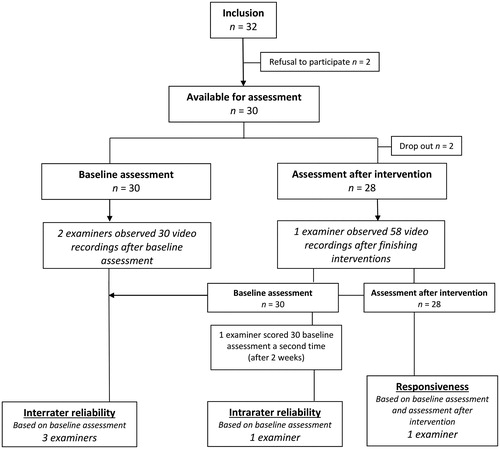
This was a prospective intervention study with a pre‒post design in pediatric physical therapy practices. Children were assessed by their treating physical therapist using the Movement Assessment Battery for Children, 2nd edition, Dutch version (MABC-2-NL) (Henderson, Sugden, & Barnett, Citation2010; Smits-Engelsman, Citation2010), at baseline and after an intervention period of 3 months, consisting of at least one physical therapy session per week. Movement quality was assessed using the OMQ scale during observations of video recordings of the motor performance assessment by examiners. To test the reliability, outcomes were compared among examiners. To test responsiveness, baseline assessment outcomes of the children were compared with outcomes after the intervention period. The medical ethical committee of Radboud University Medical Center approved the study, which conforms to the principles of the Declaration of Helsinki (registration number 2016-2832).
Participants
Video-Recorded Children
Children with mild to moderate motor impairments were recruited from November 2016 to March 2017 through two pediatric physical therapy practices in the central part of the Netherlands. Inclusion criteria were (1) being 4 to 12 years old and (2) being indicated for treatment by a physical therapist. To meet the inclusion criteria for the MABC-2-NL, children with neurological disorders (e.g., cerebral palsy), children unable to walk independently and children with severe cognitive impairments were excluded. The MABC-2-NL was video-recorded during a 30- to 45-minute session at baseline and after an intervention period of at least 3 months. All parents and 12-year old children signed informed consent for the recording and use of the video for this study.
Examiners
One pediatric physical therapist (LD) and two bachelor physical therapists (PE and AW), who were at that time completing their master’s education in pediatric physical therapy, examined the video recordings using the OMQ scale. Before the start of this study, the master students received a 4-hour training session on scoring the OMQ scale. The pediatric physical therapist (LD) was experienced in scoring the OMQ. The students had no previous experiences with the OMQ scale. The training outlined the purpose of the scale and explained the definitions of the items. The students were educated in the development and aim of the OMQ scale and observed videos of children showing severe deviant movement quality as a frame of reference. Thereafter they watched, together with two expert pediatric physical therapists (AJ and LD), two video recordings of a child with motor impairments and completed the OMQ scale individually. Finally, the scores were compared, differences and problems in scoring were discussed and unclear issues were resolved.
Instruments
OMQ Scale
The OMQ scale (Janssen et al., Citation2012) was designed for children from 3 months to 16 years of age. The scale needs to be filled in alongside an age-specific, discriminative or disease-specific motor test—for this study, the MABC-2-NL—to observe and score movement quality relative to what is expected for a child’s age. The 15 items are scored on a 5-point Likert scale; thus, total scores range from 15 to 75 (see for the 15 scale items). Lower scores indicate lower movement quality.
Global Perceived Effect
As a comparator instrument to measure change in movement quality, a global perceived effect (GPE) rating scale was used (Kamper, Maher, & Mackay, Citation2009). Treating physical therapists were asked—before the assessment with the MABC-2-NL after the intervention period of 3 months—to answer a single question to indicate how much movement quality had changed since baseline (de Vet, Terwee, Mokkink, & Knol, Citation2011). The question asked to the therapists was: ‘To what extent has the quality of movement of the child improved since the start of the pediatric physical therapy intervention?’. Responses were scored on a 7-point Likert scale ranging from: 1 = ‘very much improved’ to 2 = ‘much improved’; 3 = ‘a little improved’; 4 = ‘no change’; 5 = ‘a little deterioration’; 6 = ‘much deterioration’; and 7 = ‘very much deterioration’ (Lauridsen, Hartvigsen, Korsholm, Grunnet-Nilsson, & Manniche, Citation2007). Test‒retest reliability for GPE is high (ICC = 0.997); however, construct validity is moderate (Kamper et al., Citation2010).
Procedure
The treating physical therapist performed the assessment of the MABC-NL as a usual part of the diagnostic procedure in daily practice using the standardized procedures for administration and instructions for calculation of the test scores, as specified in the test manual. All motor test items were recorded using a predesigned video protocol. The video recordings were edited by the master students (PE and AW) to a roughly 20-minute-long video, ensuring that they showed all test items of the MABC-2-NL and that all aspects of the OMQ scale were observable. This was a technical procedure in which the video part with instructions from the therapist to the child was deleted, and multiple files of an assessment part were combined, if necessary. The students did not observe the videos during editing. The video recordings were saved on a password-protected hard disk, only accessible by the main researchers of this study (LD and AJ).
For data sampling, examiners observed the video recordings of the children individually and completed an OMQ scale scoring sheet for each recording. For interrater reliability, videos of the baseline assessment were scored by three examiners (LD, PE and AW). For intrarater reliability, the videos of the baseline assessment were scored a second time, by the expert examiner (LD). In addition, for responsiveness, videos of the assessments after intervention were scored by the expert examiner (see ). The two master student examiners (PE and AW) scored all video recordings within two weeks after the baseline assessment. The expert examiner (LD), who scored both baseline assessment and assessment after intervention, started with scoring at the end of the project when all motor performance assessments—before and after intervention—were gathered. The video-records were scored in a random order, while the examiner was blinded for measurement time point. This examiner also scored baseline assessment a second time (with at least two weeks in-between) blinded for previous scores. The expert examiner was not involved in the children’s pediatric physical therapy assessment or intervention, which prevented practitioner bias.
Figure 1. Flow chart.
Statistical Methods
Descriptive statistics of the characteristics of the video-recorded children were presented as numbers and percentages for categorical variables and as median and interquartile range (IQR) for ordinal variables. For continuous data, means and standard deviations (SD) were reported. The data were checked for outliers. MABC-2-NL standard scores were used for analyses. The score distribution of the OMQ scale was examined for floor and ceiling effects. Floor and ceiling effects exceeding 20% of the participants were considered substantial (McCarthy et al., Citation2007; Wuang, Su, & Su, Citation2012).
To estimate interrater and intrarater reliability of the OMQ scale, interclass correlation coefficients type 2:1 (ICC2,1)—a two-way random-effects single-measures model of absolute agreements—with 95% confident intervals (CI) were determined (Koo & Li, Citation2016; Terwee et al., Citation2007), along with the standard error of measurement (SEM) and the limits of agreement (LoA) (Mokkink et al., Citation2018). The SEM was calculated by the SD of the measurement at baseline using ICC (as SEM = SD x √[1-ICC]) (de Vet et al., Citation2006; Wyrwich, Nienaber, Tierney, & Wolinsky, Citation1999), and the SEM was used to calculate the LoA (as: ±1.96 x √2 x SEM) (de Vet et al., Citation2006). SEM ≤ SD/2 was taken as the criterion of acceptable precision (Wyrwich et al., Citation1999).
Bland-Altman plots were used to represent the agreement between measurements graphically (Bland & Altman, Citation1986). For the Bland-Altman plot representing interrater reliability, OMQ total scores for the 3 examiners were plotted against each other and visualized; for intrarater reliability, the OMQ scale baseline assessment, score twice by one examiner, were plotted against each other. Furthermore, item agreement presented the percentage of observed agreement (PO). For sample size calculations, we assumed an ICC of 0.8 (i.e., good reliability) and larger than 0.6 (i.e., moderate reliability). To obtain a power of 80% (alpha = 0.05, F-test), we needed 31 videos (Shoukri, Asyali, & Donner, Citation2004).
The overall effect of pediatric physical therapy intervention was defined by the effect size (ES)—a standardized measurement of change calculated by dividing the mean change between baseline measurement and measurement after the intervention period by the SD of the baseline measurement—and the standardized response mean (SRM)—calculated as the mean change in scores between baseline measurement and measurement after the intervention period divided by the SD of that change score (Stratford, Binkley, & Riddle, Citation1996). ES and SRM were calculated for both MABC-2-NL and OMQ scale total scores. A positive SRM indicated improvement, whereas a negative SRM indicated deterioration (Stratford et al., Citation1996). Outcomes for ES and SRM of 0.20 were considered as small, 0.50 as moderate and 0.80 as large (Cohen, Citation1977).
To assess the responsiveness of the OMQ scale, the SDC (as 1.96 x √2 x SEM) was calculated. If the change was above the SDC value in individual patients, one could be 95% confident that it was not caused by measurement error (Van Kampen et al., Citation2013). Furthermore, the MIC value for the OMQ scale was calculated to examine the discriminative ability of change scores for the OMQ scale (Crosby, Kolotkin, & Williams, Citation2003; Revicki et al., Citation2006). To explore the interpretability of change scores, the SDC was compared to the MIC; to distinguish clinically important change from measurement error, we tested whether the MIC was greater than the SDC (de Vet et al., Citation2011).
The perceived improvement of movement quality on the GPE was used as an anchor (gold standard) (de Vet et al., Citation2011, Citation2007). Outcomes for GPE were classified as ‘improved’ (defined as GPE scores 1–2) and ‘unchanged’ (defined as GPE scores 3–7). The MIC values for the OMQ scale were calculated by subtracting the mean change score of the children classified as unchanged from the mean change score of those classified as improved. To establish the validity of the anchor, a two-sample t-test was performed to test the difference between the two groups across OMQ scale scores (Wuang et al., Citation2012). Receiver operating characteristic (ROC) curves were used to examine various cutoff values for the OMQ scale change scores (de Vet et al., Citation2006). In a ROC curve, sensitivity and 1-specificity values from the ‘improved’ and ‘unchanged’ groups were plotted on a y- and x-axis. The ROC cutoff point was detected by finding the minimal distance to the upper left corner of the ROC curve, which was assumed to represent the optimal tradeoff between sensitivity and specificity for detecting clinical improvement (de Vet et al., Citation2011). The area under the ROC curve (AUC) was used as an indicator for responsiveness. For sufficient responsiveness, an AUC over 0.70 is recommended (de Vet et al., Citation2011).
All statistical tests were two-sided, and p < 0.05 was considered significant. Data were analyzed using IBM Statistical Package for the Social Sciences (IBM SPSS Statistics) version 25 (IBM Corporation, Armonk, NY).
Results
In total, 32 children were recruited for participation. The parents of one child refused to sign informed consent, and one child refused to sign for video recordings. Finally, we were able to include 30 children in this study. shows the characteristics of the 30 children—19 boys (63%)—aged 4 years to 12 years with a mean age (SD) of 7 years and 5 months (2 years and 6 months). Indication for physical therapy intervention was diverse; however, the majority of the children were diagnosed with motor developmental delays (63%). Two children (7%) dropped out of the intervention, both due to severe health problems of one of the parents. MABC-2-NL standard scores at baseline had a mean (SD) of 6.17 (3.51) and, after the intervention period, a mean (SD) of 7.64 (4.50). OMQ scale total scores at baseline had a mean (SD) of 67.63 (4.97) and, after the intervention, a mean (SD) of 70.07 (5.19). For possible floor and ceiling effects of the OMQ scale, none (0%) and two (7%) of the children had initially the lowest or highest possible scores, respectively (compared to 0% and 14% after the intervention period). Results on GPE ranged from 2 (‘much improved’) to 4 (‘no change’).
Table 1. Characteristics of included children (n = 30), indication for physical therapy intervention; outcome on Movement Assessment Battery for Children, 2nd edition, Dutch version (MABC-2-NL), Observable Movement Quality (OMQ) scale, and Global Perceived Effect (GPE) scores.
The interrater reliability indicated a moderate to good reliability (ICC2,1: 0.79; 95% CI: 0.62, 0.89), and for intrarater reliability, a high reliability (ICC2,1: 0.97; 95% CI: 0.93, 0.98) was shown; see . The SEM values for both interrater and intrarater reliability met the criteria (SEM ≤ SD/2), suggesting an acceptable measurement precision of the OMQ scale. The LoA for interrater reliability was 33.0, and for intrarater reliability it was 7.03, indicating a better measurement precision for intrarater reliability. Bland-Altman plots for interrater reliability showed a systematic difference in OMQ total scores (−5.16) and an increase in the plots for the expert examiner (examiner 3), indicating higher total scores for this examiner (see ). Median score for all items of the OMQ scale varied between 4 and 5 for both interrater and intrarater reliability (see ). For interrater and intrarater item agreement the proportions of observed agreement were moderate to good; 0.53–0.83 and 0.75–1.00, respectively.
Figure 2. Bland-Altman plots for comparison of Observable Movement Quality scale total scores at baseline assessment.
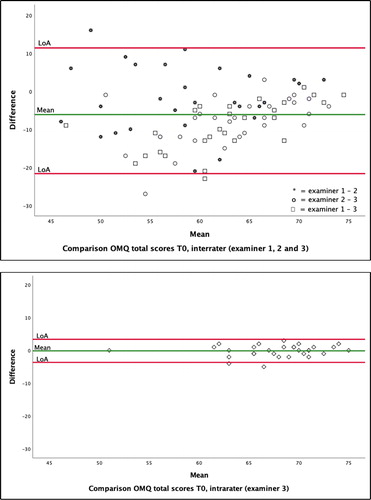
Table 2. Reliability of the observable movement quality (OMQ) scale total scores (n = 30).
Table 3. Item Agreement for each item (n = 15) of the observable movement quality (OMQ) scale scored on a 5-point Likert scale by expert examiner (n = 1) for intrarater and by all examiners (n = 3) for interrater over video-record children (n = 30) for baseline assessments.
The overall effect of pediatric physical therapy intervention is presented in . ES and SRM values for OMQ scale total scores between baseline assessment and assessment after intervention reflect small to moderate effects (0.48 and 0.73, respectively). For MABC-2-NL, ES and SRM values between baseline assessment and assessment after intervention reflect small effects (0.44 and 0.43, respectively). Outcomes for responsiveness of the OMQ scale are also presented in . The SDC at the 95% confidence interval for the OMQ scale was 2.38, implying that a change of 2 points or more is likely to represent true change in movement quality as measured by the OMQ scale.
Table 4. Responsiveness statistics for observable movement quality (OMQ) scale total score (n = 28) and movement assessment battery for children, 2nd edition, Dutch version (MABC-2-NL) standard scores.
According to the GPE scores, 46% of the children (n = 13) were categorized as improved and 54% (n = 15) as unchanged for motor quality. The MIC for the OMQ scale total score was identified as 3.15, implying that a change of 3 points or more is likely to represent a therapist-perceived important change by the OMQ scale (see ). A two-sample t-test, applied to the mean change scores for the OMQ scale between the improved and unimproved groups, revealed significant difference (p = 0.009), with the improved group scoring higher than the unimproved group. The MIC calculated from the ROC curve using the cutoff point nearest the upper left-hand corner of the graph was 2.5 points for OMQ scale total scores (sensitivity 84%, specificity 77%); the AUC for change in OMQ scale total score was 0.77.
Discussion
In this prospective intervention study, the reliability and responsiveness of the OMQ scale was determined in physical therapists’ daily practice with children from 4 to 12 years of age as participants. This study showed that the OMQ scale is a reliable and valid measurement instrument to assess movement quality in clinical practice and to monitor and evaluate movement quality as a result of the treatment’s progress. The OMQ showed a moderate to good interrater reliability and high intrarater reliability, with excellent item agreement. Our study showed, furthermore, a SEM of 0.62 for OMQ scale total scores, SDC of 2.38—both based on the intrarater scores—and MIC of 3.15. The MIC calculated using a ROC curve was 2.5. Because the MIC should be detectable beyond measurement error (Crosby et al., Citation2003; de Vet et al., Citation2007) and above the SDC (de Vet et al., Citation2011), our research showed that it is possible for the OMQ scale to detect change in movement quality among children from 4 to 12 years of age.
Responsiveness of the OMQ scale was assessed using a GPE as a comparator instrument to measure change in movement quality. This was chosen because a construct approach—in which a priori hypotheses of expected associations between scores of the OMQ scale and other assessment tools that measure more or less the same construct would be assessed—was not possible (Mokkink et al., Citation2018, Citation2010) The reason for development of the OMQ scale was the lack of a generic measurement instrument to assess movement quality in children (Janssen et al., Citation2012). Therefore, no hypothesis for expected correlations between changes in scores on the OMQ scale and those on other similar instruments could be set. Using the GPE as a comparator instrument is the most common external criterion (Ogollah, Bishop, Lewes, Grotle, & Foster, Citation2019). Furthermore, we used a 7-point transition question, focusing on change in movement quality, as recommended (Lauridsen et al., Citation2007). However, when scoring a GPE, patients are known to have difficulty taking their baseline status into account; as such, GPE ratings are strongly influenced by patients’ current health status (de Vet et al., Citation2015, Citation2007; Grøvle et al., Citation2014; Kamper et al., Citation2010; Schuller, Ostelo, Janssen, & de Vet, Citation2014). Moreover, the MIC depends significantly on the anchor’s definition of important change (de Vet et al., Citation2007).
In our study, we decided not to ask the parents of the children to rate the perceived change in movement quality, because we anticipated that they would have difficulties estimating changes in movement quality; a professional concept. Above all, we expected the parents to be influenced by the current health status of their child or even to want to please the physical therapist by saying their child had improved (de Vet et al., Citation2007). Therefore, we decided to ask the treating physical therapists to rate the change on the GPE ratings scale before the start of the assessment after intervention. This allowed them a perspective on what they would consider important improvement or deterioration, although some practitioners’ bias could have influenced the rating on the GPE (van Walraven, Mahon, Moher, Bohm, & Laupacis, Citation1999).
In this study, we used ROC curves to examine cutoff values for the OMQ scale change scores (de Vet et al., Citation2006) The perceived improvement of movement quality on the GPE was used as an anchor (de Vet et al., Citation2011), which required the choice of a sensible cutoff point of important change (Stuge, Krogstad Jenssen, & Grotle, Citation2017). There is debate about whether the category ‘a little improved’ should be considered as change (de Vet et al., Citation2007; Demoulin, Ostelo, Knottnerus, & Smeets, Citation2010; Jaeschke et al., Citation1989; Wyrwich et al., Citation1999). We concluded that it should not, in accordance with Demoulin et al. (Citation2010), who stated that the accuracy to differentiate patients who improved from those who did not will decrease if patients who report little improvement are considered as improved. By not including patients who were ‘a little improved’ in the group classified as ‘improved’, we assumed the concept of important improvement was better reflected.
The responsiveness and MIC of measurement instruments are often population- and context-specific and should be taken into account before generalizing to other populations (de Vet et al., Citation2007). A limitation of our study for the measurement properties of the OMQ scale was that these have so far only been examined in Dutch pediatric physical therapy practices. Consequently, it is necessary to investigate whether the measurement properties are consistent with other countries and other populations of children, and therefore we should assess whether they adequately reflect the purpose of the OMQ scale (Mokkink et al., Citation2010). Future studies for the OMQ scale, to include data of children treated in multiple pediatric physical therapy contexts, in other countries and within other patient populations (e.g., neuromuscular diseases and syndromes), will provide further evidence of validity for the use of the OMQ scale in clinical practice.
A limitation of our study was that the SDC was derived from intrarater reliability measures and not from test-retest situations. Therefore, the SDC from our study could be an underestimation as it only considers the examiner as a source of variance. Another limitation of our study was the inclusion of 30 children, while sample size calculation indicated 31 video recorded children. For our study, we were able to recruit 32 children; two children refused to participate in second thought, unfortunately. Due to the duration of our study, it was not possible to include the indicated 31 children. However, we expect that this did not affect the results of our study. Also, a limitation of our study was the inclusion of only 1 examiner for intrarater reliability and 3 examiners to establish interrater reliability. This decision was based on the time investment for the physical therapists to observe the video-recorded children. The inclusion of only 3 examiners could possibly have contributed to the somewhat higher outcomes for interrater reliability and item agreement demonstrated by our present study compared to those in our previous study—in which 28 pediatric physical therapists also unfamiliar with the OMQ and a short introduction observed video recordings of 9 children from 6 months to 6 years of age (Dekkers et al., Citation2018). Although, these higher outcomes can be related to differences in the population, as for example the age, as well. Also, a limitation was the inclusion of only children aged 4 to 12 years. In our former study for interrater reliability of the OMQ scale, we included children from 6 months to 6 years of age (Dekkers et al., Citation2018), and measurement properties for children within the age frame of 12–16 years have not yet been investigated. A future study including a larger group of children—also of older ages—within other patient populations, and with intervention periods over a 6-month period, will benefit the generalizability of the results.
Conclusion
The OMQ scale demonstrates a moderate to good interrater reliability and high intrarater reliability when used by pediatric physical therapists to assess movement quality in children aged 4 to 12 years with mild to moderate motor impairments. Our findings show, furthermore, that the OMQ scale is responsive to change when used for children treated in daily pediatric physical therapist practice, although only a small change in motor performance was seen within our study population. Our findings on reliability and responsiveness indicate that the OMQ scale can be used in daily clinical practice. Moreover, our findings show that an assessment with the OMQ scale—which is completed in approximately 5–10 minutes— is complementary to outcomes for motor performances tests. Training in the use of the OMQ scale is recommended to ensure reliable scoring, which will be developed after completing the validation of the OMQ scale.
Ethics
The regional medical ethical committee of the Radboud University Medical Center (Radboudumc) agreed that the study conforms to the Declaration of Helsinki and that approval was not required (registration number 2016-2832).
Acknowledgements
We would like to sincerely thank all the children, their parents and the pediatric physical therapists for participating in this study.
Disclosure statement
No potential conflict of interest was reported by the author(s).
Data Availability Statement
The data that support the findings of this study are available from the corresponding author (LD) upon reasonable request.
Additional information
Funding
Notes on contributors
Lieke M. A. Dekkers
Lieke M. A. Dekkers is a pediatric physical therapist, teacher and researcher working at the department of Allied Health studies, HAN University of Applied Sciences, Nijmegen, and at the Department of Rehabilitation, Pediatric Physical Therapy, Institute for Health Sciences, Amalia Children's Hospital, Radboud University Medical Center, Nijmegen, The Netherlands.
Bert J. M. de Swart
Bert J. M. de Swart (PhD) is a professor at the Department of Allied Health studies, HAN University of Applied Sciences, Nijmegen, and working at the Department of Rehabilitation, Pediatric Physical Therapy, Institute for Health Sciences, Amalia Children's Hospital, Radboud University Medical Center, Nijmegen, The Netherlands.
Marianne Jonker
Marianne Jonker (PhD) is an assistant professor and biostatistician working at the Department for Health Evidence, Radboud University Medical Center, Nijmegen, the Netherlands.
Pauline van Erp
Pauline van Erp is a pediatric physical therapist working at Center for pediatric physical therapy Daanen Derksen, Arnhem, The Netherlands.
Anneke Wisman
Anneke Wisman is a pediatric physical therapist working at Center for physical therapy ViaFysio, Zevenaar, The Netherlands.
Philip J. van der Wees
Philip J. van der Wees (PT, PhD) is a professor at the Department of Rehabilitation, Pediatric Physical Therapy, Institute for Health Sciences, Amalia children's Hospital, and at the Scientific Institute for Quality of Health Care, both at Radboud University Medical Center, Nijmegen, The Netherlands.
Maria W. G. Nijhuis van der Sanden
Maria W. G. Nijhuis van der Sanden (PPT, PhD) is a professor emerita at the Department of Rehabilitation, Pediatric Physical Therapy, Institute for Health Sciences, Amalia Children's Hospital, and the Scientific Institute for Quality of Health Care, both at Radboud University Medical Center, Nijmegen, The Netherlands.
Anjo J. W. M. Janssen
Anjo J. W. M. Janssen (PhD) is a pediatric physical therapist and researcher, working the Department of Rehabilitation, Pediatric Physical Therapy, Institute for Health Sciences, Amalia Children's Hospital, Radboud University Medical Center, Nijmegen, The Netherlands.
References
- Bland, J. M., & Altman, D. G. (1986). Statistical methods for assessing agreement between two methods of clinical measurement. The Lancet, 1(8476), 307–310. Retrieved from http://www.ncbi.nlm.nih.gov/pubmed/2868172doi:10.1016/S0140-6736(86)90837-8
- Boyce, W. F., Gowland, C., Hardy, S., Rosenbaum, P. L., Lane, M., Plews, N., … Russell, D. J. (1991). Development of a quality-of-movement measure for children with cerebral palsy. Physical Therapy, 71(11), 820–828. doi:10.1093/ptj/71.11.820
- Cohen, J. (1977). Stastical power analysis for the behavioural scienses. New York, NY: Academic Press.
- Crosby, R. D., Kolotkin, R. L., & Williams, G. R. (2003). Defining clinically meaningful change in health-related quality of life. Journal of Clinical Epidemiology, 56(5), 395–407. doi:10.1016/S0895-4356(03)00044-1
- de Vet, H. C. W., Foumani, M., Scholten, M. A., Jacobs, W. C. H., Stiggelbout, A. M., Knol, D. L., & Peul, W. C. (2015). Minimally important change values of a measurement instrument depend more on baseline values than on the type of intervention. Journal of Clinical Epidemiology, 68(5), 518–524. doi:10.1016/j.jclinepi.2014.07.008
- de Vet, H. C. W., Ostelo, R. W. J. G., Terwee, C. B., van der Roer, N., Knol, D. L., Beckerman, H., … Bouter, L. M. (2007). Minimally important change determined by a visual method integrating an anchor-based and a distribution-based approach. Quality of Life Research, 16(1), 131–142. doi:10.1007/s11136-006-9109-9
- de Vet, H. C. W., Terwee, C. B., Mokkink, L. B., & Knol, D. L. (2011). Measurement in medicine. Cambridge: Cambridge university press.
- de Vet, H. C. W., Terwee, C. B., Ostelo, R. W., Beckerman, H., Knol, D. L., & Bouter, L. M. (2006). Minimal changes in health status questionnaires: Distinction between minimally detectable change and minimally important change. Health and Quality of Life Outcomes, 4(1), 3–7. doi:10.1186/1477-7525-4-54
- Dekkers, L. M. A., Nijhuis-Van Der Sanden, M. W. G., Jonker, M., De Swart, B. J. M., & Janssen, A. J. W. M. (2018). Interrater reliability of the observable movement quality scale for children. Physiotherapy Canada, 70(2), 113–119. doi:10.3138/ptc.2016-104
- DeMatteao, C., Law, M., Russell, D., Pollock, N., Rosenbaum, P., & Walter, S. (1993). The relialbilty and validity of the quality of upper extremity skills test. Physical & Occupational Therapy in Pediatrics, 13(2), 1–18. doi:10.1080/J006v13n02_01
- Demoulin, C., Ostelo, R., Knottnerus, J. A., & Smeets, R. J. E. M. (2010). What factors influence the measurement properties of the Roland-Morris disability questionnaire? European Journal of Pain, 14(2), 200–206. doi:10.1016/j.ejpain.2009.04.007
- Grøvle, L., Haugen, A. J., Hasvik, E., Natvig, B., Brox, J. I., & Grotle, M. (2014). Patients’ ratings of global perceived change during 2 years were strongly influenced by the current health status. Journal of Clinical Epidemiology, 67(5), 508–515. doi:10.1016/j.jclinepi.2013.12.001
- Hadders-Algra, M. (2004). General movements: A window for early identification of children at high risk for developmental disorders. Journal of Pediatrics, 145(2 SUPPL), 12–18. 10.1016/j.jpeds.2004.05.017.
- Harris, S. R., & Heriza, C. B. (1987). Measuring infant movement. Clinical and technological assessment techniques. Physical Therapy, 67(12), 1877–1880. 10.1097/01241398-198807000-00065.
- Hecker, E., Baer, G. D., Stark, C., Herkenrath, P., & Hadders-Algra, M. (2016). Inter- and intrarater reliability of the Infant Motor Profile in 3- to 18-months-old infants. Pediatric Physical Therapy, 28(2), 217–222.
- Heineman, K. R., & Hadders-Algra, M. (2008). Evaluation of neuromotor function in infancy- A systematic review of available methods. Journal of Developmental & Behavioral Pediatrics, 29(4), 315–323. doi:10.1097/DBP.0b013e318182a4ea
- Henderson, S. E., Sugden, D. A., & Barnett, L. A. (2010). Movement assessment battery for children- second edition (MABC-2). London: Pearson Education International.
- Jaeschke, R., Singer, J., & Guyatt, G. H. (1989). Measurement of health status. Ascertaining the minimal clinically important difference. Controlled Clinical Trials, 10(4), 407–415. doi:10.1016/0197-2456(89)90005-6
- Janssen, A. J. W. M., Diekema, E. T. W., Dolder van, R., Kollée, L. A. A., Oostendorp, R. A. B., & Nijhuis-van derSanden, M. W. G. (2012). Development of a movement quality measurement tool for children. Physical Therapy, 92(4), 574–594. doi:10.2522/ptj.20100354
- Kamper, S. J., Maher, C. G., & Mackay, G. (2009). Global rating of change scales: A review of strengths and weaknesses and considerations for design. Journal of Manual & Manipulative Therapy, 17(3), 163–170. doi:10.1179/jmt.2009.17.3.163
- Kamper, S. J., Ostelo, R. W. J. G., Knol, D. L., Maher, C. G., de Vet, H. C. W., & Hancock, M. J. (2010). Global perceived effect scales provided reliable assessments of health transition in people with musculoskeletal disorders, but ratings are strongly influenced by current status. Journal of Clinical Epidemiology, 63(7), 760–766. doi:10.1016/j.jclinepi.2009.09.009
- Knudson, D. V., & Morrison, C. S. (2002). Qualitative analysis of human movement (2nd ed.). Leeds: Human Kinetics.
- Koo, T. K., & Li, M. Y. (2016). A guideline of selecting and reporting intraclass correlation coefficients for reliability research. Journal of Chiropractic Medicine, 15(2), 155–163. doi:10.1016/j.jcm.2016.02.012
- Lauridsen, H. H., Hartvigsen, J., Korsholm, L., Grunnet-Nilsson, N., & Manniche, C. (2007). Choice of external criteria in back pain research: Does it matter? Recommendations based on analysis of responsiveness. Pain, 131(1), 112–120. doi:10.1016/j.pain.2006.12.023
- Magill, R., & Anderson, D. (2014). Motor control theories. In Motor learning and control. Concepts and applications (10th ed.). Singapore: McGraw Hill Education.
- McCarthy, M. L., Silberstein, C. E., Atkins, E. A., Harryman, S. E., Sponseller, P. D., & Hadley-Miller, N. a. (2007). Comparing reliability and validity of pediatric instruments for measuring health and well-being of children with spastic cerebral palsy. Developmental Medicine & Child Neurology, 44(7), 468–476. doi:10.1111/j.1469-8749.2002.tb00308.x
- Mokkink, L. B., de Vet, H. C. W., Prinsen, C. A. C., Patrick, D. L., Alonso, J., Bouter, L. M., & Terwee, C. B. (2018). COSMIN risk of bias checklist for systematic reviews of patient-reported outcome measures. Quality of Life Research, 27(5), 1171–1179. doi:10.1007/s11136-017-1765-4
- Mokkink, L. B., Prinsen, C. A. C., Bouter, L. M., de Vet, H. C. W., & Terwee, C. B. (2016). The consensus-based standards for the selection of health measurement instruments (COSMIN) and how to select an outcome measurement instrument. Brazilian Journal of Physical Therapy, 20(2), 105–113. doi:10.1590/bjpt-rbf.2014.0143
- Mokkink, L. B., Terwee, C. B., Patrick, D. L., Alonso, J., Stratford, P. W., Knol, D. L., … de Vet, H. C.W. (2010). The COSMIN study reached international consensus on taxonomy, terminology, and definitions of measurement properties for health-related patient-reported outcomes. Journal of Clinical Epidemiology, 63(7), 737–745. doi:10.1016/j.jclinepi.2010.02.006
- Ogolla, R., Bishop, A., Lewis, M., Grotle, M., & Foster, N.E. (2019). Responsiveness and minimal important change for pain and disability outcome measures in pregnancy-related low back and pelvic girdle pain. Physical Therapy, 99(11), 1551–1561. doi:10.1093/ptj/pzz107
- Portney, L. G., & Watkins, M. P. (2009). Foundations of clinical research, applications to practice (3rd ed.). London: Pearson Education International.
- Revicki, D. A., Cella, D., Hays, R. D., Sloan, J. A., Lenderking, W. R., & Aaronson, N. K. (2006). Responsiveness and minimal important differences for patient reported outcomes. Health and Quality of Life Outcomes, 4(1), 5. doi:10.1186/1477-7525-4-70
- Rysstad, T., Røe, Y., Haldorsen, B., Svege, I., & Strand, L. I. (2017). Responsiveness and minimal important change of the Norwegian version of the disabilities of the arm, shoulder and hand questionnaire (DASH) in patients with subacromial pain syndrome. BMC Musculoskeletal Disorders, 18(1), 1–9. doi:10.1186/s12891-017-1616-z
- Schmidt, R. A., & Wrisberg, C. A. (2008). Getting started. In Motor learning and performance, a situation-based learning approach (4th ed., pp. 3–23). Leeds: Human Kinetics.
- Schuller, W., Ostelo, R. W. J. G., Janssen, R., & de Vet, H. C. W. (2014). The influence of study population and definition of improvement on the smallest detectable change and the minimal important change of the neck disability index. Health and Quality of Life Outcomes, 12(1), 53–57. doi:10.1186/1477-7525-12-53
- Shoukri, M. M., Asyali, M. H., & Donner, A. (2004). Sample size for a reliability study. Statistical Methods in Medical Research, 13(4), 251–271. doi:10.1191/0962280204sm365ra
- Skjaerven, L. H., Kristoffersen, K., & Gard, G. (2008). An eye for movement quality: A phenomenological study of movement quality reflecting a group of physiotherapists’ understanding of the phenomenon. Physiotherapy Theory and Practice, 24(1), 13–27. doi:10.1080/01460860701378042
- Smits-Engelsman, B. (2010). Movement assessment battery for children-2. Dutch standardization. Amsterdam: Pearson Education.
- Sorsdahl, A. B., Moe-Nilssen, R., Kaale, H. K., Rieber, J., & Strand, L. I. (2010). Change in basic motor abilities, quality of movement and everyday activities following intensive, goal-directed, activity-focused physiotherapy in a group setting for children with cerebral palsy. BMC Pediatrics, 10(1), 26. doi:10.1186/1471-2431-10-26
- Stratford, P., W., Binkley, J., M., & Riddle, D., L. (1996). Health status measures: Strategies and analytic methods for assessing change scores. Physical Therapy, 76(10), 1109–1123. doi:10.1093/ptj/76.10.1109
- Stuge, B., Krogstad Jenssen, H., & Grotle, M. (2017). The pelvic girdle questionnaire: Responsiveness and minimal important change in women with pregnacy-related pelvic girdle pain, low back pain, or both. Physical Therapy, 97(11), 1103–1113. doi:10.1093/ptj/pzx078
- Terwee, C. B., Bot, S. D.M., de Boer, M. R., van der Windt, D. A.W.M., Knol, D. L., Dekker, J., … de Vet, H. C.W. (2007). Quality criteria were proposed for measurement properties of health status questionnaires. Journal of Clinical Epidemiology, 60(1), 34–42. doi:10.1016/j.jclinepi.2006.03.012
- Van Kampen, D. A., Willems, W. J., van Beers, L. W. A. H., Castelein, R. M., Scholtes, V. A. B., & Terwee, C. B. (2013). Determination and comparison of the smallest detectable change (SDC) and the minimal important change (MIC) of four-shoulder patient-reported outcome measures (PROMs). Journal of Orthopaedic Surgery and Research, 8(1), 40. doi:10.1186/1749-799X-8-40
- van Walraven, C., Mahon, J. L., Moher, D., Bohm, C., & Laupacis, A. (1999). Surveying physicians to determine the minimal important difference. Journal of Clinical Epidemiology, 52(8), 717–723. doi:10.1016/S0895-4356(99)00050-5
- Wright, F. V., Rosenbaum, P., Fehlings, D., Mesterman, R., Breuer, U., & Kim, M. (2014). The quality function measure: Reliability and discriminant validity of a new measure of quality of gross motor movement in ambulatory children with cerebral palsy. Developmental Medicine & Child Neurology, 56(8), 770–778. doi:10.1111/dmcn.12453
- Wuang, Y., Su, J., & Su, C. (2012). Reliability and responsiveness of the movement assessment battery for children – second edition test in children with developmental coordination disorder. Developmental Medicine & Child Neurology, 54, 160–165. doi:10.1111/j.1469-8749.2011.04177.x
- Wyrwich, K. W., Nienaber, N. A., Tierney, W. M., & Wolinsky, F. D. (1999). Linking clinical relevance and statistical significance in evaluating intra-individual changes in health-related quality of life. Medical Care, 37(5), 469–478. doi:10.1097/00005650-199905000-00006