
ABSTRACT
This study was designed to substantiate the positive, long-term outcomes demonstrated by children from economically disadvantaged homes who received a high-quality, early education. Children who attended The Opportunity Project (TOP) Early Learning Centers in a midwestern city in the United States were matched with a like control sample from a local school system and followed from kindergarten through 4th grade. In 3rd and 4th grades, standardized state assessment outcomes for math and reading were collected on the two groups; data also were collected on discipline referrals, attendance rates, and special education placements for all grades. In the 4th grade, the TOP group scored significantly higher on math and reading tests. TOP children had significantly higher attendance rates than the control group; by the 4th grade, TOP students had significantly fewer discipline referrals. TOP students were identified for special education earlier and moved to mainstream classes sooner than the control group. Each year, teachers of TOP graduates completed questionnaires comparing TOP students to the remaining students in their classes on three social variables: appropriate behaviors, social interactions, and emotional maturity. Results indicated TOP children used significantly more appropriate behaviors, were significantly better at social interactions, and were significantly more emotionally mature than their non-TOP peers.
There is considerable evidence among those who work with child development and early education that 4-year-olds gain from being in a high-quality, early learning setting (e.g., Ramey & Ramey, Citation2004). In fact, the years from birth to age 5 are viewed as a critical period for developing the foundations for thinking, behaving, and emotional well-being. Child development experts indicate it is during these years that children develop linguistic, cognitive, social, emotional, and regulatory skills that predict their later functioning in many domains (Trawick-Smith, Citation2014; Woolfolk & Perry, Citation2012). However, Brophy (Citation2006) suggested children who are economically disadvantaged have limited readiness for school activities in quantitative and qualitative ways. He also posited that students of poverty, especially, have less access to books and educational games and toys in the home and less exposure to out-of-home educational experiences (e.g., trips to zoos or museums). There are also qualitative limitations or gaps (e.g., modeling and experiences). Lack of access to literature provides another limitation for children of poverty (Liang, Citation1998).
Duncan and Magnuson (Citation2003) evaluated several studies and concluded that economic deprivation during the preschool years is indeed harmful to children’s development. In addition, they indicated intervention research suggests that early childhood may be the relevant time for investment in educational programs if family and neighborhood environments fail to ensure that children are ready for school. As early as 1995, Steven Barnett reviewed a plethora of studies (large and small) that occurred from the 1960s through the early 1990s and concluded that
during the early childhood years [there were] sizable persistent effects on achievement, grade retention, special education, high school graduation, and socialization. In particular, the evidence for effects on grade retention and special education is overwhelming. … Evidence for effects on high school graduation and delinquency is strong but based on a smaller number of studies. (p. 43)
In the last 20 years, Barnett’s claims have been substantiated by a number of studies (Campbell, Ramey, Pungello, Sparling, & Miller-Johnson, Citation2002; Gorey, Citation2001; Karoly, Kilburn, & Cannon, Citation2005; Reynolds et al., Citation2007). This growing body of research points to the conclusion that children who live in poverty and attend a quality preschool program experience long-lasting primary and secondary positive effects. The improvements for these children’s early childhood intellectual, social, emotional, and dispositional performances extend throughout their school years in areas of (1) learning; (2) reduced need for placement in special education classes in later childhood; (3) higher school achievement and commitment in early adolescence; (4) lower rates of high school incompletions, juvenile arrests, and welfare assistance as an adult; and (5) higher instances of wealth in later adolescence and early adulthood.
The first limitation of the past research is that it is based primarily on projects conducted in the 1970s and 1980s and, whereas these were hallmark programs that were highly respected projects, according to Zigler, Gilliam, and Jones (Citation2006), they were basically model demonstration projects rather than large-scale programs. A second limitation is that preschool programs may have different effects on different students: in other words, programs that serve middle-income families may not have the same magnitude of effect on child outcomes as programs serving low-income families. The major projects from the 1970s and 1980s that were the basis of the majority of the research were the High/Scope Perry Preschool Project (Schweinhart et al., Citation2005), The Carolina Abecedarian Project (Campbell & Ramey, Citation1994), and the Chicago Child-Parent Center (Temple & Reynolds, Citation2007).
The Opportunity Project (TOP)
A current program tracking children’s outcomes is The Opportunity Project (TOP) Early Learning Centers, a charitable project in a midwestern U.S. state that uniquely operates through public/private partnerships. Its goal is to support working families and offer learning opportunities for preschool children living in poverty who need an early stimulating environment. The mission of TOP is to deliver a high-quality early learning experience to children living in poverty, providing them the tools needed for emotional, academic, and life-long success.
As part of the program, TOP is conducting longitudinal research on children who have graduated from their three TOP Early Learning Centers to determine the long-term benefits achieved from a high-quality preschool program. Beginning in the fall of 2008, data were gathered on graduates from TOP Early Learning Centers, with the intent of following them throughout their school years and into adulthood. The study presented here analyzes one of the first groups of students who enrolled in TOP, tracking their achievements from kindergarten through the 4th grade in school.
The TOP curriculum
The program curriculum is based on the guidelines of the National Association of the Education of Young Children (NAEYC), and these guidelines provide the philosophies, goals, and methods of the TOP program. TOP directives indicate that these guidelines are accomplished using the following methods: First, learning about diversity is integrated and developmentally appropriate and part of all aspects of the daily schedule. Second, the climate and tone of the classroom reflects a sense of community, where all members are respected for their individuality. Third, classrooms have resources and materials in all areas to make the environment culturally rich (e.g., books about sharing, caring, teaching respect, and differences/similarities among people). Fourth, in the area of self-concept/autonomy, children learn a sense of self, a sense of belonging, and positive attitudes toward learning itself. Fifth, children are encouraged to become active learners, drawing on direct physical and social experiences to construct their understanding of the world around them. And last, learning new skills is based on the interaction of the children’s biological maturation and the environment—opportunity is encouraged in learning new skills.
Questions for study
Based on the literature, a longitudinal study in which children from a quality preschool program can be followed throughout their school years to determine long-term effects from such a program is a timely study. The following questions guided this research project:
Do children from a quality preschool program evidence higher academic skills (in terms of math and reading standardized test scores and special education placement) than a control group of children during their elementary school years?
Do children from a quality preschool program evidence higher social skills (in terms of behavior, social interaction, and emotional maturity) than their non-TOP peers for their elementary school years?
Do children from a quality preschool program evidence a more positive attitude (in terms of school attendance and discipline referrals) than a control group of children during their elementary school years?
Method
The program delivered by TOP Early Learning Centers is based on what is known about the following three components: child development and learning, each child, and the social and cultural context of the individual child. The goals of the curriculum address emotional, social, cognitive, and physical development and provide opportunities and experiences for growth in each domain. The program began in 2004 with 95 students at one site. There are currently three TOP sites in the city and, though the enrollment fluctuates, the demographics for spring of 2014 were as follows: a total enrollment of 625 children from 12 months to 5 years of age. Of the student population, 21% were 5-year-olds, 45% were 4-year-olds, 20% were 3-year-olds, 11% were 2-year-olds, and 3% were 1-year-olds. In terms of ethnicity, 41% were Hispanic, 25% were African American, 20% were White, 11% were Multiracial, and 2% were Asian American. As far as socioeconomic status, 93% of the children were in the lower socioeconomic status as defined by eligibility for free or reduced-price lunches. Services at TOP schools are offered to parents from 7:30 a.m. to 5:30 p.m., Monday through Friday, year-round. Children are provided breakfast, lunch, and a snack daily. Teacher–child ratio is 1:5 for children younger than age 3 years and 1:10 for children age 3 to 5 years.
The longitudinal study
The TOP Longitudinal Study began in the fall of 2007; the first TOP graduates were already in kindergarten when the researchers began to develop the strategies for the program of study. Gaining parents’ consent was a difficult process; after gaining only 50% of parents’ permission, the research team decided that obtaining parents’ permission before the children left TOP would be more manageable. Thus, beginning in 2007, parents were told about the longitudinal study when their child enrolled for the year at a TOP Center. At that time, they were asked if they would be willing to have their child participate in the study. Since making this change, the participation rate has been greater than 90%. The first year’s group was studied as a Pilot Group, and the 2008 TOP graduating group is the first actual sample for the longitudinal study.
Each year, a new kindergarten class is added to the longitudinal study to have a sequential design. This adds to the rigor of the study, in that the research continues to address vagaries as events and cultural changes occur over periods of time.
For the purposes of this article, the group of students who entered kindergarten in 2008 was selected as the sample for this study. Thus, this is but a part of a large longitudinal, sequential study.
Participants
To be eligible study participants, the children must have attended TOP for at least eight continuous months the year prior to entering kindergarten. For this article, we used the first cohort whose parents signed consent forms while their children were still attending a TOP preschool; their participation rate was 99% (out of 114 eligible children, 113 parents signed consent forms). Each year’s group is labeled as a cohort because the students mostly go through school together as a group, and they are labeled sequentially. Thus, our first study group was termed Cohort 1. As is the case with most longitudinal studies, some students move away or relocate. Thus, attrition occurs, resulting in a decrease in the number of participants as the years pass. indicates the numbers of children spanning the years of the study, the demographics of the participants, and that minimum attrition occurred in the cohort.
Table 1. Number of participants and demographic information for each year of data collection for cohort 1, from kindergarten through 4th grade.a
Data gathering was conducted in two school districts within the local area. Both districts use the Kansas State standards and Common Core as their basis of teaching. Thus, though there may be teaching differences among individual teachers, the curriculum is similar across classrooms, schools, and districts. One of the school districts also provided the study with a matched control sample of 300 students with which to compare the TOP students. The control sample was matched on four variables: gender, age, ethnicity, and socioeconomic status. Although we did not have information about whether children in the control sample had attended some other preschool program, we were aware that both school systems offered a limited preschool program for students who met several criteria. There may have been others who attended another preschool program as well. However, we thought that any differences between the groups would be more difficult to attain if a number of the control sample had indeed participated in a preschool program.
The control sample was large at first because students would likely drop out as they moved from the district and the sample would become more similar in size to the TOP sample as the years pass. For the first 2 years, the control sample remained rather constant. By the 4th grade, the control sample had retained 80% (231) of its students. Chi-squared tests were performed on the demographics of the TOP and control groups to determine if there was a goodness of fit between the groups on the demographic variables. For gender, age, and socioeconomic status, the two groups for all grades were equally distributed. For ethnicity, however, the two groups were not equally distributed for any of the grades. For 1st grade, χ2(4, N = 362) = 28.58, p < .01. For 2nd grade, χ2(4, N = 345) = 18.96, p < .01. For 3rd grade, χ2(4, N = 334) = 22.11, p < .01. For 4th grade, χ (4, N = 307) = 28.58, p < .01. The Control Group had more African Americans and fewer Asian Americans than the TOP group; the other three ethnic groups were similar in size.
Instrument
Based on past research that indicates a major long-term impact from early education on the social skills of children, the researchers developed a social questionnaire that was administered to the teachers of former TOP students identified for the study. The social questionnaire contained questions that evaluated each student in three areas of social skills: appropriate behaviors, competent social interactions, and emotional maturity. At the end of the social questionnaire, five questions were framed that asked teachers to compare the TOP student with the remainder of the children in the classroom on the three domains of social skills. It is with these five comparative questions that this study is concerned. A sample question would be “Compared to other children in the class, this child’s ability to follow rules is: Below average, Average, Above average.”
Content validity was established by four experts in the field of school counseling who judged the items appropriate for the elementary grades. The school counselors then administered the social questionnaires to a sample of schoolchildren; the items were revised as necessary to ensure that each item asked for only one factor. The questions were scored a 1 for a “below average” response, a 2 for an “average” response, and a 3 for an “above average” response. Two questions addressed appropriate behaviors, two questions addressed competent social interactions, and one question addressed emotional maturity. The two questions for behavior and social interaction were divided so that the “average” score for each dimension was a 2. For reliability ratings, 20 undergraduate teacher education students in their methods class participated in an inter-rater reliability assessment. The students were asked to rate four different fictitious students on the social questionnaire. The inter-rater reliability was Cronbach’s alpha = .78. This is a reasonable interrater reliability rating, as there were 20 different raters doing the evaluations.
In addition to teachers’ assessment of the TOP children in comparison to the other students in their classrooms, the researchers also sought data regarding school success in two areas: academics and attitudinal information.
Academic measures
Beginning in the 3rd grade, the school systems assess each student on state normed reading and mathematics tests. Thus, we asked the two school districts to provide us with the performance indicators for reading and math for the TOP and control groups for the 3rd and 4th grades. The performance indicators are defined as follows: 1 (Academic Warning), 2 (Approaches Standards), 3 (Meets Standards), 4 (Exceeds Standards), and 5 (Exemplary). Additionally, we collected special education placements as a subset of academics.
Although no academic performance data were available before 3rd grade, we included this as an outcome of the TOP Early Learning experience because much of past research (e.g., Isaacs, Citation2008; Schweinhart et al., Citation2005) indicated that the advances in academic achievement of children in quality preschool programs dissipated by the 3rd grade. This study sought to determine if the same were true of the TOP program.
Attitudes toward school
Earlier longitudinal studies (e.g., Schweinhart et al., Citation2005) indicated that attitudes toward school may be an important variable in addressing differences between groups of this nature. We operationally defined attendance at school as an attitudinal variable. Schweinhart et al. (2001) indicated that attendance is indeed an attitude variable because attendance suggests whether school is valued. At earlier school grades (e.g., 1st and 2nd grades), attendance may be more in control of parents; however, the fact that attendance continues to improve increasingly as the children age suggests that the children themselves may be more in control of their school attendance. This indicates that, at least by 3rd grade, students show a positive attitude toward school. We also operationally defined discipline referrals as an attitude variable because the ability to follow guidelines and exhibit appropriate behavior is indicative of attitude.
Data collection
The study was discussed with parents when a child enrolled at a TOP center, and parents were asked to sign a consent form requesting their child be tracked in a longitudinal study. If the parent consented and the child attended a TOP school for eight consecutive months prior to kindergarten, the child was eligible for the study. When children entered the public schools, a researcher tried to locate them as students in the school system and worked with the schools to collect data on them throughout their school years. Each year, in the spring semester, the two school systems worked with the researcher to locate as many children as possible in the schools. Each school’s central office identified the individual school, the principal, and teacher of each TOP participant for the researcher. The researcher then contacted the individual teacher of each TOP child and asked the teacher to complete the social questionnaire (designed for the study) for each TOP child he or she had in their class. Teachers were provided with gift cards of modest value for the use of their time. As a result of the incentive to teachers, the return rate for the questionnaires generally was greater than 95%.
At the end of the school year, the researcher submitted the list of TOP students and the control group to the schools, and requested the additional information for all the TOP students and control group plus the standardized math and reading test data for the 3rd-, 4th-, and 5th-grade students in both groups.
Results
The results section is divided into three areas for analyses: (1) academics, (2) social skills, and (3) attitudes toward school. All three areas are deemed important because past research has indicated that the long-term benefits from a quality preschool program are academic, social, and attitudinal.
Academics
Academics are presented as reading and math performance indicators from state assessments beginning at the 3rd grade. Special education is discussed as a subset of academics because it is generally considered part of the academic curriculum. One of the districts provided a control group with which we could compare the TOP students in both academic subjects and for special education placement.
Standardized test outcomes
Because reading and mathematics are the basic tools that children need in school from an early time and use throughout their lives, these were the two academic tests researchers chose to measure. The indicators provided markers in terms of meeting the reading and/or math standards in terms of the following five criteria: 1 (Academic Warning), 2 (Approaches Standard), 3 (Meets Standard), 4 (Exceeds Standard), and 5 (Exemplary). Two figures follow in which the two groups (the TOP and control students) are shown in terms of their comparisons in Approaching, Meeting, or Exceeding Standards for reading and math. provides the information for reading performance for the TOP and control groups for 3rd and 4th grades. provides information on math performance levels for the TOP and control groups for 3rd and 4th grades.
Figure 1. Percentages of The Opportunity Project (TOP) and control group students who approach (Performance 1 or 2), meet (Performance 3), or exceed (Performance 4 or 5) standards for reading in 3rd and 4th grades. Note. Acad = Academic; Warn = Warning; App = Approaches; Stand = Standard; Exemp = Exemplary.
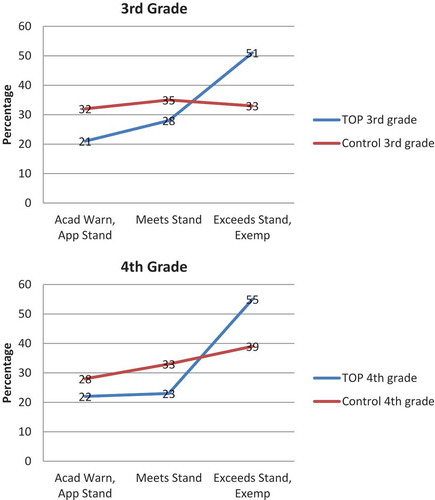
For reading performance in the 3rd grade, a considerably greater percentage of the control group students were in the Academic Warning and Approach Standards area of performance standards than the TOP students. Although a greater percentage of the control group students Met Standards than TOP students, the TOP students were much more likely to Exceed Standards than their non-TOP peers. For the 4th grade, similar patterns emerged. A lower percentage of TOP students were in the lower performance standards, a lower percentage of TOP students than control group students Met Standards, but a considerably higher percentage of TOP students again Exceeded Standards than the control group students. The t test results pointed out the significance differences, t = 3.64 (df 1, 75), p = .002, η2 = .03). The reading performance indicators showed significantly that the TOP students were Exceeding Standards by the 4th grade at a greater rate than their non-TOP peers. Thus, TOP students were 18% less likely to be rated below Meets Standards and 29% more likely to Exceed Standards in literacy.
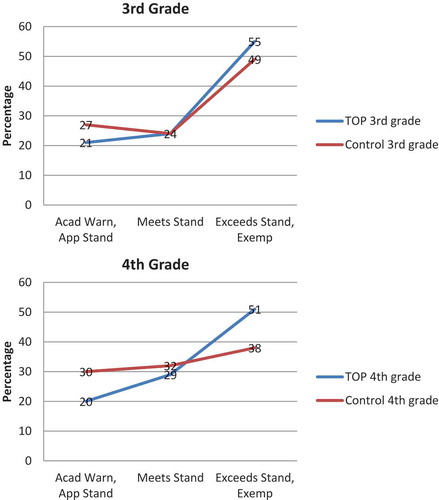
The information for math performance is similar to that for reading. More than 50% of TOP students Exceeded Standards in mathematics and only 20% did Not Meet Standards; by 4th grade, their control peers had 30% Not Meeting Standards and only 38% Exceeding Standards. In math performance indicators, t tests indicate significant results once again, t = 3.04 (df = 1, 75), p = .04, η2 = .04, indicating that 4th-grade TOP students, more than their non-TOP peers, Exceed Standards on state math tests. Thus, TOP students were 33% less likely to be rated below Meets Standards and 25% more likely to Exceed Standards in math.
Special education placement
Because the two sample sizes are so different, the best means of demonstrating the data may be by illustrating a figure of the placement in special education by percentages of the TOP students and the control groups for each year from kindergarten through the 4th grade. As part of its program, TOP identifies learning issues as early as possible so children can be helped as soon as they start elementary school. This stress on early identification is intended to help children early, thus allowing them to get help from special education and then move back into regular education classes. provides the summary for these placements.
Figure 2. Percentages of The Opportunity Project (TOP) and control group students who approach (Performance 1 or 2), meet (Performance 3), or exceed (Performance 4 or 5) standards for math in 3rd and 4th grades. Note. Acad = Academic; Warn = Warning; App = Approaches; Stand = Standard; Exemp = Exemplary.
From the figure, it can be seen that in kindergarten, TOP children have a higher special education placement than their non-TOP peers; by 1st grade, placement in special education is similar for the TOP and control students. By 2nd grade, placement in special education for the control group became noticeably higher than that for TOP students. This continued for 3rd and 4th grades; by the 4th grade, the TOP students were 28% less likely to be placed in special education than the control group students.
Social skills
The second analysis addresses social skills; these skills were measured on three dimensions: appropriate behaviors, competent social interactions, and emotional maturity. For this measure, there was no control group; teachers were asked to compare their TOP students to the remainder of the students in their classes. The two questions addressing appropriate behavior and competent social interactions were averaged; there was just one question that addressed emotional maturity. Thus, an average score for the instrument would be a 2. One-sample t tests were utilized, in which the test value of 2 is compared with the TOP students’ mean scores to determine if TOP children behaved significantly more appropriately, used significantly more competent social interactions, and were significantly more emotionally mature. presents the numbers, means, and standard deviations for each year for Cohort 1 for their Social Skills in each dimension.
Table 2. Grade, mean teacher rating, and standard deviations for appropriate behavior, competent social interaction, and emotional maturity.
For all grades, on appropriate behavior, competent social interaction, and emotional maturity, the TOP children showed significantly greater social skills than the other children in their classes. It is interesting to note that more than 90% of TOP children achieved average or above scores on the social questionnaire and more than 60% of TOP students scored above average.
Attitudes toward school
The final area that the research addressed in terms of how preschool has helped prepare children for school was the following: attendance and discipline. Schweinhart and colleagues (Citation2005) indicated from their longitudinal study that attendance was one of the educational factors that led to positive attitudes of their participants.
Attendance
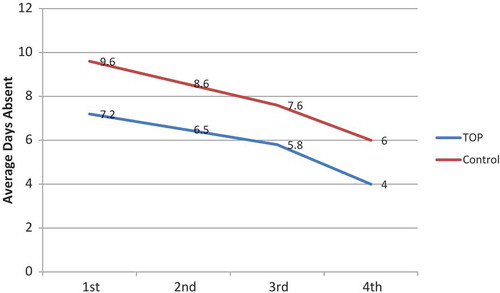
Attendance was measured by the average number of days absent during the school year. presents the average days absent for the TOP and control groups from the 1st through the 4th grades. In 2009, the attendance report was not usable, so no data were available for the kindergarten year. In looking at attendance rates during the course of years, it appears that attendance improved for both groups as they aged. However, they remained statistically significant in terms of TOP students having fewer days absent than their control group peers for each year from 1st through the 4th grades, averaging between 25% and 33% fewer absences than control group children (see ).
Figure 3. Percentage of students placed in special education for the The Opportunity Project (TOP) and control groups from kindergarten through the 4th grade.
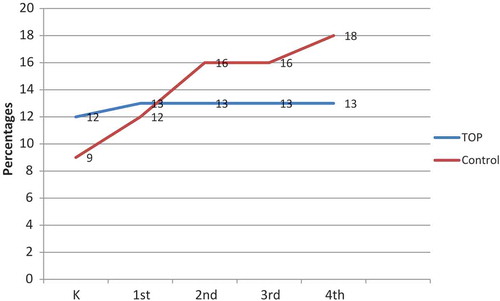
Figure 4. Average days absent for The Opportunity Project (TOP) and control group students from 1st through 4th grade.
Discipline referrals
We also asked the school systems to provide us information about discipline, specifically if a child was referred to the office because of behavior problems and if there were repeated discipline referrals for the same child. Although it appears that TOP children were sent to the office as often as their non-TOP peers, this is usually not a reflection of behavior problems (it generally is for a minor infraction of the rules). It is the repeat of the offense that signifies problems that the child has difficulty interacting appropriately in school. provides the percentage of students who had repeat discipline referrals for the TOP and Control Groups.
Table 3. Percent of students with repeat discipline referrals for The Opportunity Project students and control groups from 1st through 4th grades.
It is interesting to note that every year, TOP students have a lower percentage of students with repeat discipline referrals. By the 4th grade, TOP students have significantly fewer students who have repeat discipline referrals than the control group students. Overall, TOP students had a 3% to 7% repeat discipline average, compared to that of the control group of 5% to 12%; thus, TOP graduates were 50% less likely to require repeat disciplinary referrals in kindergarten through 4th grades. An average of the total percentage was computed for each group over the 4 years (we did not have repeat disciplinary referrals for kindergarten) to get an overall difference rating. t Tests look at the differences in the number of repeat discipline referrals for each year and for the total average. By the 4th grade, a significant difference was noticeable between TOP and the Control Group, and there was an overall significant difference between the two groups (see ).
Regression analyses
To determine if the differences between the TOP students and the control group have any predictive value, regression analyses were conducted on the academic and attitude variables. It seemed more relevant to address prediction for children in the older grades, as they are more responsible at this time for their behaviors. Furthermore, we have complete data for the 3rd and 4th grades on the academic and attitude variables. describes the regression analyses for the 3rd grade, and describes the regression analyses for the 4th grade.
Table 4. Regression analysis for 3rd-grade The Opportunity Project and control groups for reading proficiency, math proficiency, special education placement, attendance, and repeat discipline referrals.
Table 5. Regression analysis for 4th-grade The Opportunity Project and control groups for reading proficiency, math proficiency, special education placement, attendance, and repeat discipline referrals.
For both grades, reading indicates a statistically significant prediction, and math has statistically significant predictive value for the 4th grade, indicating that the TOP students will do better in reading and by the 4th grade, math also suggests that TOP students will fare better in mathematics. In addition, attendance also shows a statistically significant prediction for both grades, again indicating that TOP students will have higher attendance at school. Although repeat discipline does not achieve statistical significance, there is a trend suggesting that TOP students are less likely to receive repetitive discipline referrals. The only variable that did not produce significant prediction was that for special education placement. This may be, in part, that as the TOP students progress through school, there is a smaller sample in the later grades, and all of those students who were referred for special education remain in the sample.
Discussion
Past research indicates that 4-year-olds benefit from being in a high-quality, early learning setting and that it has a lasting effect. This has been substantiated from this study. The first cohort to have gone through much of their elementary school grades illustrates that the impetus gained from time at a TOP Early Learning Center continues throughout their learning years.
Academics
The performance indicators are an interesting factor in terms of addressing academic prowess: More than 50% of the TOP students by 4th grade Exceeded Standards in math, whereas the control group had fewer than 40% in 4th grade. Similar findings held true for reading: TOP had 55% of its readers Exceed Standards in 4th grade, whereas the control group also had fewer than 40% Exceed Standards in reading in both grades. In addressing Academic warning and Not Meeting Standards, similar findings appear: For math, TOP students had 10% fewer of its students Not Meeting Standards by 4th grade than the control group. For reading, 23% of TOP students did Not Meet Standards in 4th grade, whereas 28% of the control group did Not Meet Standards. Overall, TOP students were 18% less likely to be rated below Meets Standards in reading and 33% less likely in math. Furthermore, TOP students were 29% more likely to be rated as Exceeding Standards in reading and 25% more in math. In addition, reading for both grades, and math for the 4th grade, indicated significant predictive value for future proficiency in the academics.
Special education
Much of the past research indicates that there is lower placement in special education for children who attend quality preschool programs, especially as children reached older ages in school (Barnett, Citation1995; Schweinhart et al., Citation2005). The current data offer some support for those findings. Fourteen percent of TOP students were in special education in kindergarten. Schweinhart and his colleagues (Citation2005) indicated in their analysis of the High/Scope Perry Preschool Study that their experimental group had a larger number of participants who had speech and language as their primary special education placement than the control group but had fewer placements in the more serious (such as mental impairment) placements. This seemed to hold true for this cohort of TOP students as well. By 4th grade, the TOP students had 13% in special education (with either learning disabilities or speech-language as their primary special education placement), whereas the control group of students’ special education assignments were more varied. Overall, by 4th grade, TOP students were 28% less likely to be placed in special education status.
Social skills
The social skills that will be with students their entire lives seem to be well entrenched as they navigate their way through the school day. With the academic, social, emotional, and structural demands of their new environment, TOP children are able to conduct themselves well with their peers. According to their teachers, from kindergarten on, they are significantly able to behave more appropriately in situations than the other children in their classrooms.
Because children are able to behave appropriately, they develop a sense of trust in their environment, a sense of competence in their own capabilities, a beginning sense of self, a sense of personal initiative, and a sense of autonomy (Stipek & Greene, Citation2001). Following the regulations and mores of the social order also helps children with social interactions, which is necessary to be successful as they develop into adolescence and adulthood.
Second, the data show that the TOP children, from kindergarten through 4th grades, are able to interact significantly more competently with their peers and adults than other children their age. Competent social interactions allow children to develop relationships with other children and, as children grow, these relationships develop from friendships based on shared activities to relationships based on shared ideas and shared thinking (Rubin, Coplan, Chen, Buskirk, & Wojslawowicz, Citation2005). By early adolescence, students need relationships with others to continue to develop their sense of self, their self-esteem, their sense of belonging, and their sense of well-being.
The third dimension of social skills where the TOP students measured significantly higher was that of emotionally maturity: Emotional maturity implies that children have the ability to know when to control their anger, learn to take turns, and learn to share. It is the beginning of the ability to take the perspective of the other person. It helps nurture self-initiative, self-confidence, and autonomy (Eisenberg et al., Citation2007).
Attitudes toward school
Schweinhart and colleagues (Citation2005) reported that attendance continued to increase for their Perry Preschool participants throughout their school years. The TOP Longitudinal Study lends support to that hypothesis. It seems likely that the students who drop from the study (TOP and non-TOP) will be those with the negative attitudes toward school and the superior attendance of the TOP children will continue. Attendance indicated a significant predictive value, suggesting that TOP students will continue to be higher in their attendance than the control group.
Discipline is another attitude variable: Juvenile adjudication and high school dropouts generally result from discipline problems at younger ages (Schweinhart et al., Citation2005). Although the data for TOP children experiencing fewer repeat disciplinary referrals is not strong, a trend remains in the direction of fewer repeat discipline referrals for the TOP students. It may be that the social skills (including appropriate behavior, competent interactions, and emotional maturity) that the TOP students learned in preschool will serve them well as they negotiate the transition to middle school.
Implications
Implications from a high-quality, early learning settings are broad, including academic benefits, social skills, and positive attitudes. The evidence from the first cohort of this longitudinal study provides additional evidence for the benefits of early interventions.
Academics
Kansas begins administering state standardized tests in math and reading to students in the 3rd grade to evaluate public school performance. TOP students in 3rd grade scored higher on reading assessments performance indicators and scored similarly to the control group on math performance indicators. In the 4th grade, TOP students were much less likely to score below Meets Standards and much more likely to score as Exceeds Standards in reading and math. This is counter to past studies (Isaacs, Citation2008; Schweinhart et al., Citation2005) that indicate academic achievement tends to level off by the 3rd grade; it suggests some beginning evidence that academics may be an additional long-term result of quality preschool programming.
Social skills
Learning social skills early in life is predictive of children’s ability to adjust to society and be productive members of their culture (Elksnin & Elksnin, Citation2000; Webster-Stratton, Reid, & Hammond, Citation2004). There are now 5 years of evidence that the TOP Early Learning Centers have provided a means for this to occur. TOP children have shown ability to behave appropriately, establish social relationships, engage in social interactions, and provide evidence of emotional maturity. When comparing TOP students with other children in their classes, they behave significantly better than their peers, they have significantly more competent social interactions, and they are more emotionally mature than their peers from 1st through the 4th grades. Not only does this evidence begin at kindergarten, it grows, develops, and matures.
Attitudes
In terms of attendance, TOP children improved in their attendance rates and had significantly fewer absences each year than their non-TOP peers. Repeat disciplinary referrals increased each year for the TOP group and the control group. However, the repeat referrals for the TOP children were sufficiently lower than for the control group. By the 4th grade, when children are generally expected to be more responsible for their behavior, the TOP students had 33% fewer repeat disciplinary referrals than their control peers. Again, this reflects the notion that TOP children increased in their positive attitude toward school compared to their control group peers.
Limitations and suggestions for future research
As with any study, there are limitations to our research. Because we cannot determine who enrolls in preschool and who is left out, the controlled experimental design is not possible. When we use actual events and occurrences, there are shortcomings that result. The natural world is not set up as a research platform; thus, we need to work with the data that result from real-world experiences.
Limitations
There may be many limitations; however, the following seem to be relevant. First, there were no data across the two school systems on which to compare children for the academics. The first common assessments were the state standardized tests in reading and mathematics that are not administered until students reach the 3rd grade. Second, we could not procure a control group for the social skills section. Teachers might have been subjective in completing the questionnaires and, with no group with which to compare the TOP students, that might weaken the findings. Third, we did not keep records on the length of time TOP children participated in the TOP program. This would have enhanced the findings in determining if length of time in the TOP program increased the differences between TOP and control group students.
However, with the limitations that were present, there remains beginning evidence of long-term effects from a quality preschool program over the elementary school years.
Future research
It may be profitable to follow just one school system in the future to provide academic data from kindergarten on. Each school system has a program in which they collect academic data for all elementary children annually. However, the two systems were not compatible for comparison; thus, we decided to provide the first cross-system data that were common between the two school systems. Second, establishing a control group on which to compare social skills would strengthen our position that TOP children excel more than their same-age peers on these variables. Although we have data establishing their skills compared to their classmates, the data may be skewed. Third, we could determine if the length of time spent in the TOP Early Learning Program provides differences in the findings of TOP students in the elementary grades.
Conclusions
With 5 years of data, the evidence shows promise: early intervention into the minds, bodies, and emotions of children suggests long-term benefits. The TOP program that stresses social and academic skills for young children appears to have long-lasting benefits. After 5 years, these children were successful in school—academically, socially, and emotionally. Academic performance increased for children provided with high-quality, early learning. There were fewer placements in special education, which provided evidence that the TOP emphasis on early identification and remediation of learning problems has merit. Additionally, the differences in math and reading on the state standardized indicators provided evidence that early intervention has long-term benefits for brain development when its architecture is most pliable. The growing evidence from the data for social skills lends strength to the notion that early education has long-term benefits for children. Whereas kindergarten students benefited from the social and academic skills they learned at the TOP Early Learning Centers, these skills expanded as the children grew and developed—TOP children became increasingly adept in their social skills, such that by the time they approached 5th grade and were ending their elementary school years, they were demonstrating increasingly sophisticated social skills: displaying appropriate behaviors, establishing relationships, interacting socially, and responding to stimuli in an emotionally mature manner. In addition, they were becoming more responsible for their behavior as evidenced by their attendance at school, which increased as they aged. Thus, for 5 years, at least, there is considerable evidence that a high-quality preschool education creates improved life outcomes.
Funding
Wichita TOP Children’s Fund; Kansas Children’s Cabinet.
Additional information
Funding
References
- Barnett, W. S. (1995). Long-term effects of early childhood programs on cognitive and school outcomes. The Future of Children, 5, 25–50. doi:10.2307/1602366
- Brophy, J. E. (2006). Effective schooling for disadvantaged students. In M. S. Knapp & P. M. Shields (Eds.), Better schooling for the children of poverty (pp. 211–234). Berkeley, CA: Mccutchan Publishing.
- Campbell, F. A., & Ramey, C. T. (1994). Effects of early intervention on intellectual and academic achievement: A follow-up study of children from low-income families. Child Development, 65, 684–698. doi:10.2307/1131410
- Campbell, F. A., Ramey, C. T., Pungello, A., Sparling, J., & Miller-Johnson, S. (2002). Early childhood education: Young adult outcomes from the Abecedarian Project. Applied Developmental Science, 6(1), 42–57. doi:10.1207/S1532480XAD50601_05
- Duncan, G. J., & Magnuson, K. (2003). Promoting the healthy development of young children. In I. V. Sawhill (Ed.), One percent for the kids (pp. 16–39). Washington, DC: Brookings Institute.
- Eisenberg, N., Michalik, N., Spinrad, T. L., Hofer, C., Kupfer, A., Valiente, C., … Reiser, M. (2007). The relationship of effortful control and impulsivity to children’s sympathy: A longitudinal study. Cognitive Development, 22(4), 544–567. doi:10.1016/j.cogdev.2007.08.003
- Elksnin, L., & Elksnin, N. (2000). Teaching parents to teach their children to be prosocial. Intervention in School and Clinic, 36(1), 27–35. doi:10.1177/105345120003600104
- Gorey, K. M. (2001). A meta-analytic affirmation of the short-and-long-term benefits of educational opportunity. School Psychology Quarterly, 16(1), 9–30. doi:10.1521/scpq.16.1.9.19163
- Isaacs, J. B. (2008, September). Impacts of early childhood programs. Washington, DC: Brookings Institute.
- Karoly, L. A., Kilburn, M. R., & Cannon, J. S. (2005). Early childhood interventions: Proven results, future promise. Pittsburgh, PA: Rand Corporation.
- Liang, X. (1998). Cultural and economic factors influencing children’s preschool attendance. New York, NY: Garfield Publishing.
- Ramey, C. T., & Ramey, S. L. (2004). Early learning and school readiness: Can early intervention make a difference? Merrill-Palmer Quarterly, 50(4), 471–491. doi:10.1353/mpq.2004.0034
- Reynolds, A. J., Temple, J. A., Ou, S. R., Robertson, D. L., Mersky, J. P., Topitzes, J. W., & Niles, M. D. (2007). Effects of a school-based early childhood intervention on adult health and well-being: A 19-year follow-up of low-income families. Journal of American Medical Association Pediatrics, 161(8), 730–739. doi:10.1001/archpedi.161.8.730
- Rubin, K. H., Coplan, R., Chen, X., Buskirk, A. A., & Wojslawowicz, J. C. (2005). Peer relationships in childhood. In M. H. Bornstein, & M. E. Lamb (Eds.), Developmental science: An advanced textbook (pp. 469–512). Mahwah, NJ: Erlbaum.
- Schweinhart, L. J., Montie, J., Xiang, Z., Barnett, S. W., Belfield, C. R., & Nores, M. (2005). Lifetime effects: The High/Scope Perry Preschool study through age 40. Ypsilanti, MI: High/Scope Press.
- Stipek, D., & Greene, J. (2001). Achievement motivation in early childhood: Cause for concern or celebration? In S. Golbeck (Ed.), Psychological perspectives on early childhood education (pp. 64–91). Mahwah, NJ: Erlbaum.
- Temple, J. A., & Reynolds, A. J. (2007). Benefits and costs of investments in preschool education: Evidence from the Child-Parent Centers and related programs. Economics of Education Review, 26, 126–144. doi:10.1016/j.econedurev.2005.11.004
- Trawick-Smith, J. (2014). Early childhood development (6th ed.). Boston, MA: Pearson.
- Webster-Stratton, C., Reid, M. J., & Hammond, M. (2004). Treating children with early-onset conduct problems: Intervention outcomes for parent, child, and teacher training. Journal of Clinical Child and Adolescent Psychology, 33(1), 105–124. doi:10.1207/S15374424JCCP3301_11
- Woolfolk, A., & Perry, N. E. (2012). Child and adolescent development. Boston, MA: Pearson.
- Zigler, E., Gilliam, W. S., & Jones, S. M. (2006). The vision for universal preschool education. Cambridge, MA: Cambridge University Press.