
 ?Mathematical formulae have been encoded as MathML and are displayed in this HTML version using MathJax in order to improve their display. Uncheck the box to turn MathJax off. This feature requires Javascript. Click on a formula to zoom.
ABSTRACT
Most studies on participation in training focus on participation versus non-participation. The individual’s participation varies, however, very much in terms of the duration of training, from until a few days to intensive participation. This study examines participation in non-formal training by the total amount of training during a year. In the analysis, we use PIAAC data for eight European countries, of which half represents a group of countries with high participation rates in non-formal training and the other half have lower participation rates. One purpose is to examine whether the duration of training varies between these groups of countries. We expected that countries which score high on training rates are characterised by high proportions participating in short courses. Another purpose is to examine the relationship between duration of training and educational levels and immigrant backgrounds. We expected that the relationship that is normally found between training rates and social background variables would be reversed when it comes to duration of training. In the analyses, controls are applied for several individual and workplace characteristics, including skills level, firm size, occupational level, and industrial sector. The estimation results indicate that overall, our expectations are not supported.
Introduction
A high participation rate in non-formal training does not necessarily imply high training intensity in terms of the number of training days. It is not unreasonable to imagine that in groups with a low proportion participating in training there are many who have long duration of training. In that case, it can to some extent compensate for a low participation rate. Conversely, it could be thought that groups or countries with high participation rates may not have a long duration of training, that is, they participate extensively, but each participant participates only to a limited degree. This is a topic that has received little attention in the literature on lifelong learning. Most studies on participation in training focus on participation versus non-participation in training (see e.g. Albert, García-Serrano, & Hernanz, Citation2010; Bassanini, Booth, Brunello, De Paola, & Leuven, Citation2007; Bishop, Citation1996; Blundell, Dearden, & Meghir, Citation1996; Fouarge, Schils, & De Grip, Citation2013).
A well-known finding is that the participation rate increases with increasing educational level (Boeren, Nicaise, & Baert, Citation2010; Desjardins & Rubenson, Citation2011; Desjardins, Citation2017; Knipprath & De Rick, Citation2015; OECD, Citation2013). Studies of the intensity of training in terms of duration of training are, to the best of our knowledge, scarcer. Leuven and Oosterbeek (Citation1999) examined, among other things, the relationship between training intensity (i.e. duration of training spells) and education levels in four countries and found that training intensity – as opposed to training rates – did not vary much with the level of formal schooling, apart from the USA where the training intensity was highest among those with tertiary education. In Leuven (Citation2001), where corresponding analyses were undertaken but which also included UK, a negative effect was found of having tertiary education on training intensity in the British sample. In a Swedish study (Orrje, Citation2000) no significant difference was found between individuals with only elementary school education and those with an academic degree in the amount of training days (i.e. the number of days of on-the-job training received during the last 12 months). However, persons with medium education levels received significantly more days of on-the-job training.
This paper concerns non-formal training where the focus is on the total amount of such training. Non-formal training is intentional and organised, but not a part of the formal educational system.Footnote1 Individual participation in non-formal training during a year varies considerably, from 1 to 2 days to weeks or months. The patterns of social distribution of training opportunities with regard to duration of training may be quite different from training versus no training, as indicated by the studies of Leuven and Oosterbeek (Citation1999) and Orrje (Citation2000). We investigate how the total amount of non-formal training is related to individual and workplace characteristics. Here, special attention is directed towards how different amounts of participation vary according to educational and occupational levels.
Furthermore, an examination is made of whether duration of training varies between countries that have overall high participation rates in non-formal training, and countries where the participation rate is low. A basic assumption is that high participation rates in some countries and/or among highly educated persons may conceal that many of these individuals participate in rather short courses.
In addition to the more classical variables referring to education and occupational levels, we consider that the possible variation according to immigrant backgrounds is of interest. Many studies have found that the participation rate among immigrants is generally lower than among non-immigrants, though the differences according to immigrant backgrounds vary between the studies and by country (Barrett, McGuinness, O’Brien and O’Connell, Citation2013; Leuven & Oosterbeek, Citation1999; Offerhaus, Citation2014). Does this also apply to training intensity in terms of the total duration of training? Leuven and Oosterbeek (Citation1999) found that the effects on training intensity (measured in full-time weeks) of being an immigrant was non-significant in all countries except for the Netherlands where it was positive. Below, we will examine the situation concerning the possible effects of immigrant backgrounds in eight countries participating in PIAAC 2012 (OECD, Citation2013).
Hypotheses
The positive relationship between the participation rate and the education level can be explained in several ways. One explanation, which is based on Brunello (Citation2001), is that highly educated workers are to a larger extent hired in jobs and industries with higher skill requirements than less-educated workers. Since highly educated workers have a higher learning capacity, they are more likely to qualify for training than less-educated workers. Another explanation is that firms expect returns on their investments since training programmes are costly, so they will prefer to train workers who already have high levels of educational attainment (Albert et al., Citation2010). These explanations are formulated for training in general, but we find it reasonable to assume that they also hold for non-formal training in particular. However, such explanations mainly refer to training rates; high-educated persons have higher trainings rates, but the explanations are not necessarily applicable to training intensity in terms of the duration of training.
It is possible that one reason for the high participation rate in non-formal training among highly educated persons found in many studies is that they frequently participate in seminars/courses/workshops of short duration, thereby increasing their overall participation rate. We consider it reasonable to anticipate that when low-educated persons participate in training, they will quite frequently participate in courses of longer duration since they will benefit from, or need, more intensive training. Probably, employers would also prefer that low-educated workers participate in fewer courses of longer duration than courses of short duration, in order to increase their returns on training investments. Furthermore, frequently – particularly in the Nordic Welfare states – the costs of such long-term training for low-educated are subsidised by public funding. Based on these considerations, the first hypothesis is:
H1: Highly educated persons participate more frequently in non-formal training of short duration than low-educated persons.
Correspondingly, we assume that in high-performing countries, i.e. countries with overall high participation rate in non-formal training, many persons participate in courses/workshops of short duration which draws up the overall participation rate. Thus, the second hypothesis is:
H2: In high-performing countries, a higher proportion participate in non-formal training of short duration than in countries with lower participation rates.
Previous studies (see above) have shown that immigrants participate less frequently in non-formal training than non-immigrants. In this study, we distinguish between EU/Western and non-Western immigrants. Persons of non-Western origin are frequently refugees or have a residence permit on a humanitarian basis, or are family reunited with such persons, and are expected to stay in the country. The training may be partly sponsored by the government. In line with the first hypothesis (H1), we therefore expect that among persons who participate in non-formal training, non-Western immigrants more frequently participate in training of long duration than non-immigrants because the former will benefit from more intensive training.
We expect, however, that the same pattern will not apply to EU/Western immigrants who are mainly labour immigrants. It is reasonable to expect that the employers are less motivated to invest in training of long duration for this group because they may be expected to return to their home country and many of them have got their jobs exactly because of their education.
Based on these expectations, the third and fourth hypotheses are:
H3: Non-Western immigrants participate more frequently than non-immigrants in non-formal training of long duration.
H4: EU/Western immigrants participate less frequently than non-immigrants in non-formal training of long duration.
Data and methods
We use individual level data from the PIAAC (Programme for the International Assessment of Adult Competencies) database.Footnote2 The data are from the first round of PIAAC, carried out by the OECD in 2011–2012. The sample consists of employed persons aged 20–65 years living in eight European countries: Belgium, Denmark, Finland, France, the Netherlands, Norway, Poland and Slovakia. Only persons working as employees are included in the analysis; self-employed are excluded. One reason for this exclusion is that dummy variables for firm size are included as control variables in the regressions, and firm size is a variable that only refers to employees. Persons with missing values on at least one of the independent variables are excluded from the analysis, except that immigrants with unknown country of birth and persons with unknown occupation are included in the analysis, where both variables are represented by dummy variables.
There are two main reasons why the eight countries are chosen. The first is that half represent a group of countries that score very high on participation in non-formal training (Denmark, Finland, the Netherlands, and Norway) and the other half score low (Belgium, France, Poland, and Slovakia), see . The second reason is that we only want to include countries with information in the PIAAC database on variables that are central to our analysis, including detailed information on age, and country of birth and/or – for immigrants – information on their first language.
Table 1. Participation in non-formal training among all employees 20–65 years, by educational level and country (per cent).
Table 2. Participation in non-formal training among all employees 20–65 years, by immigrant background and group of countries (per cent).
Table 3. The distribution of training days (per cent) and the number of days in training (mean) among employees 20–65 years who had participated in non-formal training, by group of countries.
Table 4. The distribution of training days (per cent) among employees 20–65 years, who had participated in non-formal training by educational level and immigrant background.
Table 5. Estimated effects of workplace and individual characteristics on the probability of different intensities of participating in non-formal training.
Table 6. Estimated probability to participate in training of various duration, by educational level and group of countries.
The dependent variable – number of days in non-formal training
In the PIAAC questionnaire the respondents were asked about the total amount of time they have spent in the past 12 months on all types of non-formal training courses such as on-the-job training, private lessons, open or distance training, seminars or workshops. The answers could refer to whole weeks, whole days or hours (excluding time spent on homework or travel). We do not know whether the amount of time corresponds to a certain number of hours per week, whether training took place once a week over several weeks or whether it was a full-time course that took place during a period of time. The amount of time refers to the total time a person has spent on all these activities, measured in whole weeks, in whole days or in hours.
We have recalculated response referring to number of whole weeks into whole days (one week being five days), and we have recalculated the number of hours to the number of whole days (7 h correspond to one day), and thus creating a new variable which measures the number of days in training.Footnote3 Thus, the term ‘number of days in training’ refers to whole days spent in the past 12 months on all types of non-formal training.
Since the response refers to the total amount of all types of non-formal training, we cannot distinguish between days spent on work-related training and other types of training. However, we can safely assume that most of this training was work-related, because 94 per cent of those who stated the amount of training had participated in work-related training during the last year.
There is a skewed distribution of the number of days in training, and therefore we have chosen not to use the variable as a continuous variable in an OLS regression. Rather, we have grouped the answers on a categorical variable with four outcomes to be used as the dependent variable in multinomial logistic regressions (see below). The four outcomes are:
2 days or less
3–10 days
11–20 days, and
more than 20 days.
The starting point for this categorisation was a distribution of the individuals by the number of training days in quartiles. The last (fourth) quartile would then be 10 days or more, which we found too broad. More than four outcomes are very impractical in a multinomial regression, so instead we clustered two groups in the middle of the distribution. This appeared to be reasonable because the frequency distribution has peaks at 10 days as well as 20 days. Furthermore, preliminary analyses indicated that there was little to gain by dividing the large group ‘3–10 days’. The distribution of the dependent variable is shown in .
The independent variables
shows the mean sample values of all the independent variables used in the regressions. In accordance with our hypotheses, we use educational level and immigrant background as explanatory variables. A distinction is made between four educational levels: lower secondary school or less (the reference category), vocational upper secondary programmes, general upper secondary programmes, and higher education. Upper secondary education includes post-secondary, non-tertiary education. As mentioned above, concerning immigrant backgrounds, we distinguish between EU/Western immigrantsFootnote4 and non-Western immigrants because the reasons for their immigration generally differ. The variables are based on information on country of birth and, if this is lacking, information on the immigrant’s first language. A remainder-group with ‘unknown country of birth’ refers only to respondents in the Finnish and Belgian samples. They are not excluded from the analyses (but included as a dummy variable for unknown country of birth) because they constitute a large share of the immigrants in Finland. In the regressions, we use the category ‘non-immigrant’ as the reference category. We also include controls for whether the immigrants have the language of the immigrant country as first language.
In addition, we include several control variables in the estimations. The controls are country, gender, age, skills level, occupational level, weekly working hours, firm size (number of employees), and industrial sector.Footnote5 and include information on values and labels for these variables. The skills level variable is measured as numeracy skills, which in the PIAAC database consists of a set of 10 plausible values estimated for each person.Footnote6
The weighting procedure
The data are weighted by the full sample (final) weight which is in the PIAAC database. In addition, 80 replicate weights in the PIAAC database are included. The weighting procedure ensures representative data. The statistical program Stata is used when weighting the data and for the regression analysis. This program has a special command (called ‘repest’) which ensures correct estimates for standard errors for the scores on numeracy and literacy skills, which is important here because numeracy skills are included as a control variable.
In addition to the weights mentioned above, we have used a country correction term when weighting the data where pairs of four countries, or all eight countries, are looped. This procedure ensures that all countries have the same influence on the average values for the pooled countries.
The econometric method
The estimation results are based on multinomial logistic regressions. This type of regression enables us to examine simultaneously the effects of, for example, educational levels on the training outcomes of medium duration and long duration, versus training of rather short duration (2 days or less). The latter outcome (2 days or less) is used as the reference category in the regression model. We run the regressions for two groups of countries separately, i.e. for countries with high participation rates in non-formal training, and countries with low(er) participation rates. In the following, they are frequently labelled ‘high- and low-performing’ countries. The reason why we conduct two separate regressions is that the effects of the independent variables may differ between the two groups of countries.
Descriptives
An overview of the overall participation rates in non-formal training is shown in and , and the distribution of the number of days in training is shown in and .
The reasoning behind the dividing of the eight countries into ‘high- and low-performing’ countries is illustrated in . In Denmark, Finland, Netherlands and Norway, the participation rate is around 70 per cent. In the ‘rest’ four countries the participation rates vary between 42 and 55 per cent.
These results are only partly related to some key outcomes at the aggregate level, such as the level of educational attainment of the population and innovation rates. Additional analyses show that the share of the population with tertiary education in Belgium and France is at around the same level as for each of the high-performing countries, while the corresponding share is much lower in Poland and especially in Slovakia.
Otherwise, we find the same pattern with respect to differences by educational level in each of the eight countries in : The participation rate in non-formal training increases with increased educational level. The pattern is, however, especially skewed based on educational level in the four low-performing countries.
The participation rates vary less by immigrant background than by education level (). However, there is a tendency in both groups of countries that employees of non-Western origin participate less frequently in non-formal training than non-immigrants; this applies in particular to the low-performing countries.
The distribution of the dependent variable
Among those who have participated in non-formal training, there are small differences between the two groups of countries in the distribution of the number of days training (). There is a tendency that the proportion of employees participating in the shortest courses is highest in the low-performing countries. Otherwise, the distributions are remarkably similar in the two groups of countries. This does not mean that country differences within the two groups may not exist. We return to this issue later.
also shows that there are very small differences in the average number of days in training between the two groups of countries. The results in provide no support for H2. The overall high participation rate in the ‘high-performing countries’ is not caused by a very high proportion of employees participating in very short courses.
There are differences by education levels in the distribution of training days, which mainly apply to the category ‘2 days or less’ (). Contrary to what we expected (H1), the proportion with the least amount of training decreases with increased education level. This is most clearly seen for the four low-performing countries.
also shows that the non-Western immigrants in the high-performing countries participate more frequently than all other groups in rather long training courses. This is in accordance with our expectation in H3. However, the differences between non-immigrants and EU/Western immigrants are small, and the descriptive results do not give support to H4 which suggested that EU/Western immigrants would participate less frequently than non-immigrants in non-formal training of long duration.
It should be mentioned that training of long duration does not necessarily always mean ‘long courses’, since it is the total amount of training during a year that is measured. The individuals can have participated in many courses/learning activities during a year, which aggregate to a long total duration. The PIAAC database also provides information about this. For each of the four forms of non-formal training the respondents were asked: ‘How many of these activities did you participate in?’ The instruction to the interviewer was: ‘Count related learning activities held on different days as a single episode.’ In , calculations based on the answers to these four questions are presented, with reservations concerning the accuracy and comparability between the counted episodes of, for example, on-the-job training and private lessons.
Nevertheless, indicates that employees with more than 10 training days have participated in more learning activities (‘episodes’) than those with fewer total training days. However, employees with a total training duration of 20 days or more did not participate in more activities than those with a training duration of 11–20 days. Employees in the category ‘more than 20 days’ do, in fact, (on average) participate in longer courses. In the second-to-bottom row of , we have inserted the results concerning ‘average number of days’ seen in , and in the last row of Table A2 we have divided these averages by the corresponding average number of learning activities. These estimates clearly indicate that ‘short duration’ does not only mean fewer courses, but also shorter courses. ‘Long duration’ (more than 20 days) means longer courses. Medium-long duration (11–20 days) means (on average) both more activities as well as longer courses than the categories ‘2 days or less’ and ‘3–10 days’.
Regression results
The bivariate relationships seen in are further examined in which displays the estimation results from the multinomial logistic regressions, and where controls for many individual and workplace characteristics are employed. The overall picture is that higher-educated persons have a higher probability of participating in non-formal training of medium and long duration than persons with lower secondary school or less. This applies both to the high- and low-performing countries, with one exception: in the low-performing countries there are no significant difference in the probability of participating in ‘11–20 days training’ between persons with higher education and those with lower secondary school or less. Additionally, most of the effects of having either general or vocational upper secondary programmes are not significant. The substantial differences (marginal effects) will later be further described in .
also shows that both EU/Western and non-Western immigrants (as well as immigrants with unknown country of birth) have a higher probability of participating in training of long duration than non-immigrants, but this applies only to the high-performing countries. This gives support to H3 (which refers to non-Western immigrants), but only partly, because it is not supported for the low-performing countries. The results give no support to H4, where it was expected that EU/Western immigrants less frequently than non-immigrants would participate in the longer courses.
Illustrations of the estimation results
Some of the estimation results are illustrated in and Figures 1–3. The estimates in the table and each figure refer to theoretical persons, where the respondents are assigned average values on all other variables than the variable in question (e.g. educational level), i.e. the average values for the four high- and the four low-performing countries, respectively. (These average values are shown in the second and third columns of Table A1.) The purpose is to illustrate the isolated effect of the variable(s) in question (controlled for all other independent variables). The calculated probabilitiesFootnote7 are based on the estimates of the constant terms and the independent variables for each of the two groups of countries (presented in ).
The effects of education and occupation levels
Overall, the differences in the estimated probability of participating in training by educational level are not large (). However, the tendency is that the proportion who participated in the shortest courses (2 days or less) decreases with increased educational level, which is the opposite of what we expected in H1. The longest courses (more than 20 days) are more or less, equally distributed across educational levels, in both groups of countries. We recall that all the estimates refer to persons who have actually participated in training. As shown in , the overall participation rate is much lower among persons with low education level than among persons with higher education, and the participation rate is particularly low among the low-educated in the low-performing countries. In these countries, the overall participation rate is also quite low among persons with vocational upper secondary education. We see from that not only do these two groups participate in non-formal learning less frequently than others; when they participate, they also participate more frequently in the shortest courses. Also in general, i.e. across educational levels, the proportion participating in the shortest course is higher in the low-performing than in the high-performing countries. Also after controlling for several variables, we find that the results are contrary to what we expected in H2.
In addition to education level, the occupation level is of significance. As seen in , the coefficients for occupational levels are frequently quite large and significant, at least for the high-performing countries. Education and occupation levels correlate to a certain extent.Footnote8 The estimates in are based on assigned average values for the individuals on all other variables than educational level, including average values for occupation level. This implies that the effects of educational levels are smaller than what would have been the case if controls for occupation level had not been applied. Our next step is to illustrate results when we also allow occupation level to vary ().
Figure 1. Estimated probability to participate in training of various duration, by educational level, occupation and group of countries.
Notes: (1) The estimates in are based on the regression coefficients in for the high- and low-performing countries, respectively. (2) The respondents are assigned average values on all other variables than educational level and occupation, i.e. the average values for the four high- and the four low-performing countries, respectively (see Table A1).
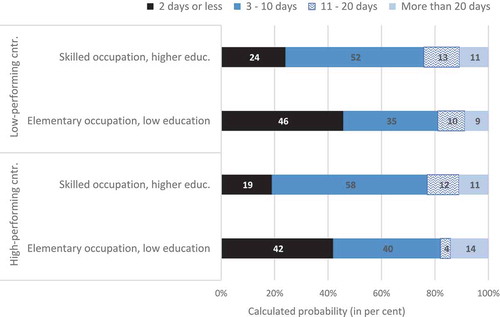
shows estimates for (i) persons who hold skilled occupations and have higher education degree, and as the other extreme, (ii) persons who hold elementary occupations and whose educational level is lower than upper secondary. For the sake of simplicity, we call the two groups ‘high-skilled’ and ‘low-skilled’. We should note that most of the coefficients for occupation levels are non-significant for the low-performing countries, so reservations must be made for the estimates for these countries.
In both groups of countries, persons with low education and who are holding elementary occupations (‘low-skilled’) participate in short courses far more frequently than those who have higher education and hold skilled occupations (‘high-skilled’). The low-skilled group not only participate in non-formal training less frequently than the high-skilled group of workers, in addition, if they participate, they frequently do so in training of short duration. It is the high-skilled persons’ tendency to participate in medium-length courses (3–10 days and 11–20 days), and not the very long courses, that results in the differences. These findings do not support H1.
The effects of immigrant backgrounds
shows estimates for EU/Western and non-Western immigrants, and where we compare these groups with non-immigrants. The graph includes estimates for the high-performing countries only since neither the effects of having non-Western nor EU/Western background were significant in the low-performing countries. The only significant coefficient relating to immigrant background in the low-performing countries is the positive effect on the outcome ‘more than 20 days’ of having the language of the country of immigration as one’s first language, which here is positive. In the high-performing countries the corresponding coefficient is negative. When taking the effects of being immigrants into account, this indicates that this small group of immigrants (i.e. those who have the language of the country of immigration as one’s first language), is more similar to the non-immigrants than immigrants who do not have the language of the country of immigration as their first language.
Figure 2. Estimated probability to participate in training of various duration, by immigrant background. High-performing countries.
Notes: (1) The estimates in are based on the regression coefficients in for the high- performing countries. (2) The respondents are assigned average values on all other variables than immigrant background, i.e. the average values for the four high-performing countries (see Table A1).
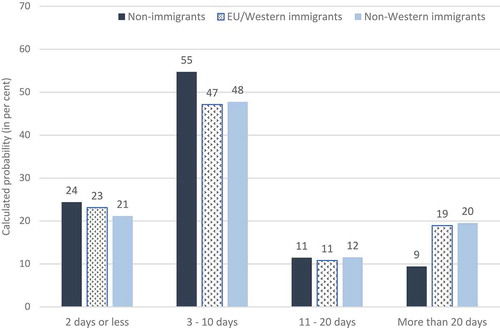
As for the high-performing countries, the only significant coefficient referred to the outcome ‘more than 20 days’, i.e. the difference in the probability between ‘less than 2 days’ and ‘more than 20 days’. The regression results clearly indicate that non-Western immigrants as well as EU/Western immigrants participate in training of long duration far more frequently than non-immigrants in the high-performing countries. Overall, the controlled results do not support H4, where it was expected that EU/Western immigrants would participate less frequently than non-immigrants in training of long duration. Nevertheless, the results support H3 (where it was expected that non-Western immigrants would participate in training of long duration more frequently than non-immigrants), but this only applies to the high-performing countries.
Country differences
Among the high-performing countries, the shortest courses are most common in Finland followed by the Netherlands (see and ). Furthermore, the longest courses occur more frequently in the Netherlands, which is also the case for Denmark. This means that there are structural differences concerning the individual level of training between these countries. Still, the substantial differences are not large (see ), and they do not seem to have implications for the overall training rate, which is rather similar (71 to 73 per cent, see ) in these three countries.
Figure 3. Estimated probability to participate in training of various duration, by country.
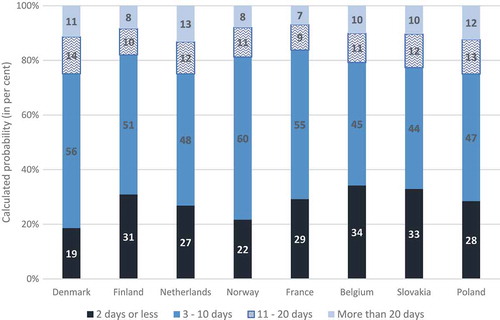
Among the low-performing countries, the longest courses are least common in France. France also has the lowest overall training rate (see ), so in total the French employees participate to a quite low level of training compared to all other countries. Otherwise, the differences in the distribution of duration of training between the low-performing countries are quite small.
The controlled distribution of the number of training days per country is displayed in . The calculations in are based on the results of . The respondents are assigned average values on all other variables than the dummy variable for the country, which is the average values for the four high- and the four low-performing countries (see Table A.1), respectively.
We do not find any pattern indicating that the individual countries with the highest training rates have the highest proportion with training of short duration, nor that those countries with the lowest training rates have the highest proportion of long or medium-long courses. The country differences in training rates () are not reflected in country differences in the distribution of the duration of training.
Other characteristics
Finally, the effects of the control variables () deserve some attention. The average numeracy skills level (we recall when controlling for education and occupation levels) has very little effect. It has no significant effect on duration of training in the low-performing countries. In the high-performing countries, increasing numeracy skills have a significant effect on only one outcome, which is ‘more than 20 days’. The effect is negative. This indicates that the probability of participating in very long courses decreases to some extent with increasing levels of skills.
For both the low- and high-performing countries we find that the probability of participating in training of more than two days’ duration increases with increasing weekly working hours. This is in accordance with the findings of Leuven and Oosterbeek (Citation1999). Furthermore, when it comes to firm size, the tendency is that employees in larger firms participate in long and medium-long courses more frequently than others. This corresponds to the findings of Orrje (Citation2000). Furthermore, we find that employees in sectors such as finance/estate, public administration and education participate more frequently than others in training of medium or long duration. This tends to apply to both groups of countries, but less clearly for the low-performing countries. The results concerning public administration is, however, similar in the two groups of countries, and in both groups employees in the education sector frequently participate in the longest courses.
Here, we speak of averages for a group of countries, because separate regressions for each of the eight countries would be excessive. But we would emphasise that there are differences between the countries when, for example, it comes to the effects of working within the education sector. In additional analyses, we have examined this sector. The highest proportion of employees in the education sector with the longest duration of training (more than 20 days) was found in Slovakia, the Netherlands and Poland (17–18 per cent), and the lowest share in France (7 per cent). All the five other countries were close to the average (13 per cent), and varied from 10 to 12 per cent.
Such findings also indicate that structural variations between countries exist that do not reflect, or seem to be related to, the overall participation rate in the specific country. Neither do they reflect the participation rates in non-formal training by country within the sector ‘education’. The underlying data show that this rate is particularly high in the Netherlands (82 per cent in this sample of employees 20 years or more) in addition to Finland (with 84 per cent), whereas it is much lower in France (57 per cent). Again, we find that some countries, such as the Netherlands have high participation rates as well as many participants in long courses, while the opposite is the case for France. But neither is this picture systematic. In Slovakia, many participate in training of long duration within the education sector, but the overall participation rate among employees in this sector is low (55 per cent) compared to the other countries.
Discussion and conclusions
The starting point for this study was that high participation rates in non-formal training do not necessarily mean intensive training. Moreover, we expected that the main predictors for the distribution of training participation, such as education level, can be different from what predicts for duration of training.
We found it reasonable to assume that one reason why highly educated employees are overrepresented in non-formal training is that many of them participate in short courses. This expectation is not supported by our findings. Highly educated persons participate less frequently than low-educated persons, in non-formal training of the shortest duration. Especially when we compare highly educated persons in skilled occupations with low-educated in elementary occupations, we find a very skewed distribution. The latter group participate much more frequently than the former in short-term training. This means that low-skilled persons have a particular disadvantage. Not only do they participate less frequently in non-formal education, they also participate more frequently in the least intensive education. This applies both to countries with a high participation rate, and low-performing countries.
Similarly, we assumed that one reason why some countries have higher training rates than others is that in the high-performing countries there are particularly many who participate in short-term training. This was not confirmed. In general, we did not find that the variation between countries in training rates is reflected in the variation in terms of the distribution of participants by duration of training. Furthermore, the distribution of duration of training is surprisingly similar in high- end low-performing countries, and the main difference refers to that the proportion that participates in training of very short duration is larger in the low-performing countries than in the high-performing countries. The consequence is that the relatively low training rates in the low-performing countries are not compensated by long duration of training among those who actually participate. This emphasises that these countries would benefit from investing more in non-formal training.
We had found arguments for our expectations concerning the relationship between duration of training and education level in previous studies, although the results here varied somewhat between countries that were studied (Leuven, Citation2001; Leuven & Oosterbeek, Citation1999; Orrje, Citation2000). In general, these studies found small variations in duration of training between low- and highly educated employees. We claim to have found something else: that highly skilled employees have far longer duration of training than low-skilled. The difference in results may have many reasons, one being that the studies have been undertaken at different times and in different countries. Another reason may relate to the measurement methods. The studies mentioned looked at the average duration of training for different groups. An average can conceal a rather skewed distribution. A very small group, for example, of low-educated, with particularly long duration of training, can affect averages considerably. Instead, we have chosen to look at the distribution of individuals, by different duration of training.
The findings concerning the distribution of duration of training among immigrants versus non-immigrants were less surprising compared to the initial expectations. The expectation (H3) that non-Western immigrants would participate more frequently than non-immigrants in non-formal training of long duration was confirmed by our findings, but only for the high-performing countries. This means that while low-educated employees in elementary occupations frequently participate in very short courses compared to highly educated in skilled occupations (which can be caused by either a form of discrimination or a lack of interest), these mechanisms do not affect the non-Western immigrants who participate in training of long duration more frequently than non-immigrants. In the low-performing countries no significant difference in duration of training was found between immigrants and non-immigrants. This also implies that there are no indications of differences by immigrant backgrounds in duration of training caused by discrimination or lack of interest. Rather, for the high-performing countries, we found support for our expectation that non-Western immigrants participate in training of long duration more frequently than non-immigrants since they will benefit from more intensive training, and because they probably frequently participate in training partly sponsored by the government.
The expectation concerning the EU/Western (labour) immigrants was of a different kind. We found it reasonable to expect that the employers would be less motivated to invest in training of long duration for this group, because they may be expected to return to their home country and many got their jobs precisely on account of their education. Therefore, we expected that EU/Western immigrants would participate less frequently than non-immigrants in non-formal training of long duration (H4). However, this was not supported, neither for the low-performing countries nor for the high-performing countries. Rather, for the high-performing countries, the opposite was found. Here, also the immigrants with EU/Western backgrounds have a higher probability of participating in training of the longest duration compared to the non-immigrants.
One can speculate on the reasons why immigrants, regardless of background, when controlling for education level and a number of workplace characteristics, have a greater tendency to participate in training of long duration than non-immigrants. The reason may be related to a greater demand for training to ensure one’s future, or to a greater need for training in order to deal with new organisational or working methods and/or language difficulties. As mentioned, this applies to the high-performing countries where the training opportunities in general are quite numerous, and where these clearly include immigrants.
Disclosure statement
No potential conflict of interest was reported by the authors.
Additional information
Funding
Notes on contributors
Liv Anne Støren
Liv Anne Støren is a sociologist and Research Professor at Nordic Institute of Studies in Innovation, Research and Education (NIFU) in Oslo. She is currently working with issues relating to adult learning in the workplace, as well as employer and graduate surveys. Her research revolves largely about what factors that affect the transition fromeducation to employment and educational careers, including studies of the situation among immigrants.
Pål Børing
Pål Børing is economist from the University of Oslo and senior researcher at NIFU. Børing has published scientific articles with focus on innovation, competence and training in firms, and articles in econometric journals. Børing is currently working as a WP leader in a research project funded by the Norwegian Research Council, called SILVER, which examines the relationship between lifelong learning and employability among older adults.
Notes
1. Non-formal training differs from informal learning, which can be organised but is not institutionalised (European Commission, Citation2006). Ferreira Sequeda, De Grip, and Van Der Velden (Citation2015) study the difference in informal learning on the job between permanent and temporary workers based on PIAAC data.
2. See the OECD’s PIAAC website (http://www.oecd.org/skills/piaac/) for information about how the data have been collected and established, the sample questions and questionnaire, etc.
3. 53 per cent of the respondents responded in terms of days, 28 per cent in terms of hours and 19 per cent in terms of weeks. Among those who gave answers in terms of the number of days (the majority), it can theoretically vary between individuals what they put in the word “day”. We have no information about this and must use the information available. It seems reasonable to calculate a work week as five days, as this is common in Europe. When it comes to conversion from hours to days, it also seems reasonable to calculate a working day like 7 hours (lunch not included). If instead, one day was set to for example 8 hours, the distribution on the dependent variable would be practically identical.
4. EU/Western immigrants consist of persons born outside the reference group of countries (the four high-performing countries or the four low-performing countries) with an EU/Western origin. This category refers to EU/EEA countries plus North-America or Australia/New Zealand. Non-Western immigrants consist of persons born in the rest of the world, which implies that East-European countries outside EU are defined as non-Western. The number of cases in the category ‘immigrant with unknown country of birth’ is reduced by using information on the immigrants’ first language (‘What is the language that you first learned at home in childhood and still understand?’). We have coded the first language of immigrants with unknown country of birth as EU/Western and non-Western in the same way as country of birth, and then categorised them as EU/Western and non-Western immigrants instead of including them in the category ‘immigrant with ‘unknown country of birth’.
5. Similar control variables are also used in other relevant studies. Leuven and Oosterbeek (Citation1999) and Leuven (Citation2001) also include gender, age, education, occupation, immigrant background, working hours (full-time/ part-time) and industrial sector among the independent variables. Furthermore, Orrje (Citation2000) includes gender, age, education, occupational level, working hours (part-time/full-time) and firm size among the independent variables.
6. We have chosen to use numeracy skills. The correlation between numeracy skills and literacy skills is very high (0.9).
7. The estimations for the multinomial regression (i.e. estimations displayed in the graphs and Table 6) are based on the following formulas of the response probabilities where Z is the intercept plus the effects of the control variables (Z = B0 + B1X1 + B2X2 + …), and j is an expression of the different outcomes on the dependent variable (the logit has j – 1 different sets of parameters), j = 1,2 (etc.). For an introduction to multinomial logit models, see Greene (Citation2018) and Wooldridge (Citation2010).
8. We have checked whether the correlations between occupation and educational levels are so high that there is a risk of multicollinearity, but they were found to be within acceptable limits.
References
- Albert, C., García-Serrano, C., & Hernanz, V. (2010). On-the-job training in Europe: Determinants and wage returns. International Labour Review, 149(3), 315–341.
- Barrett, A., McGuinness, S., O’Brien, M., & O’Connell, P. (2013). Immigrants and employer-provided training. Journal of Labor Research, 34(1), 52–78.
- Bassanini, A., Booth, A., Brunello, G., De Paola, M., & Leuven, E. (2007). Workplace training in Europe. In G. Brunelli, P. Garibaldi, & E. Wasmer (Eds.), Education and training in Europe (pp. 143–323). New York: Oxford University Press.
- Bishop, J. H. (1996). What we know about employer-provided training: A review of literature (CAHRS Working Paper #96–09). Ithaca, NY: Cornell University, School of Industrial and Labor Relations, Center for Advanced Human Resource Studies. http://digitalcommons.ilr.cornell.edu/cahrswp/180
- Blundell, R., Dearden, L., & Meghir, C. (1996). The determinants and effects of work-related training in Britain. London: The Institute for Fiscal Studies. http://www.ifs.org.uk/publications/1900
- Boeren, E., Nicaise, I., & Baert, H. (2010). Theoretical models of participation in adult education: The need for an integrated model. International Journal of Lifelong Education, 29(1), 45–61.
- Brunello, G. (2001), On the complementarity between education and training in Europe, IZA Discussion Paper No. 309, FEEM Working Paper No. 40.
- Desjardins, R. (2017). Political economy of adult learning systems. Comparative study of strategies, Policies and Constraints. Bloomsbury Academic. eBook.
- Desjardins, R., & Rubenson, K. (2011), An analysis of skill mismatch using direct measures of skills, OECD Education Working Papers, 63, OECD Publishing.
- European Commission. (2006). Classification of learning activities – Manual, Eurostat unit F4. Luxembourg: Office for Official Publications of the European Communities.
- Ferreira Sequeda, M., de Grip, A., & van der Velden, R. (2015), Does informal learning at work differ between temporary and permanent workers? evidence from 20 OECD Countries, IZA Discussion Paper No. 9322.
- Fouarge, D., Schils, T., & de Grip, A. (2013). Why do low-educated workers invest less in further training? Applied Economics, 45(18), 2587–2601.
- Greene, W. H. (2018). Econometric Analysis (8th ed.). New York: Pearson.
- Knipprath, H., & De Rick, K. (2015). How social and human capital predict participation in lifelong learning: A longitudinal data analysis. Adult Education Quarterly, 65(1), 50–66.
- Leuven, E. (2001), Studies in the economics of training, Thesis. UvA-DARE, University of Amsterdam.
- Leuven, E., & Oosterbeek, H. (1999). The demand and supply of work-related training: Evidence from four countries. Research in Labor Economics, 18, 303–330.
- OECD. (2013). Skills Outlook 2013: First results from the survey of adult skills. Paris: Author.
- Offerhaus, J. K. (2014), Further Training in Germany: Continuous Participation and the Impact of Attitudes and Personality, Dissertation the University of Bremen and Jacobs University Bremen.
- Orrje, H. (2000), The incidence of on-the-job training. An empirical study using Swedish data, Working Paper Series, No 6/2000, Stockholm: Swedish Institute for Social Research, Stockholm University.
- Wooldridge, J. M. (2010). Econometric Analysis of Cross Section and Panel Data (2nd ed.). Cambridge, MA: MIT Press.
Appendix
Table A1. Mean sample values of independent variables used in the regressions, by group of countries.
Table A2. The average number of training activities, by form of non-formal training and the number of days in training. Training activities among all employees 20–65 years who had participated in non-formal training.