
ABSTRACT
To what extent do favourable job characteristics contribute to the variation in numeracy skills between countries? Based on theory of maintenance and further development of pre-existing skills, this is explored by applying data on numeracy skills among employed persons in seven European countries participating in the Survey of Adult Skills (PIAAC). Regression analyses are used to examine the extent to which numeracy skills vary with job characteristics and education levels across the seven countries, when controlling for industrial sector, work hours, demographic variables (gender, age, Western and Non-Western immigrant background), cultural capital (books at home and parental education level). The findings indicate that job characteristics and the individuals’ educational level have large and equal statistical impact on the total skills variation in the seven countries. However, regarding the country- differences, variations in education level play a lesser role than job characteristics.
Introduction
The 2012 edition of the Programme for the International Assessment of Adult Competencies (PIAAC), surveying around 166,000 adults (16–65 years) in 24 countries, revealed large country differences in numeracy proficiency in the adult population (OECD, Citation2013). Socio-demographic factors such as educational level, immigrant background, socio-economic background and age were highlighted as important explanatory factors (OECD, Citation2013). However, skill levels vary significantly between countries even when controlling for the mentioned socio-demographic factors. This will be looked into more closely in the present paper. Job characteristics and the individual’s education level are among the central factors examined. To our knowledge, studies on the associations between varying job characteristics and cognitive skills level are rare, and one purpose is to contribute to bringing about new knowledge of a topic that is rarely examined.
Previous studies and theoretical considerations
The positive association between educational attainment and numeracy proficiency is well known, and formal education is a main mechanism for the development and maintenance of numeracy skills (OECD, Citation2013). For less- and intermediate-educated adults, the secondary education systems are important for individual’s development of key processing skills (e.g. numeracy), as differences in external differentiation (also called tracking) are found to account for a large part of the country variation (Heisig & Solga, Citation2015).
Working conditions in terms of job characteristics vary between countries and can possibly contribute to explain country differences in numeracy skills. Except for the ‘use-it or lose-it’ hypothesis (see below), there are – to our knowledge – few theoretical or empirical studies on the association between skills maintenance/acquisition and working conditions/job characteristics. However, some studies indicate that good working conditions are a factor that can facilitate skills maintenance or skills acquisition. In a Belgian study of 1162 employees in 31 companies, Kyndt, Dochy, and Nijs (Citation2009, p. 381) conclude that ‘in order to improve workplace learning, supporting the condition of “feedback and knowledge acquisition” contributes the most’. These authors also highlight that a higher level of education of employees increases the learning conditions for non‐formal and informal workplace learning and that workers have less access to learning conditions than staff members. In a study of skills obsolescence, Loo, de Grip, & de Steur (Citation2001) found that ‘physically and mentally taxing job conditions’ (p. 129) increased the probability of skills wear. Tynjälä (Citation2008, p. 150) in a review of workplace learning, summarises that ‘people learn at work by participating in various working practices, collaborating with colleagues and clients and meeting new challenges’. This is in line with Skule’s study (Skule, Citation2004) based on Norwegian survey data (n = 1500), where he identified seven aspects that positively affected learning at work. This included a high degree of exposure to demands from customers or managers; managerial responsibilities; superior feedback through seeing direct results of the work; and management support for learning.
Other individual background characteristics are important for the level of skills such as age, parental education level and immigrant backgrounds. The factor ‘age’ refers to how skills acquisition and skills loss occur throughout the lifetime. The ‘use-it or lose-it’-hypothesis, which is discussed by Salthouse (Citation2006) among others, concerns the assumption that the skills might diminish if they are not used. Albæk (Citation2016) aimed to test this hypothesis using PIAAC data. He argues that an implication of the ‘use-it or lose-it’ hypothesis is that the deterioration of skills with age might be more pronounced in occupations with a limited use of skills than in occupations with more intensive use of skills. Albæk found a robust pattern across all the 21 countries that were examined, namely that skills declined from the age of 35 both for high- and low-skilled workers at about the same pace. He concludes (p. 349) that ‘the evidence in the present paper does not support the “use-it or lose-it” hypothesis’. It should be mentioned that Albæk’s study was based on cross-sectional data and did not control for workers’ earlier type of work, the actual use of the skills, or other characteristics of the work situation.
In addition to Albæk’s study, several studies have tried to determine why skills seem to decline over time and whether this is due to cohort effects, period effects, or age effects (see for example, Barrett & Riddell Citation2016; Allen & van der Velden, Citation2013; Desjardins & Warnke, Citation2012; Levels & van der Velden, Citation2013; OECD, Citation2013). Desjardins and Warnke (Citation2012) argue that the effects are difficult to disentangle. Still, they found evidence to suggest that adults experience skills loss as they age. This is supported by Levels and van der Velden (Citation2013), who showed that most of the differences in numeracy skills were accounted for by education and experience, but found a small negative age effect on skills. Contrary to Albæk (Citation2016), Levels and van der Velden argue that the use of relevant skills can prevent skills loss, especially for older people, but suggest that skill proficiency and skills use are intricately connected.
Parental education is another important predictor of the individual’s skills level. PIAAC 2012 revealed higher average numeracy proficiency for adults with at least one parent who had completed tertiary education than for those with neither parent having completed upper-secondary school (OECD, Citation2013). The relationship between parental education level and school achievements is well-known and explained sociologically by theories of cultural and social capital, ‘social position’ theory and rational action theory (see for example Boudon, Citation1974; Bourdieu, Citation1977; Breen & Goldthorpe, Citation1997). Hægeland, Kirkebøen, Raaum, and Salvanes (Citation2010), using data on cousins with twin parents and adopted children, found small causal effects of parental education level on children’s school achievement that were much smaller than the observed relationship. Other researchers (for example Desjardins & Warnke, Citation2012) point out that conclusive evidence on the role of nature versus nurture remains elusive.
The composition of the population in terms of the proportion of international migrants is another factor that may have an impact on country differences in skills proficiency. Lind and Mellander (Citation2016) found that although PIAAC 2012 revealed large skill differences between non-immigrants and immigrants (not distinguishing between Western or non-Western immigrants), the connection between these differences and the country ranking is elusive. They conclude that ‘if you are not satisfied with your country’s performance in PIAAC, don’t blame the immigrants!’ (p. 46). Even though a country’s relative position in such rankings may be little affected by the proportion of immigrants in the population, immigrant background in terms of Western and non-Western origin could contribute to explain country differences in numeracy skills. Although the skills of immigrants are poorer than that of natives (OECD, Citation2013), it is hardly examined how this varies by the immigrants’ origin (e.g. European, other regions). Based on data from more than 9000 Dutch immigrants, Driessen and Merry (Citation2011) revealed large differences in numeracy achievement between different ethnic groups. In a multilevel model based on PIAAC data from 16 Western countries, Levels, Dronkers, and Jencks (Citation2017) revealed that about half of the cross-national variance of numeracy skill gaps between natives and first-generation immigrants was explained by the immigrant populations’ demographic and socioeconomic characteristics, employment, and language proficiency. They conclude: ‘Skills gaps are smaller in countries where labour markets are less protected, and where education is better suited for educating immigrants’ (Level et al., Citation2017, p. 20). Immigrants’ origin is a policy-relevant question because the demography of European countries is changing dramatically, particularly in Northern Europe, due to an increasing international migration in recent years. According to the UN International Migration Report 2015, the countries focused in this paper have a high proportion of international migrants, with the exception of Finland.
Another possible explanation for the country differences in skills proficiency in PIAAC 2012 is variation in the quality of the school systems. Information on this is, however, scarce as cross-country comparisons like PISA (Programme for International Student Assessment) are rather new. PISA tests functional skills that students have acquired by the end of compulsory school (OECD, Citation2014), and can as such give an indication of country differences in school system quality. Still, and obviously, as the first PISA cycle was in 2000 it does not reflect school system quality at the time when most of the PIAAC 2012 population (aged 16–65) attended school. Nevertheless, PISA does indicate variation in the current school system quality in the seven countries included in the present study. While the Netherlands, Finland, Belgium and Denmark scored significantly above the OECD average in mathematics in PISA 2012, the UK, France, and Norway scored average (). Comparing results from PISA 2000 and 2012 with corresponding age cohorts from PIAAC 2012, Gustaffson (Citation2016) concludes that the quality of schooling has lasting impact on adult literacy and numeracy performance levels.
As mentioned, Norway, the UK and France had average scores on PISA 2012. Norway did, however, score relatively higher on adults’ skills in PIAAC 2012 than on 15-year-olds’ skills in PISA 2012, while the UK and France scored relatively lower in PIAAC. Many factors could account for such findings, one for example being varying quality of the school systems for different cohorts in the respective countries. The latter refers to questions that cannot be answered by the data is used in this study. However, we examine other possible factors that can be of importance for the variation in adult skills such as varying job characteristics. These are, for example, use of skills at work, non-formal training on the job, the degree of challenging work tasks, cooperation and autonomy.
The present study aims to add to the knowledge in this field by applying data from seven European countries participating in PIAAC 2012 to examine the extent to which there is an association between working conditions in terms of certain job characteristics, and cross-country variation in numeracy skills. The seven countries have much in common in that they have been EU/EEA members for at least 20 years, have long welfare state traditions, and a GDP above the EU average. They perform, however, differently in cognitive skills in PIAAC 2012. The countries included are: Belgium, Denmark, Finland, France, the Netherlands, Norway and the UK. The premises for the choice of these countries are further described below under the heading ‘The sample’.
Research question
The research question guiding this study is: To what extent is there an association between within- and cross-country variation in numeracy skills and job characteristics that exist beyond education levels, when demographic variables, cultural capital and parental education level are accounted for? One central purpose of the current study is to perform a ‘contest’ between education level variables and work characteristics variables in explaining cross-country differences in numeracy skills as well as within-country differences. Based on the literature review we hypothesize that cross-country differences in numeracy skills among employed persons – as well as within country differences – are associated with:
Demographic variables, including immigrant backgrounds,
Cultural capital-related variables,
The educational level of the workforce and
Job characteristics.
When the aim is to examine the extent to which – and possibly why – skills vary, we should emphasize that the purpose is not to identify the real causes behind the development of a person’s skills. Cross-sectional data such as the PIAAC data cannot identify such causes. Moreover, reciprocal relationships may exist between the dependent variable (skills) and some independent variables, for instance a form of a virtuous circle between tasks and skills, indicating correlations but not necessarily causes. Nevertheless, it is meaningful to examine these relationships and how the skills vary by certain sets of variables, bearing in mind that we cannot state causal relationships.
Data and method
Data were gathered face-to-face, mostly in the participants’ homes. Numeracy skills, in addition to literacy and problem-solving skills in technology-rich environments, were assessed directly whereas information about demographics, education, social and linguistic background, employment, job characteristics and skills use, was obtained through an interview. For more details about the assessment and sampling, see Technical Report of the Survey of Adult Skills (OECD, Citation2016a).
The sample
The respondents included in the analyses are employed 20–65-year-olds (the vast majority of 16–19-year-olds are students) from Belgium, Denmark, Finland, France, the Netherlands, Norway and the UK. The purpose is to compare countries that in many ways are quite similar (EU/EEA members for at least 20 years, long welfare state traditions), but which score differently on numeracy skills. EU countries in southern Europe that have greater financial problems and generally lower GDP than the EU average are not included. This also holds for EU countries in Eastern and Central Europe that joined the EU in the 2000s, and which generally have low GDPs. Further, we have only included countries with information in the PIAAC database on variables that are central to our analysis, including detailed information on age as well as country of birth and, if the latter is inadequate, information on the immigrant’s first language.Footnote1 In addition, another consideration is that if even more countries are included for comparison, the overview will easily be lost.
The countries included score differently on numeracy with Finland the highest, closely followed by four countries that scored quite similar, – Belgium, Denmark, the Netherlands and Norway, while France and the UK score significantly lower. In addition, the countries are composed differently in terms of immigrant populations, and with respect to parental and own educational level.
Weighting
When using PIAAC data, it is important to take the sample design into account and ensure representative data through weighting procedures. The full (final) sample weight is used in addition to 80 replicate weights in the PIAAC data base (the latter because the participating countries used different replication schemes). When weighting the data, the ‘repest’ command in the statistical programme Stata was used. In tables where the seven countries are pooled ( and , the last column), a country correction term is used in addition, to ensure that all countries have the same influence on the average values for the pooled seven countries.
Table 1. Average numeracy skills level in the seven countries. Uncontrolled means, and estimates based on different regression models.
Table 2. Linear regression of numeracy skills.
The dependent variable
The dependent variable is average numeracy skills. The numeracy measure in PIAAC was designed to address four cognitive strategies necessary to respond to or use a given mathematical content appropriately: identify, locate or access, act upon and use, interpret, evaluate, analyse and communicate (OECD, Citation2016a). Different types of mathematical content and contexts were included. The scoring range was 0–500 points. As PIAAC applies a matrix-sampling, each participant does only solve a subset of the full set of items. By the use of item-response theory techniques (see OECD, Citation2016a), scores are estimated on a common numeracy scale for all participants, and a set of 10 plausible values are estimated for each participant (OECD, Citation2016a). The variables with these plausible values are provided in the international PIAAC database. By means of the ‘repest’ command in the statistical programme Stata we obtained averages of the parameter estimates achieved for the different plausible values and the corresponding correct estimates of the standard errors. The average skills are analysed by use of linear (OLS) regressions. The different steps are further described below.
The independent variables
When exploring the extent to which there is an association between job characteristics and the variation in numeracy skills across European countries, we control for several factors that previous research has found to affect skill differences, among them age. Certain favourable characteristics of the work situation may possibly reduce the negative effect of aging. For our purposes, age is an important control variable along with other variables to investigate the possible net statistical effectFootnote2 of job characteristics. This implies that the relationship between age and skills is not the main issue in this paper, as age will be used merely as a control variable.
Information on immigrants’ background is of interest for two reasons. It is of interest to know the extent to which (employed) immigrants with varying origin score very differently from the native population. The main purpose here is to control for relevant variables relating to immigrant backgrounds when comparing countries.
Mean sample values of all the independent variables are shown in . The control variables are demographic variables, cultural capital related variables, industrial sector, and working hours. The cultural capital variables include the number of books at home (scale 1–6, from 1 = ‘10 books or less’ to 6 = ‘More than 500 books’), and parental education level. Mother and father’s education level refers to below upper secondary education (used as the reference category), upper secondary level, and higher education (HE). The demographic variables are gender (female = 1); immigrant backgrounds and age. We also include a second order variable for age (age squared) because of the curvilinear relationship between skills and age.
Immigrant backgrounds
A distinction is made between immigrants of EU/Western and Non-Western origin. EU/Western origin is here defined as EU/EEA-countries, North-America or Australia/New Zealand. Most persons (about 96%) in this category have European background (72% from Western Europe, and 24% from new EU member states in Eastern Europe). The rest, only 4%, are coming from North-America or Australia/New Zealand. Non-Western origin refers to persons born in the rest of the world, including East-European countries which are not EU-members. Immigrants from these East-European countries (mainly former Yugoslavian states plus a few from Albania and Ukraine) constitute only 6% of the non-Western immigrants in the sample. The largest groups of those of non-Western origin are from Arabic and African states or from Asia (the latter including Turkey and Russia). The reason for distinguishing between EU- and non-EU-members in East Europe, is that EU-labour immigration represents a different form of immigration than immigration from the rest of the world, where refugee (or reunification with refugees) immigration has become the typical form of migration.
Information on country of birth did not exist for all the immigrants, only in the Danish sample. The number of cases with ‘unknown country of birth’ is reduced by using information on the immigrants’ first language (‘What is the language that you first learned at home in childhood?’). For immigrants with unknown country of birth,Footnote3 their first language was coded as EU/Western and Non-Western in the same way as country of birth, and they were then categorised as EU/Western and non-Western immigrants instead of ‘unknown country of birth’. For the Finnish sample, a rest-category of a certain size exists for ‘unknown country of birth’. This group constitutes an own dummy variable in the regressions. The reason for including those with unknown country of birth in the analyses is that otherwise, we would exclude a large part of the immigrants in Finland. Being a non-immigrant is the reference category in the regression analyses.
A control is also made for whether the immigrant’s first language was the same as the language of the country of residence when the survey was undertaken. (For Norway and Denmark, the first language was considered as the language of the country where they resided if it was a Scandinavian language, i.e. Danish, Norwegian or Swedish. For Belgium, the same refers to French and Dutch.)
Own education level and job characteristics are considered as the explanatory variables. For own education level, five categories are distinguished: Below upper secondary education (used as the reference category); vocational upper secondary level; academic upper secondary level (both academic and vocational upper secondary include non-tertiary post-secondary education); professional higher education, and bachelor’s or master’s degree or higher. The reason for the latter, i.e. including bachelor’s and master’s degree in the same category, is to create comparable categories between countries.Footnote4 Further, dummy variables for the industrial sector are included as control variables because the skills level varies by industrial sector and the countries may differ with regards to the distribution of industrial sectors.
We employ variables from the PIAAC database that provide information on characteristics of the respondent’s job and situation at work. These are as follows.
Employer supported non-formal training
(yes = 1, no = 0). The training is regarded as employer supported if the respondents have answered that they had received grants from the employer to participate in the training (totally or partly), or they had participated in on-the-job-training and responded that there were ‘no such costs’.
How often are numeracy skills used at work?
An index in the PIAAC database covering many questions (scale 1–5) in the survey on the use of numeracy skills at work in different situation, is used as a longitudinal variable. It is a derived variable, where 0 refers to persons responding ‘never’ to all the questions concerning use of numeracy skills.
Challenging work task
A basic assumption is that people who frequently solve both simple and complex problems at work will have a greater chance to increase or at least maintain their cognitive skills than others. ‘How often solving simple problems’ as well as ‘How often solving complex problems’, both with the scale 1–5, are used as independent variables.
Working physically
We find it reasonable to assume that having a work situation where one mainly works physically is less beneficial for increasing or maintaining cognitive skills than if the opposite is the case. A variable for working physically is derived from two questions in the PIAAC questionnaire covering how often the respondents are ‘working physically for a long period’, and how often they ‘use hands and fingers’. The initial analysis of the data confirms that there is a linear relationship between the skills level and both these variables (‘working physically’ and ‘using hands and fingers’). A new variable based on both variables ranging from 1 to 5 is established and used as a continuous control variable in the regression.
Autonomy and flexibility
It is probable that having a work situation which involves a high degree of autonomy and flexibility, and where one works independently, will have positive impacts on cognitive skills. Several questions in the PIAAC survey cover this issue. The answers to these questions are correlated. We have created a new variableFootnote5 for ‘autonomy and flexibility’ with a scale ranging from 1 to 5.
Cooperation with others at work
Cooperation with others at work will normally contribute to enhance or at least maintain cognitive skills. On the other hand, if one has a work situation where one must cooperate with others all the time, it is reasonable to expect that one will have little time for reflection and to learn new things. Thus, we expect a curvilinear relationship between the intensity of cooperation with others and include dummy variables for never cooperating at work and always cooperating at work. The medium level of cooperating at work is used as the reference category in the regressions.
We have also included a dummy variable for sharing work-related information (1 = ‘quite often’, 0 = ‘rather seldom’). Initial analyses showed that the skills level for those who did this rather seldom (never; less than once a month; less than once a week) was significantly lower than among those who answered ‘at least every week’ or ’every day’.
Findings – regressions per country
OLS regressions of numeracy skills for each of the seven countries were run to examine the association between numeracy skills and the independent variables in each country, i.e. within-country differences. For each of the seven countries these regressions were run in four steps. The four steps include a varying amount of control variables (see the description below). The number of observations is the same in each of the four steps. One purpose was to compare the explanatory power of each model, i.e. to examine the extent to which the power increases when additional control variables are included. The first step includes all the background variables (Model 1). The second step (Model 2A) includes controls for the individual’s education level in addition to the variables included in Model 1. In the third step (Model 2B) controls for variables covering job characteristics are included as well as the background variables included in Model 1, although not including controls for the respondent’s education level. The fourth step (Model 3) includes all the independent variables.
Detailed regression results for each of the seven countries (which amounts to 28 regressions) are not shown due to space limitations, but can be delivered from the authors on request. Each of the regression models per country include the same variables for all the countries that are examined. A summary of the findings is shown in .
The first row () shows uncontrolled average numeracy skills for each country. The next rows show estimates for average skills for each country according to the different models including different sets of control variables. In addition, the adjusted R-square of each model for each country is depicted, indicating the significance of the different sets of control variables for the within-country differences.
The estimates referring to Models 1 to 3 in refer to a situation where the distribution of the independent variables is the same in all countries. However, since the association between the independent variables and the dependent variable may vary between the countries, the country-specific coefficients for the independent variables are used in the estimations in the rows referring to Models 1 to 3. The respondents are assigned the mean values of the independent variables (depicted in the last column of , which refer to the seven countries taken together). This applies to each of the countries and each of the models. Thus, we have chosen to illustrate the country differences when referring to a theoretical situation where the distribution of the independent variables is the same in all countries, but where the coefficients for these variables are ‘allowed’ to vary.
In Model 1 (), the following variables are included in separate regressions for the seven countries and constitute the basis for estimates for the average skills in the different countries in the row referring to ‘Model 1’: Female (= 1), average age, age squared, immigrant backgrounds (dummies for Western immigrants, non-Western immigrants, Immigrants with unknown country of birth and whether the language of the immigration country is the first language), parental education level (dummies for mother upper secondary, mother HE, father upper secondary, father HE), no. of books at home, weekly working hours, and industrial sector (11 dummies).
In Model 2A, controls for own education level are included (see the description in the section Independent variables) in addition to the background variables in Model 1.
In Model 2B, controls for job characteristics are included (see description in the section Independent variables) in addition to the background variables in Model 1.
In Model 3, all the above-mentioned variables are included.
These conditions imply that – compared to the uncontrolled means – the average skills level in the full model (Model 3) decreases for Finland and Norway; it does not change much for Denmark, Belgium and the UK, and increases for France and the Netherlands. The main reason for these changes is that the original (‘real’) distribution of the independent variables is favourable in Norway and Finland, and less favourable in France and the Netherlands.
The increase in the adjusted R-square of including education level is seen when comparing Model 1 with Model 2A, and a similar increase in the adjusted R-square of including (instead) controls for job characteristics is seen when comparing Model 1 with Model 2B. Both sets of variables separately contribute to a rather large increase of the adjusted R-square, in all the countries.Footnote6
Country differences conditioned on different control variables
illustrates the country differences depending on the different models, based on the estimates in . As mentioned, in and , we have taken into account that the effects of the independent variables may differ between the countries. In , all the countries are compared to Norway, which is set to zero.
Figure 1. Estimated differences in the numeracy skills level, in different models. Norway is the reference and set equal to 0.
The estimates are based on . See further description of the procedure for the calculations in the section ‘Regressions per country’.
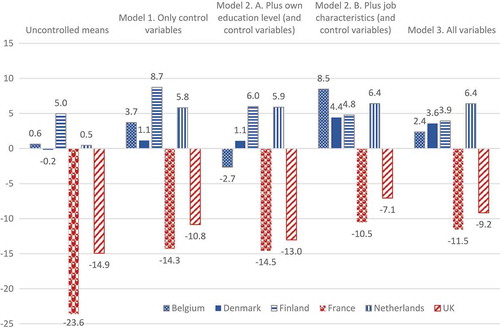
Concerning the uncontrolled means, France and the UK have significantly lower numeracy skills than all the five high-scoring countries, and only Finland has significantly higher numeracy skills than Norway. The controls in Model 1 for demographic variables, cultural capital-related variables as well as industrial sector and working hours, change the picture. The difference between Norway and Denmark on the one hand, and France and UK on the other, is reduced.
When control for the respondent’s education level is included (Model 2A), the picture does not change very much, except for Belgium. When controlling for the background variables in Model 1, the skills level in Belgium increases compared to Norway and Denmark since the distribution of the background characteristics is less fortunate in Belgium than in Denmark and Norway. However, the educational level is quite high in Belgium (see ) compared to the average for the seven countries. Therefore, when including controls for this (Model 2A) and assigning mean values for education level, the numeracy skills level in Belgium is reduced from Model 1 to Model 2a relative to Denmark and Norway.
Control for education level has limited impact on the country differences in numeracy skills, despite the fact that it has a very large impact on the total variance. The reasons for this are twofold: i) The education level is relatively high among employed persons in all the countries, and ii) many of the control variables (e.g. parental education level, immigrant backgrounds, industry) correlate to some extentFootnote7 with own education level. Thus, the effects of the background variables are reduced when including controls for own education level.
When controls for job characteristics (Model 2B) are included instead of education level, the picture is changed considerably. The difference between Norway on the one hand and France and UK on the other is further reduced (compared to Model 1). Moreover, the difference between Norway and three of the other high scoring countries is increased. The exception is Finland, where the distribution of job characteristics is rather positive. When controlling for job characteristics, the scores for Finland are relatively decreased.
The picture in Model 2B is largely maintained in Model 3 where all independent variables are included. One exception is Belgium. Including controls for education level again decreases the score for Belgium (from Model 2b to Model 3).
The seven countries taken together: results of regression analyses
Above ( and ), the focus was on the significance of the different sets of control variables for the within-country differences where we considered that the association between the independent variables and the dependent variable may vary between the countries. Based on this, we also illustrated that the country differences in numeracy skills were largely conditioned by the distribution of the independent variables in the countries. Varying job characteristics and varying distributions of the background variables (parental education level, books at home, industrial sector etc.) had the greatest impact on the country differences, whereas controls for education level had less impact on the country differences in numeracy skills. Below, regressions on a pooled sample of the seven countries are shown (). The same steps and the same modelling as described above () is used.
In , the average associations (across countries) between the independent variables and numeracy skills are displayed. One purpose is to examine whether the individual’s education level contributes more/less to the total variation than job characteristics when the seven countries are taken together. In the analyses, we have included a country correction term as a part of the weighting procedure making the seven countries of the same size to ensure that the largest samples do not have disproportionate influence on the results.
First, we notice that the statistical effects of the dummy variables for ‘country’ in the different models are somewhat different from the magnitude of the country differences that was displayed in . This is because the estimates in refer to the average statistical effects of the independent variables (seven countries pooled), while in the estimates are based on country-specific effects of these variables. Still, the general picture is largely the same.
The adjusted R-squares of Model 2A and 2B are quite similar, indicating that educational level and job characteristics have the same statistical impact on the skills variation.
There is a certain correlation between job characteristics and educational levels, and naturally, the coefficients for education level are smaller in Model 3 than in Model 2a. Vice versa, the coefficients for job characteristics are smaller in Model 3 than in Model 2B, but still significant. Only one of the variables covering job characteristics – ‘problem-solving complex problems’ – is not significant in Model 3, probably because of its relationship with education levels. In fact, also ‘solving simple problems’ and ‘solving complex problems’ correlate (we remind that the parameters in multicollinearity tests are within acceptable limits). However, the extent to which one solves simple problems has stronger significance than solving complex problems, ‘all other things equal’. Although we cannot safely state the causal direction, one plausible interpretation can be that frequent problem-solving, also when it refers to simple problems, may contribute to maintain (or increase) numeracy skills.
One should also note that the dummy-variables ‘always cooperating at work’ and ‘never cooperating at work’ both have large negative effects. The reference group is here those with a medium level of cooperating with others at work. The results confirm the initial assumption of a curvilinear relationship between the amount of cooperation at work and numeracy skills. Too much or too little cooperation is associated with lower numeracy skills.
There are correlations between some independent variables covering job characteristics (as mentioned multicollinearity tests are done), and one question can be raised concerning the sensitivity of the models, i.e. Models 2B and 3, which include job characteristics. What happens if we omit one or more variables, for example the variable ‘employer supported training’? In this case, very little happens. The coefficients for the independent variables in the full model are very similar to the coefficients displayed in Model 3, . When omitting the variable ‘employer supported training, the adjusted R-squares of Models 2B and 3, are also very similar to those depicted in . However, if we omit the variable ‘use of numeracy skills at work’ many of the effects of the other independent variables are changed. These changes refer mainly to the coefficients for the other variables covering job characteristics. All these coefficients tend to increase when omitting the variable ‘use of numeracy skills a work’. The adjusted R-square is slightly reduced.Footnote8 We interpret these findings so that all these variables have independent effects, but that in addition, using numerical skills at work provides a further (and important) contribution in explaining the variety of skills.
Education levels and job characteristics
summarises and illustrates some findings in . In the upper part of , the respondents are assigned average values on all variables except job characteristics. This part of the graph illustrates that among persons with the same educational level, large differences in the skills level exist between groups according to the varying characteristics of their jobs. The estimates in the graph are based on Model 3 ().
Figure 2. Estimated variation in numeracy skills level by educational level, and by job characteristics.
The estimates are based on the results of Model 3, . A description of the conditions underlying the calculations is presented in the text.
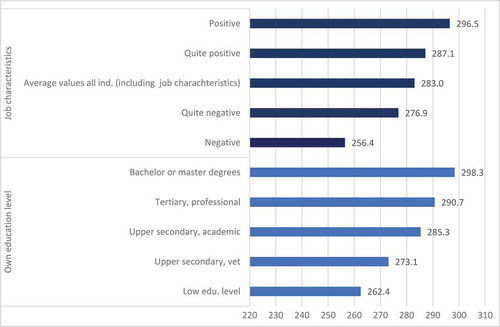
Likewise, the marginal statistical effects of educational level are illustrated in the lower part of . The differences in numeracy skills level by the respondent’s educational level are large, also after controlling for job characteristics etc.
None of the examples that refer to varying job characteristics refer to extremely good (value 1 on the ‘positive’ variables resp. value 5 on the ‘negative’), nor extremely poor work situations, which occur rather seldom if we combine them with similar scores on other variables as well. Definitions of the groups by job characteristics in are given in .
The examples refer to theoretical persons. However, additional tests reveal that persons with job characteristics that may refer to a less favourable work situation on one variable quite often experience this also in other areas. Additional analyses show that if we look at the quarter with lowest scores on use of numeracy skills at work, we find that they score lower on positive factors like autonomy and flexibility, problem-solving simple problems, sharing work-related information and employer supported training, and higher on working physically. Further they either always or never cooperate at work, more frequently than those who score (quite) high on use of numeracy skills at work. Accordingly, the group who share work-related information less frequently than once a week, score lower than others on autonomy and flexibility, the use of numeracy skills at work, problem-solving, and employer supported training, and score higher on working physically, and more often than others they never cooperate at work.
Immigrant background and other background variables
Finally, the background (control) variables deserve some reflection. It may be observed that the effects of age (first order and second order) tend to decrease when controls for educational level and job characteristics are included. Still, additional analyses show that in practice the estimated age differences according to the different models are not very large. For example, in Model 1 a person who is 55 years of age scores (on average) 11.5 points lower than a person aged 35. Based on Model 3, the corresponding difference is 9.6 points.
Another interesting feature of the control variables is the sharp decline in the effects of industrial sectors of including controls for educational level (cf. the effects of industrial sectors in Model 1 and Model 2a). This shows that an important reason why skills vary between industrial sectors is that educational levels vary by sector. However, we find the same picture when comparing Models 1 and 2b, including controls for job characteristics instead of education level. Also in Model 2b, the effects of industrial sector decline compared to Model 1. This implies that the skills variation between industrial sectors, is not only related to the fact that educational level varies by sector, but is also related to the fact that job characteristics vary by sector.
The differences in skills level according to some other important background variables, i.e. parental education level and immigrant backgrounds, are illustrated in . The estimates are based on Model 3 () where controls for all variables are included. The persons are assigned average values on all other variables than the variables in question (immigrant backgrounds and parental education level respectively).
Figure 3. Estimated skills variation by parental educational level, and by immigrant backgrounds.
The estimates are based on the results of Model 3, . A description of the conditions underlying the calculations is presented in the text.
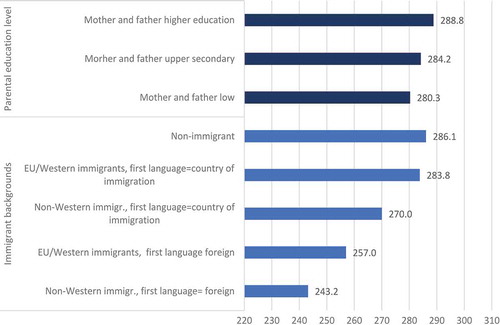
The average differences by parental educational level are rather small even though the examples shown here include the extremes where both mother and father have low education, and where both mother and father have higher education.
When it comes to immigrant background, the differences are larger, though depending on whether the immigrant’s origin is non-Western or EU/Western, and whether the immigrants have the language of the immigration country as their first language. The latter group is very small (see ), but nevertheless the results illustrate that the chance to perform well on the numeracy test depends on whether the language used in the test is the first language.
Discussion and conclusions
In this article we have aimed to explore whether there is an association between job characteristics and variation in numeracy skills; that is within-country variations in skills and the variation between countries. Further, we examined whether such associations exist beyond education level when demographic variables and cultural capital are accounted for. To explore this, we applied data from seven European countries participating in PIAAC 2012.
The results of the regressions indicate that all sets of variables contribute to explaining the differences. Job characteristics and the respondent’s education level contribute equally in analyses of the pooled seven countries (given background characteristics), and roughly equally much in each of the countries that were examined. To some extent these two sets of variables capture the same underlying differences since their total contribution to the explanatory power is smaller than the sum of their marginal contributions. Still, job characteristics are clearly significant also after controlling for education level, and vice versa. With reference to what affects the ‘between country’ differences, variations in job characteristics play a major role compared to the role of variation in education levels.
For some country comparisons, the controls for job characteristics, education level and background characteristics (parental education level, industrial sector, etc.) have a large impact, for example when comparing France with Norway, Denmark, Belgium and Finland, or comparing the Netherlands with Norway. For other country comparisons (Norway, Denmark, Finland and Belgium) these controls have little (or smaller) impact on the country differences in numeracy skills.
The relationship between job characteristics and skills level is in accordance with previous research on workplace learning (see the section Previous studies) where collaboration, superior feedback, new challenges and not having physically taxing jobs were found to foster workplace learning (Kyndt et al., Citation2009; Skule, Citation2004; Tynjälä, Citation2008; Van Loo et al., Citation2001). Further, we found a positive association between the use of one’s skills and the level of the individual’s numeracy skills. Though we still do not know what causes these associations, and how job characteristics relate to the fundamental causes, it is interesting to see that job characteristics contribute, beyond education level etc., to explaining the variation in skills level.
Belgium and Netherlands initially score high on numeracy skills in PIAAC despite their lower scores on cultural capital-related variables and job characteristics, and – for the Netherlands – despite respondents’ own education level being lower than in the other six countries. When these variables are controlled for, the skills level of the Dutch sample in particular is relatively increased. This finding can give rise to different interpretations. One could question whether more favourable job characteristics (and for the Netherlands a higher proportion of workers with higher education) might increase the skills level in these countries (Belgium and the Netherlands) to an even higher level than what is observed. Since our data do not allow for stating causal relationships, we cannot draw any conclusions on this matter.
Norway and Denmark’s high initial scores on numeracy skills are due to many factors. They score high on cultural capital-related variables (books at home and parental education level) and own education level. Further, the Norwegian sample has a quite fortunate distribution on variables measuring job characteristics. Once these factors are controlled for, the Netherlands score significantly higher than Norway. Likewise, after control for job characteristics, the scores for Norway is somewhat (though significantly) lower than for Denmark.
The initial low scores on numeracy skills in France and UK deserve mention. These do not seem to be caused by a high proportion of immigrants, which is also high in most of the other countries. But France and UK have a less fortunate distribution of cultural capital-related variables (parental education level and books at home) which partially explains their initially low scores. This particularly applies to France. All in all, cultural capital-related variables and job characteristics tend to explain much of the initial difference between the UK and France on the one hand, and Finland, Denmark and Norway on the other.
We may also conclude that the overall (initially) high score on numeracy skills in Finland can be attributed to high educational level among the Finnish respondents and a favourable distribution of the job characteristics variables. This is also due to some extent to the low proportion of immigrants. Further, Finland scores high despite low scores on cultural capital-related variables. But when controlling for own education level and working conditions, Finland’s score on numeracy skills is no longer at the top of the ranking.
The finding that cultural capital-related variables and particularly the respondent’s educational level are of significance for the variation in skills, is not surprising. What is of greater interest, is that characteristics of the work situation appear to be of such great significance for the skills variation, both within and between countries. Although a reciprocal relationship between skills and job tasks probably exists, the significance of job characteristics for between-country variation indicates that job characteristics involving good working conditions, are most likely of significance for workplace learning and for the skills level of the nation’s workforce. Obviously, this does not mean that the phenomenon ‘ageing skills’ does not exist, but at the same time as it does exist, a job situation that provides opportunities for workplace learning is of much importance for the cognitive skill level among workers.
Limitations
There are questions that could not be examined properly within the scope of this paper. These refer to differences between the seven countries regarding the effects of the many different independent variables that are employed. Going into detail about this, this would result in the article exceeding an acceptable limit, and be beyond the main purpose of the paper. We suggest that differences between the seven countries regarding the effects of the many different independent variables are topics for future research.
Another limitation refers to the question of causality, also mentioned previously. In the introduction, it was emphasised that the aim of the paper was not to identify the real causes behind the development of a person’s skills since cross-sectional data such as the PIAAC data cannot be used to infer causality. A huge amount of data on the individual’s life history would then be needed. However, we find it meaningful to analyse how skills vary without asserting causal relationships. We are aware that endogeneity problems, for example ‘a loop of causality’ or simultaneous causality,Footnote9 occur when analysing skills, also in the analyses in this paper. A reciprocal relationship between a person’s skills and many of the independent variables that are included in the analyses may exist. Education increases one’s skills, and skilled persons normally have more education. Likewise, challenging work tasks can contribute to maintaining a person’s basic cognitive skills and to promote skills gain, and possibly reduce skills loss over a lifetime. At the same time, a person may have challenging work tasks precisely because he/she is a very talented person. Thus, the direction of the causal relationships cannot be stated with certainty.
Box 1. Definitions of groups for the estimates in .
Acknowledgments
This work was funded by a grant from the Norwegian Research Council – Barriers and drivers regarding adult education, skills acquisition and innovative activity (BRAIN project, number 228258). The discussions among BRAIN project members at the project’s workshops are gratefully acknowledged, particularly the valuable comments to a draft for this paper by BRAIN-partner Professor Rolf van der Velden, Maastricht University, the Research Centre for Education and the Labour Market (ROA).
Disclosure statement
No potential conflict of interest was reported by the authors.
Additional information
Funding
Notes on contributors
Liv Anne Støren
Liv Anne Støren is a sociologist and Research Professor at Nordic Institute of Studies in Innovation, Research and Education (NIFU) in Oslo. She is currently working with issues relating to adult learning in the workplace, as well as employer and graduate surveys. Her research revolves largely about what factors that affect the transition from education to employment and educational careers, including studies of the situation among immigrants.
Kjersti Lundetræ
Kjersti Lundetræ is associate professor and director of the Norwegian Reading Centre, the National centre for Reading Education and Research, University of Stavanger.Her research interests are international literacy surveys, associations between literacy and life outcomes, literacy difficulties and literacy interventions.
Pål Børing
Pål Børing is economist from the University of Oslo and senior researcher at NIFU. Børing has published scientific articles with focus on innovation, competence and training in firms, and articles in econometric journals. Børing is currently working as a WP leader in a research project funded by the Norwegian Research Council, called SILVER, which examines the relationship between lifelong learning and employability among older adults.
Notes
1. For example, detailed information of country of birth as well as first language lacking for Sweden, Ireland and Germany, and detailed information on age is lacking for the German and Austrian samples.
2. Note that when we occasionally use the term ‘effect’ in this paper, this refers to statistical effects expressed in the coefficients, i.e. correlations/associations, and we do not infer causality. The term ‘effect’ is occasionally used for the sake of simplicity. Often, the sentences become very perpetual if one uses a more precise term like ‘the correlation between the independent variable A and the dependent variable B’, instead of the term ‘effect’.
3. For Norway, a combination of information on birth region and first language was used.
4. One objection to including controls for education levels could be that sorting into higher education varies broadly between the countries, for example, if in country ‘A’ only the best and brightest have high education, while more people do so in country ‘B’. As mentioned, one of the reasons for the selection of countries is in many ways they are quite similar. This also applies to education levels. In all the countries except one, the percentage with upper secondary education or higher (in the sample used in the analyses, i.e. employed persons 20 years or older etc.) is above 80. The exception refers to the Netherlands with 77 per cent. In addition, Finland stands out with a particularly high share (above 90 per cent). The percentage with higher education on average is 42, ranging from 35 and 36% in France and the Netherlands to 48% in Finland (see Table A.1). We do not consider the fact that the education level varies to some extent between the countries, can be decisive for the relevance of controlling for education, which is also common practice in similar analyses.
5. Two variables measuring independency (‘how often organising own time’ and ‘how often planning own activities’) are merged with four variables measuring autonomy and flexibility (deciding the sequence of work tasks, how to do the work, speed of work tasks, and flexible working hours).
6. The sequence of including control variables is evidently of significance. If the control for own education level is included before the background variables that are included in Model 1, the effects of education level are, of course, much larger. The purpose here is to see the net effects of education level once the background variables are controlled for.
7. The models are tested for multicollinearity (correlations, VIF and Tolerance) and no such problems exists.
8. From an R-square of 0.428 in Model 2B, , to 0.405 in a corresponding model where the variable ‘use of numeracy skills a work’ is omitted, and from 0.473 in Model 3, , to 0.458 in a corresponding model where the variable ‘use of numeracy skills a work’ is omitted.
9. See, for example, Bascle (Citation2008), referring to one of the instances where endogeneity is present: “Simultaneous causality occurs when the causality runs in both directions: from the regressor(s) to the dependent variable and from the dependent variable to the regressor(s)» (p. 291).
References
- Albæk, K. (2016). A test of the ‘Use it or Lose It’ hypothesis in labour markets around the world. Estudios de Economica Aplicada, 34(2), 323–352.
- Allen, J., & van der Velden, R. (2013). Skills for the 21st century: Implications for dutch education. In L. R. Smith (Ed.), Higher education: Recent trends, emerging issues and future outlook (pp. 1–40). New York, NY: Nova Science Publishers .
- Barrett, G., & Riddell, W. C. (2016, June) Ageing and literacy skills: Evidence from IALS, ALL and PIAAC. IZA DP No. 10017. Bonn:IZA
- Bascle, G. (2008). Controlling for endogeneity with instrumental variables in strategic management research. Strategic Organization, 63(3), 285–327.
- Boudon, R. (1974). Education, opportunity, and social inequality: Changing prospects in western society. New York: John Wiley & Sons Inc.
- Bourdieu, P. (1977). Cultural reproduction and social reproduction. In J. Karabel & A. H. Halsey (Eds.), Power and ideology in education (pp. 487–511). New York: Oxford University Press.
- Breen, R., & Goldthorpe, J. H. (1997). Explaining educational differentials: Towards a formal rational action theory. Rationality and Society, 9(3), 275–305.
- Desjardins, R., & Warnke, A. J. (2012). Ageing skills: A review and analysis of skill gain and skill loss over lifespan and over time (OECD Education Working Paper Series, OECD Working Paper No. 72). Paris: OECD.
- Driessen, G., & Merry, M. S. (2011). The effects of integration and generation of immigrants on language and numeracy achievement. Educational Studies, 37(5), 581–592.
- Gustaffson, J.-E. (2016). Lasting effects of quality of schooling: Evidence from PISA and PIAAC. Intelligence, 57, 66–72.
- Hægeland, T., Kirkebøen, L. J., Raaum, O., & Salvanes, K. G. (2010). Why children of college graduates outperform their schoolmates: A study of cousins and adoptees. IZA DP No. 5369. Retrieved from http://ftp.iza.org/dp5369.pdf.
- Heisig, J. P., & Solga, H. (2015). Secondary education systems and the general skills of less- and intermediate-educated adults. Sociology of Education, 88(3), 202–225.
- Kyndt, E., Dochy, F., & Nijs, H. (2009). Learning conditions for non-formal and informal workplace learning. Journal of Workplace Learning, 21(5), 369–383.
- Levels, M., Dronkers, J., & Jencks, C. (2017). Contextual explanations for numeracy and literacy skill disparities between native and foreign-born adults in western countries. PloS one, 12(3), 1–25.
- Levels, M., & van der Velden, R. (2013). Use-it-or-lose-it? Explaining age-related differences in key information processing skills. Paper presented at the PIAAC invitational research conference: The importance of skills and how to assess them. Washington, DC. Retrieved November 13–15, 2017, from http://www.nvdemografie.nl/sites/default/files/rolf_van_der_velden_-_keynote_use_it_or_lose_it.pdf.
- Lind, P., & Mellander, E. (2016). Relations between immigration and adult skills: Findings based on PIAAC ( Working Paper 2016:21). Uppsala: Institute for Evaluation of Labour Market and Education Policy.
- OECD. (2016a). Technical Report of the Survey of Adult Skills (PIAAC) (2nd edn.). Retrieved September 22, 2018 from https://www.oecd.org/skills/piaac/PIAAC_Technical_Report_2nd_Edition_Full_Report.pdf.
- OECD. (2013). Skills outlook 2013: First results from the survey of adult skills. Paris: Author.
- OECD. (2014, February). PISA 2012 results: What students know and can do. Student performance in mathematics, reading and science. doi:10.1787/9789264208780-en
- OECD. (2016b). PISA 2015 results in focus. Retrieved September 22, 2018, from http://www.oecd-ilibrary.org/education/pisa-2015-results-in-focus_aa9237e6-en
- Salthouse, T. A. (2006). Mental exercise and mental aging evaluating the validity of the “Use It or Lose It” hypothesis. Perspectives on Psychological Science, 1, 68–87.
- Skule, S. (2004). Learning conditions at work: A framework to understand and assess informal learning in the workplace. International Journal of Training and Development, 8(1), 8–20.
- Tynjälä, P. (2008). Perspectives into learning at the workplace. Educational Research Review, 3(2), 130–154.
- Van Loo, J., de Griep, A., & de Steur, M. (2001). Skills obsolescence: Causes and cures. International Journal of Manpower, 22(1/2), 121–137.
Appendix
Table A.1 Mean sample values of independent variables used in the regression. Per country, and total.
Table A.2 PISA Scores for the seven countries.