
ABSTRACT
Participation in job-related training among immigrants is becoming more important in Europe in view of large immigration inflows. This paper considers differences in training participation rates by immigrant background including by whether they are from Western or non-Western origins. Also considered is whether differences by immigrant background depend on whether the training was supported by employers. The analyses are based on individual-level data from the PIAAC database. Four countries are included in the analysis: Denmark, Finland, the Netherlands and Norway, countries that feature a highly educated labour force and social policies designed to support and incentivise skill development over the life span including disadvantaged groups. The analyses reveal that the differences in participation rate according to immigrant backgrounds are relatively small, in all countries except Finland. Still, the immigrants receive less employer-sponsored training than non-immigrants. The results indicate a high demand for training among immigrants.
Introduction
Participation in job-related training among immigrants is becoming more important in Europe in view of large immigration inflows. For example, host countries face challenges in providing immigrants with relevant training to utilise their capacities effectively in the labour market. As pointed out by Webb, Hodge, Holford, Milana, and Waller (Citation2016), considerable attention has been drawn to the effects that the substantial increase in refugee migration to Nordic and German-speaking countries will have on labour and welfare models.
Without good access to job-related training, the integration of immigrants into the labour market is likely to be hindered. Job-related training can be particularly important for this group because, for example, their labour market situation is more vulnerable, or because they are less familiar with working methods and work organisation in the new country of residence than non-immigrant (i.e. native) workers, or due to inadequate language proficiency.
When this paper considers differences in training participation rates by immigrant background, a distinction is made between EU/Western origin (representing work-immigration) and non-Western origin. This is because the reasons for immigration differ between groups of immigrants, i.e. work-immigration versus third-world/refugee immigration, family reunion with refugees etc. Also considered here is whether differences by immigrant background depend on whether the training was supported by employers.
The analyses are based on individual-level data from the PIAAC (Programme for the International Assessment of Adult Competencies) database. PIAAC is an international survey conducted in several countries and carried out by the OECD in 2011–2012 (the first round of PIAAC). We use available information in the PIAAC data to define the non-formal training which refers to training that is intentional and organised, but not part of the formal educational system (European Commission, Citation2006).Footnote1 We examine persons who are employed; therefore the focus is on non-formal training rather than formal training. Further, in this paper non-formal training is restricted to job-related training.
Non-formal training can include many types of training (e.g. on-the-job-training, courses. See below), aimed at highly educated employees as well as those with low education. Training is commonly seen as valuable for the individuals, irrespective of the individual’s education level, as well as for the economy and society as a whole. It is an explicit political objective for the EU to enable access to adult education to many more, especially for the low-educated (Citation2015). The EU puts forth that:
AES data show that adults with high education levels (ISCED 5–6) participate roughly three times as much in employer-sponsored job-related training than those with low education levels (ISCED 0–2). Adult learning policy therefore needs to counteract the situations in which some have access to adult learning but many have not. (European Commission Citation2015, p. 39)
Four countries are included in the analyses: Denmark, Finland, the Netherlands and Norway. All four countries feature a highly educated labour force and social policies designed to support and incentivise skill development over the worker’s life span, including disadvantaged workers. Rubenson and Desjardins (Citation2009) suggested that Nordic welfare states seem to support citizens by fostering conditions that help them overcome structural and individual barriers more so than in other countries. There are reasons to believe that this also applies to the Netherlands given its high rate of participation in adult learning among socially disadvantaged adults as found in PIAAC and similar policies related to support of adult learning (Desjardins, Citation2017).Footnote2 Indeed, all four countries reveal comparatively high average levels of participation in adult learning (Eurostat Citation2018; Desjardins Citation2017) as well as comparatively high average levels of proficiency in literacy and numeracy as measured in PIAAC (OECD, Citation2013a). Based on the many common features of these countries, it is interesting to examine how they possibly differ in the pattern of training participation, and whether the rates of participation among immigrants differ.
Government efforts targeting immigrants are common in the selected countries where immigrant education is a major form of adult education, and immigrants are target groups for many adult education and job opportunity measures (Desjardins, Citation2017). This seems to apply to Denmark, the Netherlands and Norway in particular, but until recently was possibly less pronounced in Finland.Footnote3 The immigrant population in Finland was small compared to the other three countries, but as in the other countries has been increasing in recent years. According to the UN International Migration Report (UN, Citation2015), international migrants accounted for 3% of Finland’s population in 2000 but 6% in 2015. In the other three countries, the corresponding figures were 7 and 10% (Denmark), 10 and 12% (the Netherlands), and 7 and 14% (Norway), respectively.
Previous studies
Previous studies on participation rates in non-formal training, job-related and non- job-related, have documented the uneven participation rates by education level (for example Boeren Citation2009; Boeren, Nicaise, and Baert Citation2010; Desjardins and Rubenson Citation2013; Knipprath and De Rick Citation2015; Leuven and Oosterbeek Citation1999; Schindler, Weiss, and Hubert Citation2011). It is also documented that training rates increase with increased literacy skills (OECD, Citation2013a), and with increased occupational level (Eurostat Citation2018).
Knipprath and De Rick (Citation2015) conducted separate analyses of non-formal lifelong learning among young persons, 29 years of age, in Flanders, Belgium, that were a) related to one’s job and b) not related to one’s job. They found that having higher education was positive for training related to the job but had a negative effect on training not related to the job. Schindler et al. (Citation2011) examined German employees, and according to their study, parts of the class gap in training could be ascribed to the different distribution of classes over industries, and they suggested that the content of the job as well explains much of the class gap in training. The study by Schindler et al. (Citation2011) accentuates the importance of considering work and workplace characteristics when examining job-related training. If relevant data are available, consideration can be given to the conditioning effects of job characteristics like industry and workhours when examining employed persons. Training rates vary by industrial sector (Barrett, McGuinness, O’Brien, and O’Connell, Citation2013; Offerhaus Citation2014; Schindler et al. Citation2011); it is also found that part-time workers are less likely to receive work-related training than full-time workers (Arulampalam and Booth Citation1998). This will be followed up in this paper.
Contrary to the many studies examining the role of education level, participation in work-related training by immigrant backgrounds is a topic that is quite rarely examined, and even more rarely is the immigrant’s origin taken into account. Leuven and Oosterbeek (Citation1999) focused on the demand and supply of work-related training in Canada, the Netherlands, Switzerland and the United States, and reported that training is less common among immigrants than among non-immigrants, except for the Dutch case. Two Canadian studies found lower participation rates among immigrants than among their Canadian counterparts, i.e. Hum and Simpson (Citation2003) using data from 1998, and Park (Citation2011) using data from 2008. In both studies, it was found that financial constraints were mentioned more frequently as barriers to participation in training by immigrants than natives, and that more recent immigrants participated the least. Hum and Simpson (Citation2003, p. 482) also found a significant training deficit for black men, while Park (Citation2011) found that female immigrants from countries other than the US and Northern/Western Europe were less likely than Canadian-born citizens to participate in job-related training.
More recent data from Germany (Offerhaus, Citation2014) indicate that relatively large differences in training rates exist between immigrants and non-immigrants, in favour of non-immigrants. Knipprath and De Rick (Citation2015) found no effect however, of being an immigrant in a study of young persons in Flanders. In an Irish study by Barrett et al. (Citation2013), it was found that immigrants are less likely to receive employer-provided training relative to comparable natives. Moreover, it was particularly immigrants from the new EU member states (i.e. employees of East-European origin) who experienced a disadvantage, but those from non-EU/non-English-speaking countries also experienced a somewhat lower incidence of employer-provided training than natives. The study suggested that the disadvantages experienced by immigrants arise partly from the fact that many have not found employment in training-oriented firms.
Research questions
Based on previous studies, we expect that immigrants tend to have fewer training opportunities than non-immigrants, and that the disadvantage tends to be greater for non-Western immigrants. This assumption is also based on an expectation of lower education level among the non-Western immigrants. Therefore, it is of interest to examine whether the differences in training rates exist both before and after controlling for the individuals’ education level. Further, the distribution of immigrants by industrial sector and workhours may be different from the corresponding distribution of non-immigrants, and therefore it is important also to control for such characteristics.
However, we also expect that immigrants, to a higher degree than non-immigrants, possess a lower average level of proficiency in basic skills related to the host language such as literacy and numeracy as measured in PIAAC. This can imply that many immigrants are likely to require compensatory training for improved performance in the labour market. Training offers for such compensatory training will probably mainly occur outside the workplace. It can, however, also occur in the workplace, and where the employer-supported training is possibly subsidised by the public authorities. This implies that well-developed public policy efforts to support and integrate immigrants, including language and other training, may affect the pattern of participation in training by immigration background. However, access to training-oriented firms by immigrants may well be beyond the limits of such policies. Here, we consider job-related training among employed persons, and therefore the possible overrepresentation of immigrants in labour market and welfare measures is not the issue here.
From the above studies and perspective, we seek to address the following research questions:
To what extent do immigrants in the four countries participate in work-related training compared to non-immigrants?
Are there differences between EU/Western immigrants and non-Western immigrants?
To what extent do differences according to immigrant backgrounds exist after controlling for relevant background variables such as education and skills levels?
To what extent can differences be explained by immigrants versus non-immigrants access to training-oriented firms and employer-supported training?
Data and methods
Employed persons are selected from the PIAAC database (see the reasons for this above.).
The data are weighted according to the weights in the PIAAC database.Footnote4 The data quality is to be considered as very high, see OECD (Citation2013a, Citation2013b).
The dependent variable
A binary variable with two outcomes (non-formal work-related training during the last 12 months = 1, else 0) is the dependent variable. The PIAAC questionnaire has a complex routing for defining this group. The work-related training refers to their last non-formal training activity (if they had participated in more than one non-formal training activity during the last 12 months). On-the-job training is defined as work-related training. If on-the-job-training was the respondents’ last (or only) training activity, they are included in the group. Else, the group consists of persons who have participated in other forms of non-formal training (workshops, distance training or private lessons) and answered that their last training activity was mainly job-related. Participants in on-the-job training account for about three quarters of the group.
There are 17,127 employed persons from the four countries in the database. Of these, 4 per cent (or 637 persons) who did not respond to the questions referring to participation in non-formal work-related training during the last 12 months, are excluded from the analyses. This reduces the sample to 16,490 persons. Of this group, 2% (382 persons) who did not answer questions used as independent variables, are also excluded from the regressions. Thus, the final sample consists of 16,108 persons from the four countries in total who are used in the empirical analyses. There are very small differences in the mean sample values of the independent variables between the final sample of 16,108 persons (, column 1), and the samples of 17,127 persons and 16,490 persons, respectively.
The regressions are run separately for the four countries () because the effects of the independent variable are expected to differ between the countries.
Table 1. Participation in non-formal job-related training by immigrant background. Per cent of employed persons.
Table 2. Binary logistic regression of the probability to participate in non-formal job-related training. Four countries*.
Independent variables
Mean sample values of the independent variables are shown in . The main independent variables refer to immigrant backgrounds where we differentiate between immigrants of EU/Western origin and non-Western origin. The educational level of these two groups also differs widely (see ). The EU/Western immigrants have the highest educational level. Persons born outside the reference countries (Denmark, Finland, the Netherlands or Norway) with an EU/Western origin constitute one category which refers to an EU/EEA country plus North-America and Australia/New Zealand. Most persons (about 95%) in this category have a European background, where about 75% are from Western Europe and 20% come from the new EU member states in Eastern Europe, mainly Poland. Having non-Western origin refers to persons born in the rest of the world, i.e. Asia (the majority), Africa, Latin America and East-European countries outside the EU. Of the latter group, people from the Russian Federation constitute the majority.
For the Danish sample, information on country of birth existed for all immigrants, but in the other three country samples, this information was largely lacking. We have reduced the number of cases with ‘unknown country of birth’ by using information on the immigrant’s first language (‘What is the language that you first learned at home in childhood?’). For immigrants with unknown country of birth, their first language was coded as EU/Western and non-Western in the same way as country of birth; they were then categorised as EU/Western and non-Western immigrants instead of ‘unknown country of birth’. Consequently, a rest-category exists for ‘unknown country of birth’ only for the Finnish sample (see ). Because this group constitutes a fairly large part of immigrants in the Finish sample, we have not excluded this group from the analyses. Therefore, this group constitutes an own category (dummy-variable) in the regression for Finland. ‘Non-immigrants’ is used as the reference category in the regressions.
We also control for whether the immigrants have the language of the immigrant country (the host country) as their first language. This applied to only a very small part of the non-Western immigrants (7%) in the four countries who participated in the surveyFootnote5 (see ). This indicates that the immigrants included in the sample do not represent a very selected group of immigrants in the way that it was primarily those with a good knowledge of the language of the ‘host’ country’ who participated in the survey.
Education and skills levels are used as control variables. A distinction is made between three educational levels: lower secondary school or less, upper secondary (including post-secondary, non-tertiary education), and higher education. Upper secondary level is used as the reference category. For cognitive skills level, we have used the scores on numeracy skills which in the PIAAC database consists of a set of 10 plausible values estimated for each participant. The correlation between numeracy skills and literacy skills is very high (0.9 in the sample analysed here). We have chosen to use numeracy skills, and have used the statistical programme Stata, where the ‘repest’ command ensures correct estimates for standard errors for the average numeracy scores. Additional analysis (available upon request) was conducted on all independent variables used in the regressions to check for multicollinearity, but no such risk was found (This includes possible multicollinearity problems due to a correlation between educational level and skills level.)
In addition, controls are included for gender, age, industrial sector and weekly work hours.
Descriptives
displays the uncontrolled training rates by immigrant background.
The total participation rates vary very little (from 59 to 62%) between the countries. To our knowledge, figures according to immigrant background as those displayed in have not been previously shown. It may be surprising that the differences by immigrant background are not larger because of the relationship between educational level and training participation. As mentioned in the introduction, several studies have shown that participation in adult learning increases with increased educational level.
The non-Western immigrants in the sample have a considerably higher proportion with low education (lower secondary school or less) than the non-immigrants (see ). The non-Western immigrants have, overall, lower education and skills levels than the non-immigrants, and both groups of immigrants have lower skills level than the non-immigrants (see ). Bearing this in mind, the differences according to immigrant background displayed in are relatively small, with one exception, that of Finland. Finland stands out with the largest differences by immigrant backgrounds.
It should be mentioned that the employment rates among those who participated in the PIAAC survey varied between the countries and by immigrant backgrounds, see . Norway and the Netherlands had the overall highest employment rate. Among the non-Western immigrants, the employment rate is clearly higher in Norway than in the Netherlands and Denmark, and among the EU/Western immigrants, the employment rate was highest in Norway. The combination of the relatively high participation rate among the immigrants in Norway (), and (relatively) high employment rate among immigrants, implies that immigrants in Norway participate in work-related training more frequently than in the other countries.
Results of binary logistic regressions
The descriptive results in are further examined in the binary logistic regressions shown in .
In Finland, there are large negative effects of being a non-Western immigrant or being an immigrant of unknown origin, but no significant effect of being an EU/Western immigrant. In Denmark, there are negative effects of being a non-Western immigrant and being an EU/Western immigrant. The negative effect of being a non-Western immigrant is smaller in Denmark than in Finland.
In Norway, the results are the opposite to Finland. There is no significant effect of being a non-Western immigrant, but a negative effect of being an EU/Western immigrant. However, in the Netherlands, neither of these two variables relating to immigrant background are significant. The effects of having the language of the immigrant country as first language are overall not significant.
The estimation results by immigrant background are illustrated in . The estimations are based on the results of . The persons are assigned average values on all the other independent variables included in the regression than immigrant background. ‘Average values’ refers to the average values for all the four countries when aggregated (see column 1 in .), which means that the distribution of the independent variables is set as being similar in the four countries. Further, in the estimates for each country, the coefficients for each of the countries (see ) are used.
Figure 1. Estimated probability to participate in non-formal job-related training, by immigrant background.
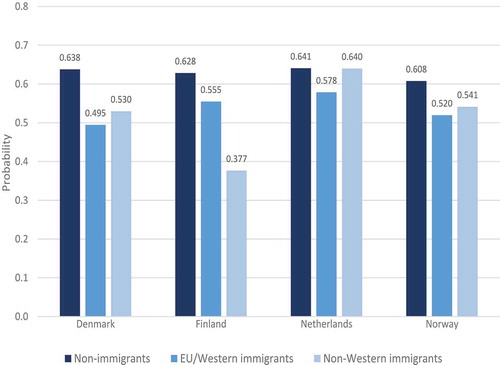
The initial assumption that immigrants would have less access to job-related training than non-immigrants, and that the disadvantage would be greatest for non-Western immigrants, is not generally confirmed when controlling for other variables () with the exception of Finland.
We recall that the apparent difference between non-immigrants and EU/Western immigrants in the Netherlands is non-significant; none of the immigrant-related variables in the Netherlands are significant. We also recall that the apparent difference between non-Western immigrants and non-immigrants in Norway is non-significant. Otherwise, the graph illustrates that in Denmark and Norway it is the EU/Western group of immigrants who have the lowest participation rate (‘all other things being equal’), and that the non-Western immigrants in Finland have a very low participation rate.
The controlled estimates for the EU/Western immigrants do not differ much from the uncontrolled results in . The reason is that the distribution of EU/Western immigrants on many of the control variables does not differ very much from the corresponding distribution among the non-immigrants. In some areas, the distribution of the EU/Western immigrants is ‘better’ (in terms of positive for training participation) than among non-immigrants. For example, overall they have a high education level, which neutralises their lower skills level. We find one exception. In Norway, the probability of participating in training among the EU/Western immigrants is reduced when controlling for education level and other background characteristics. To a large extent this is due to a high education level among the EU/Western immigrants, and that there is no effect of skills in Norway.
However, for the non-Western immigrants the controls for all the variables included in the regressions in contribute to reducing the difference in the participation rates relative to the non-immigrants. But this only occurs in the Netherlands and Denmark; just slightly in Norway and not at all in Finland. The backdrop for these findings is that the controls for the education and skills levels as well as industrial sector have different impacts on the effect of being a non-Western immigrant in the four countries. In Finland, education and skills levels among the non-Western immigrants are higher than in the other three countries. This implies that the control for these variables does not increase the participation rate in the Finish case. Additional analyses show that in Norway, it is not the control for industrial sector which changes the negative effect of ‘non-Western immigrant’ from being significant to non-significant; it is the inclusion of controls for workhours and education and skills levels as well as age, that has an impact. Overall, when the four countries are seen together, additional analyses show that it is not the control for industrial sector but rather the control for education and skills levels that reduces the effect of non-Western immigrant background.
Country differences
As depicted in , the effects of the immigrant-related variables differ between the countries, but this applies to a rather limited extent regarding the effects of education and skills levels. In additional tests, we checked the extent to which the country differences regarding the coefficients of the independent variables are significant. These tests are done both using the results of the logistic model and conducting additional analyses using a linear model.Footnote6 The effects of immigrant backgrounds tend to differ significantly between countries. The effect of having non-Western immigrant background differs significantly between Finland on the one hand and the Netherlands, Norway as well as Denmark on the other. It also differs significantly between Denmark and the Netherlands. However, the effect of being a non-Western immigrant in Norway, does not differ significantly from the corresponding effects in the Netherlands and Denmark.
The tests show that overall the effects of education and skills levels do not differ significantly between the countries.Footnote7 However, significant country differences apply to control variables such as industrial sector, gender and age. Although the overall participation rate is at the same level in the four countries, and although the effects of education level appear as universal, patterns of participation differ between the four countries.
Factors that may have influenced the results of the regressions
As mentioned in the introduction, two additional factors are particularly interesting in the discussion of regression results. These factors are relevant only for those who had participated in training and are therefore not included in the regression model (all the independent variables must be relevant to all cases included in the regressions). These two factors relate to the extent to which the training was employer-sponsored, and the main reason for participating (obligatory or of own interest).
As mentioned above, controls for industrial sector have little impact on the effects of being an immigrant. However, industrial sector is a rather rough measure and may not capture differences concerning the firm’s training orientation. Therefore, other variables in the PIAAC database are relevant. Employer encouragement may be reflected in the extent to which training was paid for by the employer. In PIAAC, the question about employer-sponsored training referred to all kinds of training, not only work-related training. Below (), we have excluded those who answered the question about employer-sponsoring, but who did not participate in work-related training, to make the participation rates comparable to other rates described in the paper.
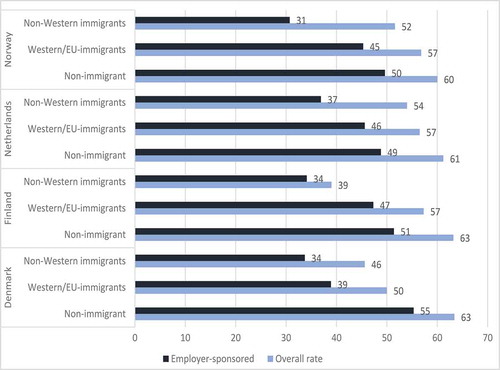
Figure 2. Participation in job-related training paid for by the employer and total participation rate, by immigrant background. Per cent.
In , we have aggregated the response ‘totally paid for by the employer’ and ‘partly paid for by the employer’. In all groups, most answered ‘totally’; only between one and two per cent answered partly paid for by the employer. The response refers to the possible payment for ‘tuition, registration, exam fees, expenses for books or other costs’.
Most of the work-related training is employer-supported (). Many employers provide training opportunities because it is considered profitable for the firm/organisation, and many of the employees probably participate precisely because it is paid for by the employer.
In Denmark, the Netherlands and Norway employer-sponsored training accounts for more of the training among non-immigrants than among non-Western immigrants. For example, in Norway the proportions among non-Western immigrants are 52% (total rate) compared to 31% (employer-sponsored), whereas the corresponding figures among non-immigrants are 60 and 50%. The same tendency is found in Denmark and the Netherlands, but in Finland the picture is different. Employer-sponsored training seems to be particularly important for immigrants in Finland, i.e. the country with the lowest total participation rate among non-Western immigrants.
If we exclude those who did not participate in training and exclude Finland, we find that 83 per cent of non-immigrants who participated in work-related training participated in employer-sponsored training. This applied to 79% of the EU/Western immigrants and 67% of the non-Western immigrants.
The findings show that many immigrants participate in training although it is not employer-sponsored. The reasons can be that the demand for training among the non-Western immigrants is particularly high, or it may be that the job-related training for parts of the immigrant group is paid for by the authorities or other agencies, and is perceived as free. However, this probably has little effect. Only 7% of the non-Western immigrants participated in job-related training for which they stated that ‘there were no such costs’ (referring to the possible payment for tuition, etc. mentioned above), and a similar level (6 per cent) of the non-immigrants as well as the EU/Western immigrants stated the same. Whether the fact that many immigrants participate in training although it is not employer-sponsored is (partly) caused by a higher demand, can be illustrated by the response to questions about the main reason for participating ().
Table 3. Obligatory training or training of own interest, by immigrant background. Per cent*.
In a distinction is made between ‘obligatory training’ and ‘training of own interest’, which sums up to the total training rate shown in . The distinction is based on answers to the question about the main reason for participation in work-related training. Although most persons have many reasons for participation, it is of interest to see the extent to which the main reason differs by immigrant background. Persons who responded: ‘I was obliged to participate’ are categorised as participants in ‘obligatory training’. Persons who pointed to reasons like ‘To do my job better and/or improve career prospects’ or ‘To increase my knowledge or skills on a subject that interests me’ are categorised as participants in ‘work-related training of own interest’. These two categories include 87% of the ‘own interest’ category (Other more seldom reasons were ‘To obtain a certificate’; ‘To increase my possibilities of getting a job, or changing a job or profession’; ‘To be less likely to lose my job’, and ‘To start my own business’.).
The PIAAC data give no further information on the specific motivation for training, neither do the data give information about the reasons for not wanting to participate in training (no demand for training). Moreover, the data give no specific information about the courses to which the work-related training refers. It seems reasonable, however, to believe that the obligatory training involves, for example, emergency training, administrative policy training and training in new IT systems.
shows that fewer immigrants than non-immigrants participated in obligatory training. Except for Finland, the participation rate in obligatory training is significantly higher among the non-immigrants than among the immigrants (non-Western immigrants and EU/Western immigrants). We can conclude that in Norway, Netherlands and Denmark, the differences by immigrant background in the total training rates, would have been smaller if the immigrants received more obligatory training. For Finland, the situation is different. Here, non-Western immigrants participate to a very low degree in work-related training ‘of own interest’, and, relative to the other countries, more frequently in ‘obligatory training’. We do not know the reason for this. We recall that for a large part of the participating non-Western immigrants in Finland, the participation was employer-sponsored.Footnote8 We also recall that non-Western immigrants in Finland are rather few in number, so the results may be coincidental.
Discussion and conclusions
In total, employed immigrants participate in work-related training to a lesser extent than non-immigrants though the difference is pronounced in only one of the four countries (Finland). Some difference in training rates is probably rooted in the fact that fewer immigrants have participated in employer-sponsored training. Both in Denmark, the Netherlands and Norway, fewer immigrants have had the training paid for by the employer; further, a higher share of the training participation among immigrants was ‘of own interest’ in these three countries. It seems reasonable to assume that the demand for training is fairly high among the immigrants in these countries.
The analyses show that the overall picture is rather mixed, and more mixed than shown in previous studies. On some topics, our study confirms the results of previous studies. The German study of Offerhaus (Citation2014) found large differences in training rates between immigrants and non-immigrants. This is not confirmed here with the exception of Finland. It has not been common to distinguish between immigrants of different origins, but the Irish study of Barett et al. (Citation2013) did so. This study showed that immigrants from new EU member states (in particular) receive employer-provided training less frequently than natives. In our study, we find that EU/Western immigrants in Norway and Denmark have lower participation rates than non-immigrants. Barett et al. (Citation2013) also found lower incidence of training for a group of immigrants which can be considered as comparable to the non-Western immigrants in our study. This finding is here confirmed for Finland and Denmark.
We presented four questions about the relationship between participation in work-related training and immigrant backgrounds. The questions concerned whether immigrants in the four countries participated in work-related training to the same extent as non-immigrants, whether we would find differences between EU/Western immigrants and non-Western immigrants, and whether initial differences according to immigrant backgrounds would exist after controlling for relevant background variables such as education and skills levels. We also asked to what extent the differences can be explained by immigrants versus non-immigrants access to employer-supported training and training-oriented firms.
The results vary between the countries. The uncontrolled distribution shows the lowest participation rates among immigrants in Finland, followed by Denmark, then Norway, and the Netherlands. We consider that the uncontrolled differences in the three last-mentioned countries were small, given the fact that non-Western immigrants overall have lower education and skills levels than non-immigrants, and that both groups of immigrants have a lower skills level than the non-immigrants. Controls for education and skills levels and other relevant variables changed the picture to some extent, and it varies whether the lower participation rate refers to EU/Western or non-Western immigrants.
In Norway, there is no significant difference in the training rates between non-Western immigrants and non-immigrants, but significantly fewer immigrants with EU/Western backgrounds participate in work-related training. In Finland, the opposite picture emerges: there is a large negative effect of being a non-Western immigrant or being an immigrant of unknown origin, but no significant effect of being an EU/Western immigrant. Further variety is shown by the fact that in Denmark, there are negative effects of being a non-Western immigrant and being an EU/Western immigrant, whereas in the Netherlands, neither of these two variables for immigrant background are significant. The positive results for the Netherlands are in accordance with the findings of Leuven and Oosterbeek (Citation1999).
The results for the EU/Western immigrants are indistinct, considering how the differences according to immigrant background can be explained. This group has an overall high education level which is reflected in the small differences between the controlled and uncontrolled results for EU/Western immigrants. However, in Norway and Denmark, this group participates less in work-related training than non-immigrants. One reason for this can be that they have fewer training possibilities; the percentage who had participated in work-related employer-sponsored training was lower than for the non-immigrants. This can reflect that the employers are less interested in investing in training for this group because they are expected to return to their home country. Still, we do not have a good suggestion for why the picture concerning the EU/Western immigrants is different in Finland and the Netherlands, where we find no significant effect of being an EU/Western immigrant. The result may be accidental and due to low number base, particularly in Finland, and it may be connected to varying characteristics of this group of immigrants in the four countries, which our control variables have not captured.
Regarding the non-Western immigrants, we found that controls for education and skills level, age, workhours etc. to some extent increased their likelihood of training participation (relative to non-immigrants), in three of the countries (Denmark, the Netherlands and Norway). The results indicate that the initial lower participation rates among the non-Western immigrants are the result of a less ‘fortunate’ distribution of the control variables, and this refers particularly to education and skills levels. Still, the training rates among the non-Western immigrants in these three countries would probably be (even) higher if they received more training opportunities. One argument for this is that a lower share of their training was paid for by the employer, and further by the fact that (except for Finland) more of those who participated in training, participated of own interest.
The results for Finland differ from the other countries. This country has a small immigrant population. Nevertheless, immigrants seem to be less integrated in work-related training in Finland than in the other three countries. This refers particularly to a very low training rate in ‘own interest-training’ among non-Western immigrants in Finland, and the backdrop can be that few opportunities are perceptible and accessible to them. Finland had less experience with immigration and had probably not developed the same level of measures where immigrants are target groups for courses and education programmes as in the other three countries.
It is reasonable to see the quite positive results for Norway, Netherland and Denmark in light of the fact that immigrants are the target groups for many adult education programmes and job opportunity measures in these countries. The results regarding participation rates for non-Western immigrants are also quite similar in these countries. Such measures can also affect the situation among those who actually are employed. They can increase the visibility of training opportunities and the motivation to participate in learning activities, among them job-related courses. Further, possibly a part of the job-related training is subsidised by public authorities.
Concerning policy implications, we should also bear in mind that the results refer to employed persons, and that the employment rate in all four countries is lower among non-Western immigrants than among non-immigrants.Footnote9 Denmark and the Netherlands have been less successful than Norway in employing immigrants. The employment situation among the immigrants was better in Norway than in the other countries. This not only refers to the fact that at the time of the survey the employment situation overall was better in Norway, but that the difference in employment rates according to immigrant background is less in Norway (). This implies that the situation in Norway and the Netherlands is particularly positive with regard to involving non-Western immigrants in work-related training. In the Netherlands this is the case because they have the highest training rate among non-Western immigrants. For Norway, the results are positive because also here the training rate among non-Western immigrants is quite high, and because the training involves more immigrants since more of them are actually employed.
We find it relevant to suggest that the positive results for Norway in part can be a consequence of programmes that particularly target low-skilled workers. One such example is the Basic Competence in Working Life Programme (BCWL) which, to our knowledge, is a specific Norwegian measure. Any firm in Norway can apply for support from BCWL for training measures linked to job-related activities for reading, writing, arithmetic and the use of ICT (Kompetanse Norge Citation2014; Unesco Citation2016). Nevertheless, attention should be paid to the low participation rate of immigrants in the part of the training that is employer-sponsored, in Norway and in other countries.
A question for future research would be whether the situation for the immigrants in the countries we have examined has changed following the large increase in refugee immigration in recent years.
Acknowledgments
This work was funded by a grant from the Norwegian Research Council – Barriers and drivers regarding adult education, skills acquisition and innovative activity (BRAIN project, number 228258). The discussions among BRAIN project members at the project’s workshops are gratefully acknowledged, particularly the valuable comments to this paper by BRAIN-partner Professor Richard Desjardins, Department of Education, University of California.
Disclosure statement
No potential conflict of interest was reported by the authors.
Additional information
Funding
Notes on contributors
Liv Anne Støren
Liv Anne Støren is a sociologist and Research Professor at Nordic Institute of Studies in Innovation, Research and Education (NIFU) in Oslo. She is currently working with issues relating to adult learning in the workplace, as well as employer and graduate surveys. Her research revolves largely about what factors that affect the transition from education to employment and educational careers, including studies of the situation among immigrants.
Pål Børing
Pål Børing is economist from the University of Oslo and senior researcher at NIFU. Børing has published scientific articles with focus on innovation, competence and training in firms, and articles in econometric journals. Børing is currently working as a WP leader in a research project funded by the Norwegian Research Council, called SILVER, which examines the relationship between lifelong learning and employability among older adults.
Notes
1. The definition is widely used and in accordance with terms used by Adult Education Surveys (Eurostat, Citation2018) and by the predecessors to PIAAC, namely ALL and IALS (OECD, Citation2018).
2. In addition to the reasons referring to policy incentives for lifelong learning etc., other reasons for selecting the four countries are that relevant information on key variables such as first language of immigrants exists for the particular country in the database, and that we find that the number of countries that are compared needs to be restricted in this kind of analysis.
3. One example of new measures in Finland is that a National Core Curriculum for Integration Training for Adult immigrants was adopted in 2012 referring to the Act on the Promotion of Integration, adopted in 2010 (Finnish National Board of Education, Citation2012).
4. The weighting procedure is based on the full sample (final) weight which is in the PIAAC database. We have also used 80 replicate weights in the PIAAC database since participating countries have used different replication schemes. The weighting procedure ensures representative data. Data are weighted by using the ‘repest’ command in Stata. We have, in addition, used a country correction term in tables where the four countries are looped to ensure that all countries have the same influence on the average values for the pooled four countries (, column 1, 6, 7 and 8). The average values in , column 1, form the basis for the calculations in and . The country correction term is equal to the ratio of the number of persons in the actual sample in each country and the weighted number of observations in each country.
5. For immigrants living in Norway and Denmark who reported that one of the Scandinavian languages (Danish, Swedish and Norwegian) was their first language, these cases are coded here as having the language of the immigrant country as their first language because of the broad similarities between these Scandinavian languages.
6. We are aware that some scholars warn against comparing logit values between samples (Mood, Citation2010). Mood suggests that this can be done if using linear regression models. We have run extra regressions using linear models for each of the four countries. The results concerning possible significant differences between the countries regarding the coefficients of the independent variables when using the linear model coincide with the results when using the logistic model. We should also point out that Mood’s (Citation2010) warning is discussed by other scholars, among them Buis (Citation2017), who concludes differently.
7. When it comes to the effects of education and skills levels, the overall picture is that there are no significant country differences, with only two exceptions. These are that the effect of having a low education level differs between Finland and the Netherlands, and that the effects of numeracy skills level differ between Norway and Denmark. However, there are many significant country differences considering the effects of the dummy variables for industrial sector, and even more so when using a linear model than when using the logit model. There are also significant country differences in the effects of gender and age, both when the linear model is used and when the logit model is used.
8. Because of the low number base for immigrants in the individual country, there is little meaning to further examine the relationship between obligatory and employer-sponsored training by immigrant group.
9. For Finland, the difference in the employment rate refers to immigrants with unknown country of origin, which here comprises a larger group than non-Western immigrants, see .
References
- Arulampalam, W., & Booth, A. L. (1998). Training and labour market flexibility: Is there a trade-off? British Journal of Industrial Relations, 36(4), 521–536.
- Barrett, A., McGuinness, S., O’Brien., M., & O’Connell, P. J. (2013). Immigrants and employer-provided training. Journal of Labor Research, 34(1), 52–78.
- Boeren, E. (2009). Adult education participation: The Matthew principle. Filosofija–Sociologija, 20(2), 154–161. Retrieved September 10, 2018, from http://www.research.ed.ac.uk/portal/en/publications/adult-education-participation-the-matthew-principle(746c6151-d726-4bd6-acdf-6dbb0c42f1d7).html.
- Boeren, E., Nicaise, I., & Baert, H. (2010). Theoretical models of participation in adult education: The need for an integrated model. International Journal of Lifelong Education, 29(1), 45–61.
- Buis, M. L. (2017). Logistic regression: When can we do what we think we can do? University of Konstanz, Department of History and Sociology Retrieved September 14, 2018, from http://www.maartenbuis.nl/wp/odds_ratio_3.1.pdf
- Desjardins, R. (2017). Political economy of adult learning systems. Comparative study of strategies, policies and constraints. London: Bloomsbury Academic. eBook.
- Desjardins, R., & Rubenson, K. (2013). Participation patterns in adult education: The role of institutions and public policy frameworks in resolving coordination problems. European Journal of Education, 48(2), 262–280.
- European Commission. (2015). Education and training 2020. Improving policy and provision for adult learning in Europe. Report of the Education and Training 2020 Working Group on Adult Learning 2014 – 2015. Luxembourg: Publications Office of the European Union. Retrieved September 10, 2118, from http://ec.europa.eu/dgs/education_culture/repository/education/library/reports/policy-provision-adult-learning_en.pdf
- European Commission. (2006). Classification of learning activities – Manual. Eurostat Unit F4. Luxembourg: Office for Official Publications of the European Communities.
- Eurostat. (2018). Adult learning statistics. Retrieved September 10, 2018, from https://ec.europa.eu/eurostat/statistics-explained/index.php/Adult_learning_statistics
- Finnish National Board of Education. (2012). National core curriculum for integration training for adult immigrants. Publications 2012:6. Retrieved December 3, 2018, from: https://www.oph.fi/download/140755_national_core_curriculum_for_integration_training_for_adult_immigrants_2012.pdf
- Hum, D., & Simpson, W. (2003). Job-related training activity by immigrants to Canada. Canadian Public Policy, 29(4), 469–490.
- Knipprath, H., & De Rick, K. (2015). How social and human capital predict participation in lifelong learning: A longitudinal data analysis. Adult Education Quarterly, 65(1), 50–66.
- Kompetanse Norge (Skills Norway). (2014). All time high for work life training. Retrieved September 12, 2018, from https://www.kompetansenorge.no/English/news/all-time-high-for-work-life-training/.
- Leuven, E., & Oosterbeek, H. (1999). The demand and supply of work-related training: Evidence from four countries. Research in Labor Economics, 18, 303–330.
- Mood, C. (2010). Logistic regression: Why we cannot do what we think we can do, and what we can do about it. European Sociological Review, 26(1), 67–82.
- OECD. (2013a). Skills outlook 2013: First results from the survey of adult skills. Paris: Author.
- OECD. (2013b). The survey of adult skills – Reader’s Companion. Paris: Author.
- OECD. (2018). Adult literacy. Retrieved September 10, 2018, from: http://www.oecd.org/education/innovation-education/adultliteracy.htm.
- Offerhaus, J. K. (2014). Further training in Germany. Continuous participation and the impact of attitudes and personality ( Doctoral thesis). Bremen International Graduate School of Social Sciences, University of Bremen.
- Park, J. (2011, August 30). Job-related training of immigrants. Components of statistics Canada catalogue no. 75-001-X. Perspectives on Labour and Income, Statistics Canada.
- Rubenson, K., & Desjardins, R. (2009). The impact of welfare state regimes on barriers to participation in adult education: A bounded agency model. Adult Education Quarterly, 59(3), 187–207.
- Schindler, S., Weiss, F., & Hubert, T. (2011). Explaining the class gap in training: The role of employment relations and job characteristics. International Journal of Lifelong Education, 30(2), 213–232.
- UN. (2015). International Migration Report 2015. Highlights. Retrieved September 12, 2018, from http://www.un.org/en/development/desa/population/migration/publications/migrationreport/docs/MigrationReport2015_Highlights.pdf.
- Unesco. (2016). The basic competence in working life programme (BCWL). Retrieved September 18, 2018, from http://litbase.uil.unesco.org/?menu=4&programme=126
- Webb, S., Hodge, S., Holford, J., Milana, M., & Waller, R. (2016). Refugee migration, lifelong education and forms of integration. International Journal of Lifelong Education, 35(2), 213–215.
Appendix
Table A.1. Mean sample values of independent variables by country and immigrant background. Employed persons*
Table A.2. Per cent employed by immigrant background and country. Percentage base (number of observations, total, and unweighted) in parenthesis.