
Abstract
Marking schemes are a tool to ensure fairness in assessment of student work. Key features of fairness are that different markers would award the same mark to the same work and that the resulting marks effectively discriminate between different levels of student attainment. This study focuses on the ability of assessment to discriminate by analysing the mark distributions resulting from the use of different types of marking scheme in a real-world setting in a research-intensive UK university. This analysis shows that, in qualitative assessment, the mark distribution is unaffected by features of the marking scheme used. Instead, it shows that the type of assignment used has a significant effect on the mark distribution and that these effects are sometimes counterintuitive. Marking schemes are unlikely to be an effective tool in shaping mark distributions. To determine the effectiveness of approaches to assessment, we need to interrogate data rather than make assumptions.
Keywords:
Introduction
Purposes of assessment and grading
Assessment plays a variety of roles in education. The primary role in modern higher education is to allow both students and teachers to determine the extent to which students have attained a series of pre-stated learning outcomes. Students typically receive both feedback on their performance against these outcomes, with advice on how to improve performance in future, and a mark or grade (numerical or denoted by a letter). A range of evidence suggests that future student performance benefits more when feedback is provided in the absence of a grade (Schinske and Tanner Citation2014). Grades, however, exist to serve a range of functions. The origins of grading appear to be to aide communication between teachers about the progress of individual students (Schinske and Tanner Citation2014), but it has also long been recognised that grades provide motivation for students to increase their efforts in the hope of gaining higher marks. It should be noted, however, that others have argued that offering rewards such as grades can actually harm rather than improve performance across a range of tasks (Kohn Citation1993); this suggests that grades and, ultimately, degree classification should not be used at all. However, many higher education systems, including the United Kingdom, have classification of degrees according to level of achievement as a core principle (Quality Assurance Agency [QAA] 2018). In this context, the ability of assessments to discriminate between different levels of attainment is desirable to allow the full range of grades to be awarded.
The effectiveness of grading as a motivational factor is also challenged by self-determination theory (Reeve 2012; Deci and Ryan Citation2016). This theory centres on the concept that all students are intrinsically motivated to learn, and teaching should be planned to facilitate this motivation. Extrinsic influences that are controlling can thwart this motivation (Deci and Ryan Citation2016), whilst those that inform can improve it (Reeve 2012). Rewards in the form of grades are one such controlling influence. Interestingly, fairness, the extent to which students believe that assessments reflect their actual skills and efforts, significantly correlates with intrinsic motivation (Cho, Levesque-Bristol and Yough Citation2021). This suggests that student perceptions that their assessment is unfair may also represent extrinsic factors that thwart motivation. Indeed, perceptions of fairness may be dependent on the grades awarded (Wendorf and Alexander Citation2005). This also argues in favour of assessment that allows a full range of marks to be awarded so that students believe that their work is fairly rewarded.
Grades also provide a means for higher education institutions to certify learning for professional bodies or potential future employers (McKeachie Citation1976; Bloxham and Boyd Citation2007). For the purpose of certification, especially for future employers, grades are required to discriminate between students with different levels of attainment. Indeed, the UK QAA states that assessment should allow students to “have the opportunity to achieve standards beyond the threshold level” (QAA Citation2018, 2). Overall, this argues that, whilst the effects of grading on learning may be debated, where grading exists it should be able to effectively differentiate quality of work in the interests of fairness and certification of learning. Whilst it is not possible to compare any assessment to an idealised, fair range of marks, any assessment that results in a very narrow range of marks is unlikely to be effectively discriminating quality. As such, the distribution of marks provides valuable information about this factor.
Grade inflation
If motivation of high ability students is an incentive to discriminate attainment at the top of the marking scale, then a major incentive to discriminate at the lower end of the marking scale is the phenomenon of grade inflation. In the UK, the proportion of students being awarded a first-class honours degree (the highest level of award in the UK) has increased from 7% in 1996 (Higher Education Statistics Agency [HESA] 1996) to 28% in 2019 (HESA Citation2020). An even higher percentage in 2020, the most recent year for which data is available, is likely affected by allowances made for the effects of the COVID-19 pandemic so is not referred to here. The percentage of students receiving the top two classes of degree increased from 48% in 1996 to 76% in 2019 (HESA Citation1996, Citation2020). This matters because grade inflation is a key factor in a decrease in the public perception of the quality of higher education in the UK (Hudson and Mansfield Citation2020).
Although some suggest that improving school education prior to starting university is responsible for this increase, the UK government’s analysis suggests that most of the increase in the proportion of students receiving good degrees is “unexplained” by changes in student characteristics (Office for Students Citation2020, 3). That has prompted pressure from government to halt the inflation of grades, including threats to deregister institutions who fail to address the problem (Weale Citation2019). Of course, improvements in student attainment would result in an improvement in the grades awarded, so grade inflation may not be a sign of a relaxation of standards. Indeed, a recent attempt to statistically model the cause of the increasing proportion of first-class degrees awarded concluded that improvements within the higher education system are likely to be a major influence (Jephcote, Medland and Lygo-Baker Citation2021). Nevertheless, confidence in the ability of our assessments to discriminate performance is required to ensure that grades accurately reflect student attainment.
Styles of marking schemes and criticisms
Unlike some other educational systems, such as high school education in the USA (Schinske and Tanner Citation2014), higher education in the UK does not have a tradition of norm-referenced “grading to the curve.” Instead, it relies on an outcomes-based approach in which academic judgment is guided by marking schemes to produce fair and appropriate marks for student work. This is justified by students deserving to both be graded on the quality of their work, with no reference to achievement of other students, and to know what they will be assessed on (Sadler Citation2005). This requires that the marking schemes, or rubrics, used are able to consistently and reliably deliver grading on quality alone. Research has often focused on how markers use these schemes (Ecclestone Citation2001; Peeters, Schmude and Steinmiller Citation2014), how they affect student learning and how they contribute to the consistency of marks between markers (Reddy and Andrade Citation2010).
The use of generic, evaluative terms such as “good” or “excellent” in marking schemes has been criticized as being poor for student learning (Brookhart Citation2018) and highly subjective (Grainger et al. Citation2017), with more specific, descriptive terms being preferred. A distinction has also been drawn between holistic marking schemes, in which a single mark is given for the piece of work as a whole, and analytic marking schemes in which the final mark is calculated from marks given for individual criteria in the marking scheme. Analytic marking schemes have been praised for the more reliable marking they produce with greater agreement between markers (Bird and Yucel Citation2013; Peeters, Schmude and Steinmiller Citation2014). Brookhart argues, however, that such findings may be the result of publication bias as studies showing a perceived improvement in marking are more likely to be written up for publication and that overall the type of marking scheme has no effect on reliability (Brookhart Citation2018). Analytic schemes have also been criticized for inducing “criteria compliance” in students over meaningful learning (Torrance Citation2007, 282). Analytic schemes have received further criticism for the perceived loss of validity, the extent to which the mark reflects what was intended to be assessed (Jonsson and Svingby Citation2007), and for resulting in average marks for work that may be judged as brilliant overall (Sadler Citation2009).
This last point suggests that the type of marking scheme may also affect the overall distribution of marks and the ability to provide the desired discrimination of quality. Studies on the effects of marking schemes on the overall distribution of marks are limited, with contradictions in those that do study this. Some have found that analytic marking schemes increase the range of marks (Kuisma Citation1999), whilst others believe that any increased reliability in the marks provided by analytic schemes results only from narrowing the range of marks (Mabry Citation1999). A more wide-ranging study investigating the effect of multiple features of marking schemes on the distribution of marks is needed to understand if optimizing marking schemes can be used to address concerns about assessment standards.
A common theme in many of these studies into the effect of marking schemes is that they have been carried out in relatively controlled conditions with a group of markers who are highly engaged with the use of the marking schemes. This is unlikely to be typical of the way most marking schemes are used, with marking being one of many competing demands on staff time. Here I investigate the effect of the style of marking scheme outside of a research context by analysing the features of marking schemes used across 4-year undergraduate programmes in a biomedical sciences department in a UK university, and correlate each feature with the mark distributions. I find that the there is little impact of these features but, instead, that the type of assessment used has a much greater effect on marks.
Methods
Educational context
The study was carried out in a biomedical sciences department of a large, research-intensive UK university. The department offers four-year undergraduate degrees in several programmes. The degree programmes are modular with students from multiple programmes in the department sharing courses, and with many courses attracting students from other parts of the university. Approximately 1500 students took undergraduate courses in the department in the year of the study. All assignments examined were allocated a mark as a percentage according to the university’s common marking scheme (). Where possible, all marking is carried out anonymously with students identified only by a number. This is not possible for some assessments including presentations or, in some cases, where students write about a specific research project carried out only by them.
Table 1. The university’s common marking scheme.
Terminology
Programme: the four-year programme of study required for an undergraduate degree.
Course: an individual subject-specific element of the programme. Referred to as a module in some universities. Courses were worth 10 (n = 18), 20 (n = 99) or 40 (n = 38) academic credits out of 480 credits required for graduation with an honours degree.
Assignment: a piece of work set by a course. Here, assignment is used to refer to both in-course assessments, such as essays and presentations, and to examinations.
Submission: An individual piece of work submitted by a student. This includes examinations taken by students.
Data collection
Data were collected from all assignments in undergraduate courses hosted by the department in years 1-3. In year 4, elective courses were excluded due to typically small cohorts making the distribution of marks difficult to assess. Year 4 courses open only to intercalating medical students were also excluded to avoid the effect of a different cohort of students. In total this covered 152 separate assignments with 13,745 submissions. Not all categories could be determined from available information for all assignments. For example, in some cases, the marks and information about the nature of the assignment were available but details of the marking scheme were not. All data collected was from the academic year 2018–19.
Marking scheme classification
Marking schemes were taken from course handbooks or the course pages of the virtual learning environment. Definitions of marking scheme features drew on Dawson (Citation2017). Marking schemes were categorised according to the following features:
Single best answer or subjective mark
Some assignments, including multiple choice examinations and assignments involving calculations, had only a single correct answer so that no judgment is required in marking. These were classed as single best answer (SBA) assignments. Other assignments featured subjective marking using marking schemes. The categories below reflect categories within those marking schemes.
Task-specific or generic
If the scheme referred to elements of the specific assignment (e.g. how well the student discussed a specific feature of the topic) it was classed as task-specific. Schemes were classed as generic if, for example, the same marking scheme could be used for any essay.
Analytic or holistic
Analytic schemes give marks for individual criteria whereas holistic schemes give a single mark for the whole assignment. Some marking schemes allocated a single holistic mark but markers were asked to give an indicative rating for a range of criteria in the absence of a mark calculation (e.g. tick a box for a B grade for “presentation”). These marking schemes were classed as semi-analytic. Similar types of scheme have previously been termed “rating scales” (Brookhart Citation2018, 1).
Grade descriptors
Schemes were classed as either having or lacking grade descriptors: a statement of the requirements expected for a specific grade range (see ). Marking schemes lacking grade descriptors typically had only a statement of what was expected for the piece of work, or, in the case of semi-analytic marking schemes, of what is expected for each criterion, without a description of specific levels of attainment.
Subdivision of A grade descriptors
The common marking scheme possesses three subdivisions of A grade (A 1-3) based on the percentage mark. Marking schemes were categorised depending on whether there were individual descriptors for the A grade subdivisions.
Subdivision of B grade descriptors
A small number of schemes gave descriptors for subdivisions of the B grade, typically 60%–64% and 65%–69%, presumably because B grades are much the most frequently awarded.
Descriptive or evaluative statements
Descriptors were categorised based on whether they were truly descriptive of what is expected within a mark range or simply substituted the adjective from the common marking scheme into the same statements (e.g. A—Introduction is excellent, B—Introduction is very good…). This second category was termed evaluative. Note that some marking schemes contained either descriptive or evaluative statements against which work would be assessed but without containing grade descriptors.
Some of these categories are independent of each other and applied to all subjectively-marked assignments. For example, a marking scheme could be both task-specific and analytic or both task-specific and holistic. The A and B subdivision categories were only applied to assignments with grade descriptors, and the descriptive and evaluative categories were only applied to assignments featuring quality statements. This includes assignments in which quality statements existed but were not part of explicit grade descriptors.
Analysis of marks
Marks for assignments were collated from official course records after the completion of the course and ratification of the marks by the board of examiners. As such, they were not normally raw marks, but had been subject to moderation. A wide range of approaches to moderation are used in the department including blind double marking, double marking by a second marker who has access to the marks and feedback of the first maker and sampling moderation in which a subset of assignments marked by each first marker is reviewed by a second marker. In some cases, where blind, double marking is used, the raw marks were available (24/152 total assignments) and both individual marks were counted rather than counting a single, agreed mark. Marks of 0 were excluded as these typically correspond to non-submission. It is likely, however, that a small number of genuine marks of 0 were omitted. Scaling or adjustment of marks after marking and moderation is almost never used in the department studied but scaling of a subset of marks cannot be definitively ruled out from the data used.
All parameters were calculated at an individual assignment level then averaged across assignments. Statistical tests were carried out using these assignment averages. The number of assignments was referred to as N; n refers to number of submissions. All data are show as: median (1st quartile, 3rd quartile). Non-parametric statistical tests were used for non-normally distributed data sets and parametric tests were used when data was normally distributed. Normality was determined by Shapiro–Wilk test. All statistical tests were carried out in SigmaPlot 12.5. Power analysis, performed in R, was carried out by random resampling from the original data set 1000× and testing for an introduced difference with the statistical test used for analysis.
Ethics statement
As the original study was carried out for standard quality assurance and enhancement purposes, ethical approval was not sought in advance. The local ethics committee and data protection services were contacted in advance of reporting the study and no ethical or regulatory concerns were identified.
Data availability
Access to the underlying data may allow identification of individual student marks so this has not been made publicly available.
Results
Discrimination amongst typical submissions
One key role of a marking scheme is to not only allow the identification of the highest and lowest standard of work but to discriminate between the standards of work in the typical range. To assess this, I examined the relationship between styles of marking scheme and the interquartile range (IQR) of marks in each assignment using the style of scheme. Perhaps unsurprisingly, marks from assignments marked using a single best answer had a larger range than those marked using a form of marking scheme (single best answer IQR 20.3 (17.0, 24.9), N = 28, marking scheme IQR = 9.2 (7, 12.0), N = 107, p < 0.001, Mann-Whitney test, ). Analytic marking schemes have been said to both increase and decrease the range of marks. In our context there is no difference in the range of marks using analytic (IQR = 10 (7.8, 13.3), N = 23), holistic (IQR = 9.8 (7.2, 12), N = 57) or semi-analytic (IQR = 7.5 (6.9, 10.0), N = 27) marking schemes (p = 0.13, ANOVA on ranks, ). Grade descriptors are often used to try to make the level of attainment expected for each grade clearer and may, therefore, be expected to increase the range of marks. However, in this context, the presence of grade descriptors did not affect the range of marks (no descriptor IQR 9 (6.5, 12.0), N = 61, descriptor present IQR = 9.4 (6.5, 12.0), N = 46, p = 0.3, Mann-Whitney test, ).
Figure 1. Relationship between the interquartile range of marks and features of the marking schemes. (A–F) Points show interquartile range for individual assignments. Grey boxes show median interquartile range.
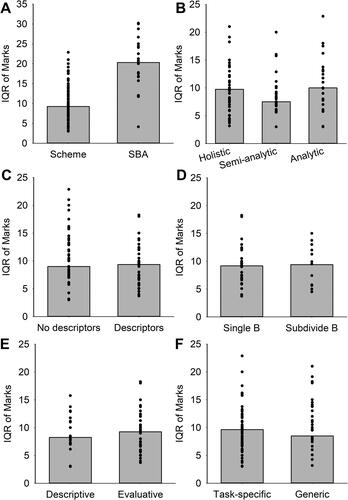
The commonest grade resulting from marking schemes was B, (marks of 60%–69%, 38% of all submissions excluding single best answer assignments) likely representing the majority of marks within the IQR. To discriminate within this grade range, some marking schemes contained multiple descriptors for subdivisions of B grades, typically for 60%–64% and 65%–69%. This subdivision also failed to increase the range of marks (single B descriptor IQR 9.1 (6.7, 10.4), N = 34, subdivided B descriptors IQR = 9.7 (5.7, 12.3), N = 12, p = 0.4, t test, ). Some descriptors simply contained the same text with different evaluative terms (e.g. good, very good, excellent) whilst others were genuinely descriptive of the expectations of each grade. There was no difference in the range of marks resulting from descriptive (IQR = 8.3 (7.1, 11.5)) versus evaluative (9.3 (6.3, 11.6)) descriptors (p = 0.7 Mann-Whitney test, ). In addition to how descriptive the descriptors were, there was also a difference in the level of task-specificity of the descriptors with some containing statements relevant only to the specific assignments whilst others were descriptive of a generic type of assignment. Again, this had no effect on the range of marks (generic descriptors IQR 8.5 (6.8, 11), N = 67, task-specific descriptors IQR = 9.6 (7.9, 11.6), N = 27, p = 0.3, Mann-Whitney test, ).
Overall, the style of marking scheme had no effect on the range of marks. I would expect this analysis to pick up meaningful effects as even the smallest sample size, concerning subdivision of the B descriptor, had a power of 0.91 to detect a difference in IQR of 4. In comparison, the difference in IQR between SBA assignments and those with a subjective marking scheme was 11.1. Although IQR is restricted to detecting variability in the middle portion of the range, the same lack of effect was seen when using standard deviation to represent the range of marks (data not shown).
Discrimination amongst high-achieving submissions
A specific issue identified by students and external examiners in the university is that very few high A grades (marks ≥ 80%) are awarded. As for IQR, assignments marked by single best answer had a higher proportion of high A grades (single best answer marks ≥ 80% = 15.3 (8.8, 24.1)% submissions, N = 28, marking scheme marks ≥ 80% = 5.3 (0.8, 9.4)%, N = 107, p < 0.001, Mann-Whitney test, ). Again, as for IQR, none of holistic versus analytic or semi-analytic marking schemes, presence or absence of grade descriptors, task-specific versus generic descriptors or descriptive versus evaluative descriptors affected the proportion of high A grades ().
Figure 2. Relationship between features of the marking scheme and the proportion of high marks. (A–F) Points show proportion of marks greater than or equal to 80% for individual assignments. Grey boxes show median proportion of marks greater than or equal to 80%.
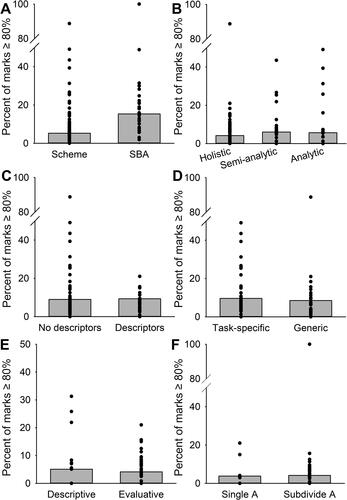
Table 2. Effect of marking scheme features on percent of grades ≥ 80%.
As for B grades, some marking schemes contained descriptors for sub-divisions of A grades, typically A1 (90%–100%), A2 (80%–89%) and A3 (70%–79%). Often this is intended to make the expectations for high A grades clearer and so to increase the likelihood that markers will give higher A grades. The subdivision of A grade descriptors had no effect on the proportion of marks ≥ 80%, although the sample of assignments not subdividing the A descriptor was small (single A descriptor marks ≥ 80% = 3.8 (2.2, 16.5) % marks, N = 6, subdivided A descriptors marks ≥ 80% = 4.8 (0, 8.0) % marks, N = 40, p = 0.69 Mann-Whitney test, ). Across all features of subjective marking schemes examined, none had an effect on either the range of marks (IQR) or the proportion of high A grades awarded. As for IQR, I would expect to be able to detect meaningful differences in the percent of marks ≥ 80% for all but subdivisions of A descriptors. The power of the next smallest sample size, concerning descriptive versus evaluative terms, had a power of 0.8 to detect a difference of 4%; the difference between SBA assignments and those with a subjective marking scheme was 10%. The fixed nature of the mark distribution is despite the absence of any formal norm-referencing or grading to a curve, but perhaps this happens informally or even sub-consciously.
Effect of type of assessment on mark distribution
One major factor that is ignored in the analysis is the type of assignment with which the marking schemes are associated. These marking schemes are used for a wide range of in-course and examination assignments. Staff often refer to specific assignments as being “good discriminators” of learning attainment but rarely back-up these statements with data. I examined the relationship between type of assignment and mark distribution treating single best answer assignments separately from those assessed using a subjective marking scheme. Where a subjective marking scheme was used, the type of assessment had a significant effect on both the IQR (p < 0.001, analysis of variance (ANOVA) on ranks, , ) and the percent of marks ≥ 80% (p = 0.007, ANOVA on ranks, , ).
Figure 3. Relationship between type of assignment and mark distribution. (A) Points show interquartile range for individual assignments. Grey boxes show median interquartile range. (B) Points show proportion of marks greater than or equal to 80% for individual assignments. Grey boxes show median proportion of marks greater than or equal to 80%.
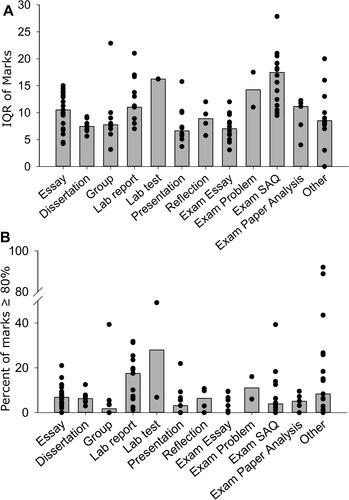
Table 3. Effect of the type of assignment on IQR ordered from lowest to highest IQR. Examination SAQ refers to short answer questions.
Table 4. Effect of the type of assignment on percent marks ≥ 80% ordered from lowest to highest proportion.
There were no significant differences in mark distribution amongst different types of assignment assessed by a single best answer, but the sample size was small for most types so the data is not shown here.
Discussion
This study aimed to identify any differences in mark distributions resulting from the use of different styles of marking scheme. I found that, in a real-world setting, the form of marking scheme had no influence on either the breadth of marks in the centre of the distribution, IQR, or in discriminating between the best submissions: marks ≥ 80%. In contrast, I found that the type of assignment set had a significant effect on the mark distribution in both categories. This also demonstrates that the sample size was sufficient to identify at least some effects on mark distribution. It is, of course, possible that the style of marking scheme has an effect on mark distribution that this study was unable to identify, but the effect of type of assignment is dominant.
The impact of marking schemes on marks awarded
There are two obvious possible explanations for the lack of effect of marking schemes: that all our marking schemes are equally calibrated or that marking schemes have little impact on the range of marks given, even if they are consciously designed to do so. The latter explanation instinctively seems more likely. Introducing a detailed, analytic rubric for essay marking has been shown to result in a greatly increased range of marks (Kuisma Citation1999), whereas I found such schemes had no influence on the range of marks. The lack of impact of analytic marking schemes in this context may be a result of the halo effect (Thorndike Citation1920), in which markers first instinctively assess the overall quality and subsequently this overall assessment influences the assessment of individual criteria. Furthermore, markers admit reverse-engineering feedback to meet criteria in marking schemes after deciding on a mark (Grainger, Purnell, and Zipf Citation2008).
The similarity in mark distributions across all types of marking scheme may suggest the existence of a community of markers with a shared understanding of expected standards (Morgan Citation1996). This set of standards likely forms more of a reference point than the marking scheme. Interestingly, experienced markers often use instinct to determine the mark whilst novices are more likely to refer to the marking scheme, suggesting that markers develop an internal view of standards with time (Ecclestone Citation2001). Inexperienced markers often defer their opinion of what mark is deserved to senior colleagues (Orr Citation2007), suggesting that the shared understanding is propagated through time from senior to junior colleagues. It is likely that moderation processes are the mechanism of this propagation, as this is the time in which colleagues most often discuss the appropriate mark for specific pieces of work. More concerningly, moderation also likely exaggerates the tendency for narrow ranges of marks due to “defensive marking,” in which markers tend to give marks close to the average to avoid being challenged (Hornby Citation2003, 450).
That the type of marking scheme does not alter the range of marks awarded is consistent with defensive marking being a driver of narrow mark ranges. In this scenario, if a new marking scheme resulted in markers producing a range of marks different from that they were used to awarding, they may react by self-moderating their marks. Markers may simply be unwilling to give very high or low marks no matter if the marking scheme suggests that they should. In this case, the shared understanding of markers may be of the range of marks expected rather than the standards expected to achieve those marks. Unfortunately, the data used in this study do not allow direct comparison of similarity in marks versus similarity in mark ranges of individual markers. If defensive marking leads to a narrow range of marks that does not represent the range of work, it may disadvantage students producing excellent work as they would not be given the credit they deserve. Similarly, students who do good work may be disadvantaged if their mark is indistinguishable from those whose work is of a lower standard due to a reluctance to give low marks.
That the type of assignment does have an effect on mark distribution suggests that the overlapping sets of markers involved are not always equally constrained in the range of marks they are willing to award. In other words, the different forms of assignments have different abilities to overcome any effect of defensive marking. In the context of this study, marking schemes appear to be an ineffective tool to influence mark distributions. If we want marking schemes to impact the range of marks it may be helpful to train staff to use the marking schemes; something that does not typically happen in the courses included in the analysis. Such training increases the effectiveness of marking schemes especially amongst inexperienced markers (Bird and Yucel Citation2013), so this may empower inexperienced markers to overcome the propagation of cultural tendency to give a narrow range of marks. In addition, it will give them the language to defend their marks in moderation so may reduce defensive marking practices.
Effect of the type of assignment on marks awarded
The motivation for this study was to determine if different types of marking scheme lead to a greater degree of discrimination of levels of student attainment. Instead, the only difference found was that assignments with a single best answer provide a wider range of marks. Even excluding assignments with a single best answer, the type of assessment had a significant effect across the range of marks. In some cases these differences are not surprising; for example, group assessments have a narrow range of marks and short answer question examinations show a high level of discrimination. Whilst discrimination may be inherently difficult in group work, the ability to work in teams is one of the main skills valued by graduates (Vilapakkam Nagarajan and Edwards Citation2014), so this type of assessment can be justified on the basis of authenticity. A more surprising finding is that long-form essay-style examination questions do not appear to be highly discriminating. This is striking as many staff justify this form of assessment as being “a good discriminator.” It is particularly surprising that essay-style answers written under examination conditions were awarded a narrower range of marks than those written as in-course assessments. Since this analysis was performed, the COVID-19 pandemic has prompted the switching of many assessments away from examination conditions and this study suggests that a return to this type of assessment may not be beneficial.
Although the ability of specific question types in multiple choice question examinations to discriminate has received much attention (Rudolph et al. Citation2019), previous research into the effect of types of assessment has been very limited. Broadly, different disciplines typically show different ranges of marks, with disciplines typically viewed as “soft” giving narrower ranges of marks than those viewed as hard subjects (Bridges et al. Citation1999). Even within a single university department, individual courses with a qualitative focus can show a narrower range of marks than quantitative courses (Hornby Citation2003). These studies did not carry out assignment-level analysis, but it is possible that they represent equivalent findings with hard subjects and quantitative courses more likely to employ assessment with a single best answer.
Conclusion
These findings suggest that optimising the format of marking schemes alone is unlikely to influence mark distributions in real-world settings. It is likely that marking culture and instinctive marking overcomes the influence of marking schemes. Interestingly the same influences do not homogenise marks across different types of assignment despite the same pool of markers in this study marking multiple classes of assignment. Finally, this work suggests that focused studies in small groups, such as those seeing significant impacts of adjustments of marking schemes, may not translate at a larger, institutional or departmental, scale where many markers are less engaged with the aims. As such, it is important to examine the effects of interventions at these scales. For example, here I have proposed training in the use of marking schemes as a way to overcome defensive marking. Rather than small-scale trials, this should be rolled at a departmental level and the impact of this on mark distributions should be analysed in a similar manner to this study.
Acknowledgements
Thank you to Omolabake Fakunle for preliminary analysis and to Neil Lent and Melanie Stefan for critical comments on the manuscript.
Disclosure statement
No potential conflict of interest was reported by the author.
Notes on contributors
Michael Daw is a senior lecturer in the Deanery of Biomedical Sciences at the University of Edinburgh. His research interest in marking schemes is an extension of his role as Director of Quality Assurance and Enhancement in the Deanery.
References
- Bird, F. L., and R. Yucel. 2013. “Improving Marking Reliability of Scientific Writing with the Developing Understanding of Assessment for Learning Programme.” Assessment & Evaluation in Higher Education 38 (5): 536–553. doi:10.1080/02602938.2012.658155.
- Bloxham, S., and P. Boyd. 2007. Developing Effective Assessment in Higher Education: A Practical Guide: A Practical Guide. London, UK: McGraw-Hill Education.
- Bridges, P., B. Bourdillon, D. Collymore, A. Cooper, W. Fox, C. Haines, D. Turner, H. Woolf, and M. Yorke. 1999. “Discipline‐Related Marking Behaviour Using Percentages: A Potential Cause of Inequity in Assessment.” Assessment & Evaluation in Higher Education 24 (3): 285–300. doi:10.1080/0260293990240303.
- Brookhart, S. M. 2018. “Appropriate Criteria: Key to Effective Rubrics.” Frontiers in Education 3:22. doi:10.3389/feduc.2018.00022.
- Cho, H. J., C. Levesque-Bristol, and M. Yough. 2021. “International Students’ Self-Determined Motivation, Beliefs about Classroom Assessment, Learning Strategies, and Academic Adjustment in Higher Education.” Higher Education 81 (6): 1215–1235. doi:10.1007/s10734-020-00608-0.
- Dawson, P. 2017. “Assessment Rubrics: Towards Clearer and More Replicable Design, Research and Practice.” Assessment & Evaluation in Higher Education 42 (3): 347–360. doi:10.1080/02602938.2015.1111294.
- Deci, E. L., and R. M. Ryan. 2016. “Optimizing Students’ Motivation in the Era of Testing and Pressure: A Self-Determination Theory Perspective.” In Building Autonomous Learners: Perspectives from Research and Practice Using Self-Determination Theory, edited by W. C. Liu, J. C. K. Wang and R. M. Ryan, 9–29. Singapore: Springer Singapore.
- Ecclestone, K. 2001. “‘I Know a 2:1 When I See It’: Understanding Criteria for Degree Classifications in Franchised University Programmes.” Journal of Further and Higher Education 25 (3): 301–313. doi:10.1080/03098770126527.
- Grainger, P., M. Christie, G. Thomas, S. Dole, D. Heck, M. Marshman, and M. Carey. 2017. “Improving the Quality of Assessment by Using a Community of Practice to Explore the Optimal Construction of Assessment Rubrics.” Reflective Practice 18 (3): 410–422. doi:10.1080/14623943.2017.1295931.
- Grainger, P., K. Purnell, and R. Zipf. 2008. “Judging Quality through Substantive Conversations between Markers.” Assessment & Evaluation in Higher Education 33 (2): 133–142. doi:10.1080/02602930601125681.
- HESA. 1996. “Higher Education Statistics for the UK 1995/96.” https://www.hesa.ac.uk/data-and-analysis/publications/higher-education-1995-96. Accessed July 8, 2021.
- HESA. 2020. “What Are HE Students’ Progression Rates and Qualifications?” https://www.hesa.ac.uk/data-and-analysis/students/outcomes#classifications. Accessed February 23, 2021.
- Hornby, W. I. N. 2003. “Assessing Using Grade-Related Criteria: A Single Currency for Universities?” Assessment & Evaluation in Higher Education 28 (4): 435–454. doi:10.1080/0260293032000066254.
- Hudson, L., and I. Mansfield. 2020. Universities at the Crossroads: How Higher Education Leadership Must Act to Regain the Trust of Their Staff, Their Communities and the Whole Nation. London, UK: Policy Exchange.
- Jephcote, C., E. Medland, and S. Lygo-Baker. 2021. “Grade Inflation versus Grade Improvement: Are Our Students Getting More Intelligent?” Assessment & Evaluation in Higher Education 46 (4): 547–571. doi:10.1080/02602938.2020.1795617.
- Jonsson, A., and G. Svingby. 2007. “The Use of Scoring Rubrics: Reliability, Validity and Educational Consequences.” Educational Research Review 2 (2): 130–144. doi:10.1016/j.edurev.2007.05.002.
- Kohn, A. 1993. Punished by Rewards: The Trouble with Gold Stars, Incentive Plans, A’s, Praise, and Other Bribes. New York, NY: HarperCollins Publishers.
- Kuisma, R. 1999. “Criteria Referenced Marking of Written Assignments.” Assessment & Evaluation in Higher Education 24 (1): 27–39. doi:10.1080/0260293990240103.
- Mabry, L. 1999. “Writing to the Rubric: Lingering Effects of Traditional Standardized Testing on Direct Writing Assessment.” Phi Delta Kappan 80 (9): 673.
- McKeachie, W. J. 1976. “College Grades: A Rationale and Mild Defense.” AAUP Bulletin 62 (3): 320–322. doi:10.2307/40224973.
- Morgan, C. 1996. “The Teacher as Examiner: The Case of Mathematics Coursework.” Assessment in Education: Principles, Policy & Practice 3 (3): 353–375. doi:10.1080/0969594960030305.
- Office for Students. 2020. “Analysis of Degree Classifications over Time: Changes in Graduate Attainment from 2010-11 to 2018-19.”
- Orr, S. 2007. “Assessment Moderation: Constructing the Marks and Constructing the Students.” Assessment & Evaluation in Higher Education 32 (6): 645–656. doi:10.1080/02602930601117068.
- Peeters, M. J., K. A. Schmude, and C. L. Steinmiller. 2014. “Inter-Rater Reliability and False Confidence in Precision: Using Standard Error of Measurement within PharmD Admissions Essay Rubric Development.” Currents in Pharmacy Teaching and Learning 6 (2): 298–303. doi:10.1016/j.cptl.2013.11.014.
- QAA. 2018. UK Quality Code, Advice and Guidance: Assessment. Gloucester, UK: QAA.
- Reddy, J. 2012. “A Self-determination Theory Perspective on Student Engagement.” In Handbook of Research on Student Engagement, edited by S. L. Christenson, A. L. Reschly, C. Wylie, 149–172. Boston, MA: Springer US.
- Reddy, Y. M., and H. Andrade. 2010. “A Review of Rubric Use in Higher Education.” Assessment & Evaluation in Higher Education 35 (4): 435–448. doi:10.1080/02602930902862859.
- Rudolph, M. J., K. K. Daugherty, M. E. Ray, V. P. Shuford, L. Lebovitz, and M. V. DiVall. 2019. “Best Practices Related to Examination Item Construction and Post-Hoc Review.” American Journal of Pharmaceutical Education 83 (7): 7204. doi:10.5688/ajpe7204.
- Sadler, D. R. 2005. “Interpretations of Criteria‐Based Assessment and Grading in Higher Education.” Assessment & Evaluation in Higher Education 30 (2): 175–194. doi:10.1080/0260293042000264262.
- Sadler, D. R. 2009. “Indeterminacy in the Use of Preset Criteria for Assessment and Grading.” Assessment & Evaluation in Higher Education 34 (2): 159–179. doi:10.1080/02602930801956059.
- Schinske, J., and K. Tanner. 2014. “Teaching More by Grading Less (or Differently).” CBE Life Sciences Education 13 (2): 159–166. doi:10.1187/cbe.CBE-14-03-0054.
- Thorndike, E. L. 1920. “A Constant Error in Psychological Ratings.” Journal of Applied Psychology 4 (1): 25–29. doi:10.1037/h0071663.
- Torrance, H. 2007. “Assessment as Learning? How the Use of Explicit Learning Objectives, Assessment Criteria and Feedback in Post‐Secondary Education and Training Can Come to Dominate Learning.” Assessment in Education: Principles, Policy & Practice 14 (3): 281–294. doi:10.1080/09695940701591867.
- Vilapakkam Nagarajan, S., and J. Edwards. 2014. “Is the Graduate Attributes Approach Sufficient to Develop Work Ready Graduates?” Journal of Teaching and Learning for Graduate Employability 5 (1): 12–28. doi:10.21153/jtlge2014vol5no1art565.
- Weale, S. 2019. “Government Calls on OfS to Clamp down on University Grade Inflation.” In The Guardian. London, UK: Guardian News & Media Limited.
- Wendorf, C. A., and S. Alexander. 2005. “The Influence of Individual- and Class-Level Fairness-Related Perceptions on Student Satisfaction.” Contemporary Educational Psychology 30 (2): 190–206. doi:10.1016/j.cedpsych.2004.07.003.