Abstract
Electromagnetic induction measurements (EM) were taken in a saline gypsiferous soil of the Saharan-climate Fatnassa oasis (Tunisia) to predict the electrical conductivity of saturated soil extract (ECe) and shallow groundwater properties (depth, Dgw, and electrical conductivity, ECgw) using various models. The soil profile was sampled at 0.2 m depth intervals to 1.2 m for physical and chemical analysis. The best input to predict the log-transformed soil salinity (lnECe) in surface (0–0.2 m) soil was the EMh/EMv ratio. For the 0–0.6 m soil depth interval, the performance of multiple linear regression (MLR) models to predict lnECe was weaker using data collected over various seasons and years (R a 2 = 0.66 and MSE = 0.083 dS m-1) as compared to those collected during the same period (R a 2 = 0.97, MSE = 0.007 dS m-1). For similar seasonal conditions, for the Dgw–EMv relationship, R 2 was 0.88 and the MSE was 0.02 m for Dgw prediction. For a validation subset, the R 2 was 0.85 and the MSE was 0.03 m. Soil salinity was predicted more accurately when groundwater properties were used instead of soil moisture with EM variables as input in the MLR.
Editor D. Koutsoyiannis; Associate editor K. Heal
Citation Bouksila, F., Persson, M., Bahri, A., and Berndtsson, R., 2012. Electromagnetic induction predictions of soil salinity and groundwater properties in a Tunisian Saharan oasis. Hydrological Sciences Journal, 57 (7), 1473–1486.
Résumé
Des mesures par induction électromagnétique (EM) ont été réalisées sur des sols gypso-salins de l'oasis à climat saharien de Fatnassa (Tunisie) pour estimer la conductivité électrique de l'extrait de la pâte saturée du sol (CEe) et les propriétés de la nappe superficielle (profondeur, Dgw, et conductivité électrique, CEgw) à l'aide de différents modèles. Des échantillons de sol ont été prélevés tous les 0,2 m jusqu'à une profondeur de 1,2 m pour des analyses physico-chimiques. La meilleure variable indépendante pour estimer la transformée logarithmique de la salinité des sols (ln CEe) à la surface du sol (0-0,2 m) était le rapport EMh/EMv. Pour l'horizon du sol 0-0,6 m, la performance de la régression linéaire multiple (RLM) pour estimer ln CEe était plus faible en utilisant des mesures collectées pour différentes saisons et années (R a 2 = 0,66; EQM = 0,083 dS m-1) plutôt que celles collectées durant la même campagne de mesure (R a 2 = 0,97; EQM = 0,007 dS m-1). En utilisant des mesures réalisées durant des saisons similaires, le R 2 de la relation Dgw–EMv était égal à 0,88 et l'erreur quadratique moyenne (EQM) était de 0,2 m pour l'estimation de Dgw. Pour la phase de validation, le R 2 était de 0,85 et l'EQM sur la prédiction de Dgw était de 0,03 m. Une meilleure précision était obtenue par la RLM lorsque les propriétés de la nappe superficielle ont été utilisées au lieu de la teneur en eau du sol avec les variables EM comme variables indépendantes pour estimer la salinité du sol.
1 INTRODUCTION
Gypsiferous soils cover 9.3% of Tunisia and are mainly located in the south where rainfall is less than 250 mm year-1. In southern Tunisia, the soils of most oases are gypsiferous. The physical, chemical and thermal properties of gypsiferous soil are different from those of other mineral soils (FAO Citation1990, Bouksila et al. Citation2008), as gypsum is a soluble salt (hydrous calcium sulphate, CaSO42H2O) containing 20.9% water. In arid and semi-arid regions, irrigation is often associated with increased risks for water logging and soil salinization (e.g. Masoud and Koike Citation2006, Guganesharajah et al. Citation2007). In Tunisia, about 36% of the irrigated areas are highly sensitive to salinization (DGACTA Citation2007). In Tunisian oases, poor soil and water management has reduced soil quality and agricultural production (CRUESI Citation1970). To prevent further soil degradation, soil salinity monitoring is essential so that proper and timely decisions regarding soil management can be made. For this purpose, precision agriculture can be used. The EM38 ground conductivity meter (Geonics Ltd, Canada) is considered one of the best tools for the appraisal of soil salinity in a geospatial context (Corwin and Lesch Citation2003, Citation2005). By using electromagnetic induction, non-invasive, rapid response and real-time measurements of apparent soil electrical conductivity (ECa) can be made. The EM38 is designed to estimate salinity in the root zone. It has an intercoil spacing of 1 m, which results in a penetration depth of about 0.75 and 1.5 m in the horizontal and vertical dipole orientations, respectively (Corwin and Lesch Citation2003).
Several factors influence ECa measurements, including soil salinity, water content, porosity, structure, temperature, clay content, mineralogy, cation exchange capacity and bulk density (e.g. McNeill Citation1980, Malicki et al. Citation1989, Persson and Berndtsson Citation1998, Rhoades et al. Citation1999, Doolittle et al. Citation2000, Brevik and Fenton Citation2002, Citation2004, Friedman Citation2005, Brevik et al. Citation2006, Corwin et al. Citation2006, Weller et al. Citation2007, Saey et al. Citation2009, Hossain et al. Citation2010, Zhu et al. Citation2010). Measurement by EM38 for soil salinity appraisal should be calibrated against the standard electrical conductivity of a saturated soil extract (ECe), which is used in salt-tolerance plant studies. The relationship between ECa and ECe is soil-specific, and for an accurate calibration, measurements of ECa are preferably made at field capacity (Kachanoski et al. Citation1988, McKenzie et al. Citation1989, Lesch et al. Citation1992, Rhoades et al. Citation1999, Herrero et al. Citation2003, Brevik et al. Citation2006). The water table is assumed to be at a depth that does not interfere with the electromagnetic induction (EM) measurements (Weller et al. Citation2007), and soil temperature should be recorded for ECa correction (Slavich and Petterson Citation1990, Doolittle et al. Citation2000, Brevik et al. Citation2004). By taking the initial experimental conditions into account, many models were proposed to calibrate the EM38 measurement with ECe (Slavich and Petterson Citation1990, Lesch et al. Citation1992, Corwin and Lesch Citation2003), including simple linear regression (SLR, Slavich and Petterson Citation1990, Aragüés et al. Citation2004), multiple linear regression (MLR) done with and without consideration of the theoretical EM depth response function (Corwin and Rhoades Citation1984, Slavich Citation1990, Rongjiang and Jingsong Citation2010), and logistic profile models, which involve a mix of empirical and physically-derived coefficients to model the salinity profile (Triantafilis et al. Citation2000).
It is well established that the shape of the soil salinity profile has a significant impact on EM38 measurements and on the EM–ECe calibrations. For non-uniform soil profiles, a retrieval algorithm based on horizontal and vertical dipole EM measurements (EMh and EMv, respectively) is often used to separate data for EM–ECe calibration. Corwin and Rhoades (Citation1990) found EMh/EMv > 1.05 for inverted profiles (salinity decreasing with depth) and EMh/EMv ≤ 1.05 for normal or leached profiles. Lesch et al. (Citation1992) provided a more robust universal calibration approach that does not depend on profile shape. Furthermore, Lesch et al. (Citation1995a, Citation1995b) developed and applied MLR calibration models capable of producing multiple types of soil salinity estimates.
In almost all the references cited above, the soil moisture was considered homogeneous, usually close to the field capacity. Unfortunately, these important conditions for calibrating the EM38 are not satisfied in many situations (e.g. Job Citation1992, Ceuppens and Wopereis Citation1999, Brenning et al. Citation2008, Heilig et al. Citation2011). Lesch and Corwin (Citation2003) discussed the effects of measuring in fields with water contents significantly below field capacity. In practice, this can occur due to infrequent irrigation and to poor irrigation uniformity. Hence, Lesch and Corwin (Citation2003) recommend that, when conducting a salinity survey, the minimum water content should be at least 65% of the field capacity whenever possible. In arid and semi-arid regions, the limited quantity of rainfall and water available for irrigation usually explains the large variation in gravimetric soil water content θ (%) between plots (e.g. Job Citation1992, Sols de Tunisie Citation1994). However, the standard θ measurement is tedious and time-consuming. Also, most ECe–EM38 calibration studies were performed in the field on a short time scale under homogenous climatic conditions and land uses. Temporal changes in ECe–EM38 calibrations are not unusual and they reflect the complex dynamics of the EM measurements (Corwin et al. Citation2006, Brenning et al. Citation2008, Aragüés et al. Citation2010).
Some studies have shown the possibility to use the EM38 for monitoring the depth (Dgw) and salinity (ECgw) of shallow groundwaters. A study by Doolittle et al. (Citation2000) related ECa to the depth to the water table and changes in soil moisture; the relationships were different in riparian and upland areas. In a humid climate, Sherlock and McDonnell (Citation2003) found a significant correlation between EMv and Dgw (0.5 < R 2 < 0.9). Johnson et al. (Citation2005) found a highly significant linear correlation between ECgw and EMv (R 2 = 0.9). Also, in a saline soil in Western Australia, Silberstein et al. (Citation2007) found that EM38 readings and soil salt storage were poorly correlated and that the EMv–Dgw relationship was significant (R 2 = 0.75, P < 0.001).
According to the research cited above, the relationship between ECe and EM38 readings is well established, and relationships between EM38 readings and groundwater properties (Dgw, ECgw) have also been indicated in recent research. In the present study, we investigate the possibility of using the EM38 to predict field ECe in a Saharan climate oasis with limited water available for irrigation (heterogeneous and non-uniform soil water content) and with gypsiferous soils over shallow and saline groundwater. Field surveys were performed over 4 years (2001–2004) and for different seasons (winter and summer). The objectives of the study were to (a) assess the performance of the EM38 in gypsiferous soils, (b) investigate the robustness of the EM38 for monitoring ECe, and (c) explore the possibility to use the EM38 to predict groundwater depth (Dgw) and groundwater electrical conductivity (ECgw).
2 MATERIALS AND METHODS
2.1 Experimental site
Experiments were conducted in the irrigated area of Fatnassa, an ancient oasis located at 33°47′26.6″N, 8°44′11.2″E (about 500 km south of Tunis, Tunisia). The oasis altitude varies from 24 m a.s.l. in the north to 17 m a.s.l. in the south and the land slope is about 3 to 5 per 1000. In the northeast, the oasis is delimited by Fatnassa village and in the southwest by Chott El Jerid (), a natural salt depression (below sea level) which constitutes the only natural drainage outlet in this region. The bioclimatic classification is Saharan. The rainfall is irregular and low (<100 mm year-1) and the potential evapotranspiration is about 2500 mm year-1 (Bahri et al. Citation2004). The study was conducted in the northern part of Fatnassa oasis, which covers 114 ha. The oasis contains 467 farming plots with an average surface of 0.25 ha (Ben Aïssa et al. Citation2005). The farming system is essentially composed of two traditional crop layers, with date palms and fodder crops constituting the principal and second crop layers, respectively. The soil texture is coarse and the soils are classified as Gypsic aridisol. Before 2000, irrigation water was distributed through dug canals and drainage was mainly supplied by open ditches. Currently, a water tower () allows water transport by gravity through three open concrete channels to the farms. Surface irrigation by flooding is still the main irrigation system used in the oasis. A water rota is organized within the fields, relying on each of the three open water channels that serve three irrigated sectors in the oasis. The duration of a water turn can be up to 25 days, due to both poor irrigation management and the uncontrolled expansion of date palm plantations (Omrani Citation2002). The present drainage system is composed of collectors and tile drains buried at about 1.5 m depth with 100 m spacing between drains. Because of the low slope to the natural drainage outlet (Chott El Jerid), the drain collectors (D1, D2 and D3) lead to a deep open artificial pond (). The irrigation and drainage system was restored between November 2000 and July 2002 (SAPI study team Citation2005). To reduce the impact of high soil salinity on fodder plants, farmers apply sand and organic matter as soil amendments (Omrani Citation2002). Due to the climatic conditions, the irrigation system (water rota) and the great variation in agricultural management by farmers, the soil moisture (θ) and groundwater properties (Dgw, ECgw) vary widely over the experimental area and by time of measurement (Bahri et al. Citation2004).
Fig. 1 Study area and sampling locations.
2.2 Data collection
An experimental network system of 27 agricultural plots was chosen for monitoring soil properties and groundwater (θ, ECa, ECe, Dgw and ECgw). Measurements were made over 4 years (2001–2004) on 12 dates (March, April, August and October 2001; March, July, September and November 2002; January, March and July 2003; and March 2004). Coordinates (x, y) and altitude (z) for the 27 plots were measured by GPS (Trimble, model 4600LS) with an accuracy of 0.01 m for x and y and 0.02 m for z. Over the period 2001–2004, four samples of irrigation water were collected for analysis. The average electrical conductivity of the irrigation water is about 3.7 dS m-1, pH = 7.7 and the sodium adsorption ratio SAR = 4.9.
2.2.1 Groundwater measurements
Twenty-seven (27) observation piezometers were installed to a depth of 2.5 m in the Fatnassa oasis (). Piezometers were used for measurements of Dgw and for sampling groundwater for chemical analysis (ECgw, pH, anions and cations). The altitude was used to calculate piezometric level (PL = plot altitude – Dgw).
2.2.2 Soil sampling
At each of the 27 piezometers sites, the soil was sampled at 0.2 m depth intervals to 1.2 m. Due to the labour-intensive nature of soil sampling, the samples were only taken at an average of about nine of the 27 plots on each sampling date. In total, about 630 soil samples were collected from 105 soil profiles. To avoid dehydration of soil gypsum, the samples were dried in a ventilated oven at 50°C for a minimum of two days until the soil weight became constant. After that, the soil properties were measured. For the first date of experiment (March 2001), for each of the 27 plots and six soil depths (0 to 1.2 m), the soil particle size was determined and the percentage of gypsum analysed according to the FAO (1990) method. Because of the coarse soil texture and the occurrence of clay flocculation in gypsiferous soils, eight sieves with different diameters (1, 0.5, 0.25, 0.2, 0.149, 0.105, 0.063 and 0.05 mm) were used to determine the soil particle size fraction. Soil samples collected over the 12 dates (2001–2004) were used for laboratory determination of the ECe and physical soil properties, such as soil moisture (θ) and water content at saturation (PS).
2.2.3 EM38 measurements
The EM38 was used to estimate salinity in the root zone. Measurements were taken at the surface of the soil and the receiving end was aligned in four directions (N, NE, S and SE) in both horizontal (EMh) and vertical (EMv) coil mode configurations (at the location of each piezometer plot). Consequently, for each coil mode configuration, the EMh or EMv measurements were the average of four measurements. For each of the 27 plots, EM readings were taken during all 12 surveys. The most extremely saline profiles (ECe > 40 dS m-1) were omitted from further analysis because it was desired to only include profiles within the plant response range (Slavich Citation1990). These extremely saline profiles were observed on 11 dates in two more-or-less abandoned plots (P11, P27, see ), where the average ECe at 0–0.4 m soil depth was 54 dS m-1 and at 0.2 m soil depth at plot P11 it was 115 dS m-1. Therefore, of the 105 soil sampling profiles only 94 were used for ECe calibration. During the field visits it was found that some piezometers were degraded or destroyed and could thus not be read. Therefore, only 87 and 73 measurements of Dgw and ECgw, respectively, were achieved ().
Table 1 Summary statistics of soil properties at various soil depths, groundwater properties, and EM38 measurements collected in various seasons and years (2001–2004). N: number of observations
2.3 ECe models
To predict ECe from the EM38 readings, soil and groundwater properties, three methods were compared. In the first method, used in Tunisia since the 1980s (Job and Marai Citation1990, Job Citation1992, Sols de Tunisie Citation1994), ECe is calculated from the predictors EMh and θ. The second method, developed by Lesch et al. (Citation2000), uses the spatial coordinates (x, y) and EM38 readings in a multiple linear regression (MLR) model. The third method applies a sensitivity test to find the best MLR model to predict field ECe (Bouksila et al. Citation2010). In the following, the three methods are referred to as the Job, Lesch and Bouksila models, respectively.
2.3.1 ECe prediction with the Job model
In arid irrigated land, soil moisture content is highly variable and its impact cannot be neglected when taking EM readings. In these situations, ECe is usually better estimated using both EM and θ. To avoid the colinearity between EMh and θ, EMh readings were converted to EMh at reference θ, according to (Job Citation1992):
where EMh(θ2) is the EMh expressed at the reference soil water field capacity (θ2, %), EMh(θ1) is the EM reading relative to the field soil moisture θ1, and δ is an empirical parameter depending mainly on soil type.
For several types of soils in Tunisia, the empirical parameter (δ) was found to be 5.4 (Hachicha and Job Citation1994), a typical value that fits most soils. In El Guettar oasis (in the south of Tunisia), characterized by similar soil properties to Fatnassa (sandy gypsiferous soil, 5 ≤ θ(%) ≤ 31 and 2 ≤ ECe (dS m-1) ≤ 45), the empirical parameter δ was equal to 5.12 (Sols de Tunisie Citation1994). In the analysis we used both of these δ values in Equationequation (1)(1). Since θ also is used to predict ECe, Equationequation (1)
(1) was considered an MLR model.
2.3.2 ECe prediction with the Lesch model
The calibration equation for converting EM38 readings (EMh and EMv) into ECe values was obtained using a stochastic calibration model which is a spatially-referenced MLR model (Lesch et al. Citation2000). In the regression equation, transformed and decorrelated signal data (i.e. the principal component scores), rather than raw signal readings, were used as predictor variables. The decorrelation procedure was used to eliminate colinearity between the EM readings, and scaling techniques of the trend surface parameters were used to increase the accuracy of predictions (Lesch et al. Citation1995b). For that, natural log-transformed variables were used (lnEMh, lnEMv, lnECe). The MLR model included the EM38 readings and spatial coordinates (x, y) of each survey site. The following regression model was used (Lesch et al. Citation2000):
where Z 1 and Z 2 are the decorrelated signal readings (principal component scores), X and Y are the scaled spatial coordinates of each survey point, and β i and bi are empirical parameters. The EMh and EMv readings were converted to Z 1 and Z 2 using the following transformation:
where a 1, a 2, a 3 and a 4 are determined by the principal component algorithm.
The first principal component score (Z 1) is an approximate average of the two EM readings at each survey point and the second principal component score (Z 2) represents a weighted linear contrast between the two readings (Lesch et al. Citation1995a). The spatial coordinates of the EM38 data were centred and scaled as follows:
where k is greater than [max(x) – min(x)] or [max(y) – min(y)].
2.3.3 ECe prediction with the Bouksila model
Since colinearity between EMh and EMv is a constraint when computing the regressions of the ECe–EM38 relationships, we explored the retrieval algorithm based on EM measurements. Inspired by Lesch et al. (Citation1995a, Citation1995b, Citation2000, Citation2005), the retrieval algorithm based on EM measurements was used as input candidate variables instead of EMv or EMh (e.g. (lnEMh – lnEMv), EMh – EMv, (EMh + EMv)/2, (EMv – EMh)/2, EMh/(EMv – EMh), EMh/EMv). Also, the Z
1, Z
2, X and Y variables (Equationequations (4)(4)
Equation
(5)–Equation(6)
(6)) were used with EMh and EMv to find the best MLR model. To eliminate any colinearity between groundwater properties (Dgw, ECgw) and EM readings, the retrieval algorithm (ECgw/Dgw, centred and scaled, standardized Dgw, etc.) and decorrelated data (using principal component scores instead of the observed Dgw and ECgw data) were used as predictors with the EM variables. Thus, the principal component scores for the Dgw and ECgw were denoted PCgw (= φDgw + τECgw).
To predict ECe using the EM readings and soil and groundwater properties, the first step was to select the best input variables for the MLR. This was done by selecting an SLR model between the EM38 readings and each predictor. The goal of the SLR analysis was to avoid any dependency between the predictor variables, and to detect potential parameters that may affect the EM readings and that could be used together with the EM observations to predict the ECe using an MLR model. Three groups of independent variables were used in the MLR models: (a) EM readings and their retrieval algorithms, (b) centred and scaled plot coordinates and altitude together with the EM variables, and (c) groundwater and soil properties together with group (b) predictors to estimate the field soil salinity (ECe).
The Statgraphics 5 Plus software (Manugistics, Inc., Bethesda, MD, USA) was used to find the best model to estimate soil salinity (ECe). For linear models, the software uses the least square or resistant estimation procedure (Statgraphics manual). The best SLR model to predict soil salinity was obtained by comparing the coefficient of determination R 2 and mean square error (MSE) of 27 linear models. The best SLR models were not necessarily mathematically linear (e.g. exponential, squared, multiplicative variables were used). For the MLR model, the software uses all combinations of input variables and calculates R 2, adjusted R 2 (R a 2) and MSE. The best models will have a minimum MSE and maximum R a 2. The regression models were computed to predict the soil salinity at six successive soil depths (the ECe at depth intervals of 0–0.2, 0–0.4, 0–0.6, 0–0.8, 0–1.0 and 0–1.2 m), as well as the entire salinity profile (six different ECe values between 0.2 and 1.2 m at 0.2 m intervals). To explore the impact of the measurement time (including changes in land use, soil management, climatic condition, etc.), the performance of the ECe–EM38 relationship was computed and compared using separate validation data collected in various seasons and years (e.g. all data 2001–2004, only March 2001–2004, March 2002/03, March 2001).
2.4 Prediction of groundwater properties from EM38 reading
The groundwater properties (Dgw, ECgw) were estimated from EM38 reading (EMh or EMv) or its retrieval algorithm. For this, only an SLR model was used. The methodology described above used to predict ECe was also used to find the best SLR model to predict groundwater properties.
3 RESULTS AND DISCUSSION
3.1 Exploratory data analysis
and show descriptive statistics of soil measurements at various depths, groundwater properties (Dgw, ECgw) and EM readings for different periods. The average soil sand content at the 0–1.2 m soil depth interval in the study area is about 99% and the gypsum content is about 62%. The soil moisture profile was very heterogeneous varying from very dry to saturation (from 3 to 52%) which could affect the EM readings. The ECe varied from 3 to 38 dS m-1 and the coefficient of variation of the mean (CV) decreased from 94% at 0.2 m to 41% at larger depths. The Kolmogorov-Smirnov test rejected the test of normal distribution of ECe for all soil depths. Therefore, the log-transformed variables were used for ECe data to give a Gaussian distribution of soil salinity (Herrero et al. Citation2003). The average gypsum content and soil saturation (saturation percentage, SP) varied from 56 to 66% (CV ≤ 22%) and from 42 to 45% (CV ≤ 17%), respectively. Similar to results by Corwin et al. (Citation2006), gypsum content and SP were not correlated with EM measurement (R < 0.35).
Table 2 Summary statistics of soil properties for 0–0.6 and 0–1.2 m soil depths, groundwater properties, and EM38 readings collected during different March visits. N: number of observations
The range in groundwater properties reflects the important variability in water management and drainage efficiency for different seasons. The average Dgw was 1.23 m and ECgw was 15 dS m-1. Thus, the shallow and saline groundwater affects the water content and salinity profile and therefore the EM signal. The correlation coefficients R of the Dgw–EMv and ECgw–EMv relationships were equal to –0.64 (P < 0.001) and 0.37 (P < 0.01), respectively. Therefore, the observed groundwater properties cannot be used with EM readings in the MLR model to predict ECe. Also, EMh and EMv were highly correlated (EMv = 0.98EMh + 0.38, R 2 = 0.91, P < 0.001). Therefore, it is necessary to avoid the colinearity between EMh and EMv when predicting ECe.
Four typical salinity profiles were observed: leached, uniform, inverted and heterogeneous. The inverted salinity profiles have an EMh/EMv ratio ≥ 0.9. This was lower than the 1.05 value proposed by Corwin and Rhoades (Citation1990). According to McNeill (Citation1980), part of the salts present in high-saline surface soils may not be in solution due to low water contents. Thus, these precipitated salts will not contribute to the EM38 readings. Accordingly, for conditions similar to our study, the EMh/EMv ratio should not be used to distinguish the salinity profiles for EM–ECe calibration.
3.2 Soil salinity prediction (ECe)
The soil salinity values (ECe) of the soil profile and of the six successive soil depths were predicted using SLR and MLR models. In the following, MLR1 is the MLR where the predictors are the EM variables and the plot coordinates, MLR2 is the MLR using these same predictors plus the groundwater properties.
3.2.1 Seasonal soil salinity prediction (ECe)
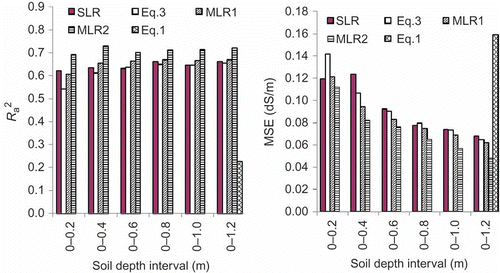
The data used for ECe prediction were collected in different seasons and years (12 dates from winter to summer, 2001–2004). The performance of the different models to predict soil salinity at the six successive soil depths is presented in For the six soil depths, the performance of the best SLR model to predict lnECe increased from the surface 0–0.2 m (R
2 = 0.62, MSE = 0.12 dS m-1) to the deeper soil 0–1.2 m profile (R
2 = 0.66, MSE = 0.07 dS m-1). For the surface soil layers (0–0.2 and 0.2–0.4 m), the best input for SLR was the ratio EMh/EMv. Indeed, for the 0–0.2 m soil depth interval, R
2 to predict lnECe was 0.53 and 0.62 with the predictors EMh and EMh/EMv ratio, respectively. These results can be explained by the dry soil surface that almost did not contribute to the EM readings, and the high vertical variation of θ due to the presence of a shallow water table. In arid Tunisia, the saline soil profile and the salt accumulation in the upper soil are associated with the presence of a shallow and salty water table (Bahri et al.
Citation2004, Bouksila et al.
Citation2010), which could explain the performance of the EMh/EMv ratio in predicting the salinity at the surface soil. When EM variables and spatial coordinates (X or/and Y, Equationequation (6)(6)) were used to predict lnECe using the MLR model (MLR1 in ), the R
a
2 was 0.61 (MSE = 0.12 dS m-1) at 0–0.2 m and increased to 0.67 (MSE = 0.062 dS m-1) at 0–1.2 m soil depth. The performance of the MLR1 model was similar to the best SLR model results. The observed groundwater properties were significantly correlated to θ with P < 0.001. When the retrieval algorithm of the groundwater properties and the plot coordinate variables were introduced as input candidates together with the EM readings the performance of the lnECe prediction was significantly improved (MLR2 in ). Using the MLR2 model to predict lnECe, R
a
2 varied from 0.69 to 0.72 (P < 0.001) and MSE from 0.11 to 0.05 dS m-1. Using the Lesch model to predict lnECe (Equationequation (3)
(3) in ), a significant (P < 0.001) and moderately strong relationship was found. At the soil surface (0–0.2 m), R
a
2 was 0.54 and MSE was 0.14 dS m-1 and for soil depth interval 0–1.2 m, R
a
2 increased to 0.65 and MSE decreased to 0.06 dS m-1. The performance of the Job model (Equationequation (1)
(1) in ) to predict ECe at soil depth interval of 0–1.2 m was not so good (R
2 = 0.25, MSE = 12.75 dS m-1). Because of the poor performance, the Job model is not recommended to predict seasonal lnECe or ECe. In addition to θ and groundwater properties, farm agricultural management (tillage, fertilization, sand amendment, crop cycle, etc.) and climatic conditions could affect the EM readings and therefore the ECe–EM calibration (Brenning et al.
Citation2008, Aragüés et al.
Citation2010).
Fig. 2 Adjusted R
2 (R
a
2) and mean square error (MSE) of predicting lnECe observed at various soil depth intervals and seasons (12 dates from 2001 to 2004) with various models (best SLR, Equationequations (1)(1) and (3), and MLR). MLR1: EM variables and plot coordinate as predictors; MLR2: same inputs than MLR1 plus groundwater properties.
3.2.2 Impact of measurement time on soil salinity prediction (ECe)
According to the correlation matrix, a strong simple linear correlation was observed between EMh or EMv readings for the various March dates (0.87 ≤ R ≤ 0.98 for EMh and 0.79 ≤ R ≤ 0.98 for EMv at P < 0.001). According to Brenning et al. (Citation2008), time-dependent random effects on EM measurements can be related to crop cultivation or soil moisture variation. In the experimental area, the lowest R value corresponds to the EM readings taken in March 2001 against those taken in the other March periods (0.79 ≤ R ≤ 0.87). This result can be explained by the absence of irrigation during the restoration of the irrigation system in 2001. In March 2001, the salinity profiles were usually inverted, but some farmers used salty drainage water or illegal wells for irrigation (Bahri et al. Citation2004). For 0.2 m soil depth, the correlation coefficient between lnECe and (EMh/EMv) decreased with increases in irrigation (R = 0.9, 0.78, 0.65 and 0.47 for March 2001, 2002, 2003 and 2004, respectively). In March 2004, the performance of the ECe–EM relationship was poorer than for the previous March periods (R varied from 0.5 to 0.85). The rainfall at Souk Lahad climatic station (15 km from Fatnassa oasis) was 26.7, 31.2, 144.5 and 69 mm year-1 in 2001, 2002, 2003 and 2004, respectively. The exceptionally high rainfall (103.9 mm) observed during the 6 months before March 2004 (September 2003–February 2004) could have indirectly affected the EM calibration. The rainfall could have caused soil leaching, decreased groundwater depth (average Dgw = 0.96 m) and groundwater salinity (average ECgw = 12.76 dS m-1) (), decreased soil temperature and improved vegetative soil cover. Also, after this exceptional rainfall event, the variation interval of both EM readings and ECe was less than before (under normal climate conditions). With lower ECe variation interval, the EM readings could be more affected by other physical or chemical soil properties, surface cover and groundwater properties than by soil salinity. Indeed, the statistics of soil and groundwater properties observed in March 2004 showed the lowest average, CV and range of ECe (). According to Lesch and Corwin (Citation2003), when the spatial variation in soil salinity decreases and the spatial variation in other soil properties increases, one or more of these other properties (SP, percentage clay, θ) will eventually supersede the soil salinity as the dominant soil property. Furthermore, when the water content drops too far below field capacity, the spatial variation in water content can become the dominant factor influencing the EM data, even in the presence of a large spatial variation in salinity (Lesch and Corwin Citation2003).
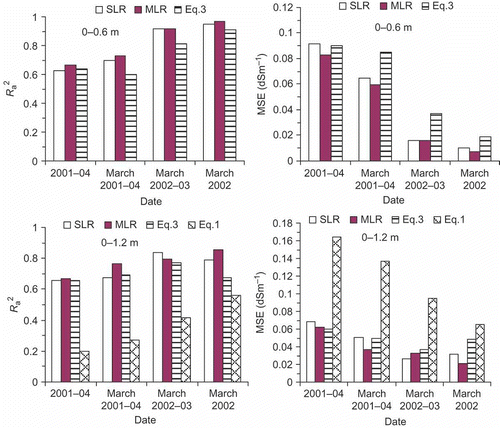
The performance of different models to predict soil salinity at different measurement times and soil depths (0–0.6 and 0–1.2 m) () corroborates these interpretations. The performance was weaker using data collected over several seasons and years (2001–2004) relative to those collected only during March in different years. The best model to predict lnECe was generally the MLR1 model, followed by the best SLR (Equationequations (3)(3) and (1), respectively). For the four 2001–2004 March visits, R
a
2 of the MLR model was 0.73 (MSE = 0.06 dS m-1) at 0–0.6 m (maximum density of forage roots) and 0.76 (MSE = 0.04 dS m-1) at 0–1.2 m (maximum density of palm roots). For the 0–1.2 m soil depth interval, R
a
2 decreased to about 0.68 and 0.38 for Equationequations (3)
(3) and (1), respectively. It is relevant to indicate that when groundwater properties were not used as predictors, the performance of the best SLR was almost the same as that of the MLR model. By using data collected only for March 2002 and March 2003 (the exceptional March 2001 and March 2004 data were discarded), R
a
2 of the MLR increased to 0.92 (MSE = 0.02 dS m-1) for 0–0.6 m and to 0.80 (MSE = 0.03 dS m-1) for the 0–1.2 m soil depth interval. Consequently, for better accuracy of soil salinity prediction using the EM38, it is advisable to perform the calibrations for each measurement period. If this is not possible, it could be preferable to use a lnECe–EM calibration for similar periods (such as season or crop cycle). To verify this conclusion and to predict soil salinity using EM38 readings, the data collected in March 2002 were used for calibration and those in March 2003 for validation. The performance (R
2, MSE) of the three models (best SLR, Equationequations (1)
(1) and (3)) to predict lnECe at various soil depths and various data subsets (training, validation, total) are presented in . The best model to predict soil salinity at the different soil depths was SLR, followed by Equationequations (3)
(3) and (1). Poorer results were observed for deeper composite soil depths (0–1.0 and 0–1.2 m), probably due to the impact of the shallow groundwater on EM38 readings. The same trend was observed when Equationequations (1)
(1) and (3) were used. Using the Job model to predict lnECe for the 0–1.2 m soil depth interval, a fairly good fit was achieved for the calibration subset, but the model performance decreased for the validation subset (). According to the results in , for similar time measurements, the best SLR model can be used with acceptable errors to predict soil salinity.
Table 3 Performance of three models (SLR, Equationequations (1) (1) and (3)) to predict the soil salinity (lnECe) from EM38 readings
Fig. 3 The R
a
2 and MSE of predicting lnECe at various soil depths and dates of measurement using various models (Equationequations (1)(1) and (3), best SLR and MLR1 models).
3.3 Prediction of groundwater properties from EMv readings
The EM38 readings were positively correlated with ECgw, although the R 2 of the ECgw–EMv relationship was low (0.16 and 0.25 using data collected on all 12 dates and the March measurements, respectively). Improvements in ECgw predictions were obtained when the ratio EMh/EMv was used to classify the data in different groups for the SLR model. The best ECgw–EMv relationship was obtained after exceptional events at the time of measurement. Indeed, in March 2001 (absence of irrigation and mainly upward water and salt flow), R 2 was 0.36 and increased to 0.52 in March 2004 (exceptional rainfall, important soil leaching and groundwater dilution). The simple linear regression model was used to predict Dgw from EMv for different time periods and various subsets (calibration and validation) (). The EM38 readings were negatively correlated with Dgw. These results corroborate previous findings for semi-arid conditions (Aragüés et al. Citation2004, Silberstein et al. 2007). The observed significant relationships between Dgw and soil properties (lnECe, θ, at P < 0.001) showed that in arid climates, shallow groundwater depth could be the major driver of water and solutes towards the soil surface. When the March measurements were used separately, the R 2 of the Dgw–EMv relationship varied (except in the March 2004 measurements) from 0.83 to 0.90 and MSE from 0.02 to 0.08 m ((a)). Using data collected on the four March dates, R 2 was 0.5 (MSE = 0.10 m), and model performance decreased when all 2001–2004 data were used (). (b) shows the observed and predicted Dgw for the calibration and validation data subsets, respectively.
Fig. 4 (a) Performance of the best SLR model to predict Dgw from EMv at various time measurements. (b) Observed and predicted Dgw (m) for calibration (March 2002) and validation (March 2003) subsets.
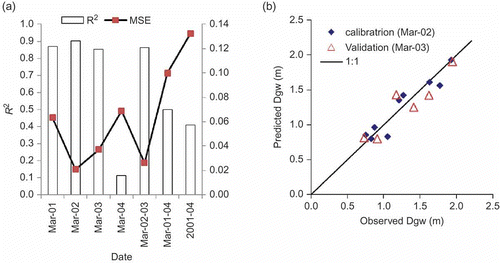
In the following, the data corresponding to exceptional events (March 2001 and March 2004) were excluded from the Dgw prediction using the EMv readings. The data collected in March 2002 and March 2003 were used for calibration and validation, respectively. These two measurement dates correspond to almost standard climate and water management conditions in the oasis, and where soil salinity was the result of successive phases of leaching (mainly by irrigation) and accumulation (capillarity rise processes). For the calibration subset, a highly significant (P < 0.0001) Dgw–EMv relationship was obtained: Dgw (m) = 3.189 – 1.864√EMv (dS/m) (R 2 = 0.90 and MSE = 0.017 m). For the validation subset, 85% of the variance was explained by the SLR model, and the MSE of the Dgw prediction was 0.025 m. For the total data (March 2002 and 2003), the R 2 was 0.88 and MSE = 0.020 m, indicating that it is possible to predict Dgw from EMv readings with acceptable accuracy.
4 SUMMARY AND CONCLUSIONS
Poor soil and water management results in water logging and soil salinization. This reduces soil quality and agricultural production. Accurate and rapid estimation of soil salinity can be used in precision agriculture to help land developers and farmers make appropriate decisions about crop production and soil and water management. In this study, we investigated the use of EM38 measurements to predict both the electrical conductivity of the saturated soil extract (ECe) and groundwater properties (depth, Dgw and electrical conductivity, ECgw). The study was conducted in the oasis of Fatnassa in southern Tunisia, which is characterized by limited water available for irrigation, gypsiferous soils and shallow and saline groundwater. Soil profiles were sampled at 0.2 m depth intervals to 1.2 m for soil property analysis. The plot spatial coordinates (x, y) and altitude (z) were measured by GPS. Besides soil profile characteristics, Dgw and ECgw were also measured. Groundwater and soil measurements were collected over 4 years (2001–2004) at 12 different periods. The collected data were used to predict soil salinity using different models (SLR, MLR, Job and Lesch).
Gypsum content (59–66%) and soil saturation (PS) did not correlate well with EM measurements (R < 0.35). The ratio EMh/EMv was the best independent variable to predict soil surface ECe. When all data collected during various seasons and years were combined, the best model to predict lnECe was the MLR, followed by either the SLR or the Lesch models (depending on the soil depth). Using the MLR models, the R a 2 varied from 0.61 to 0.67 and the MSE from 0.06 to 0.12 dS m-1.
The performance of all models improved when data were reduced to those collected during the same season (March 2001, 2002, 2003 and 2004). When data corresponding to an exceptional event were discarded from the analysis, a very strong and significant lnECe–EM relationship was obtained. At similar time measurements, the R 2 of the SLR model for the lnECe–EMh relationship was 0.90 (MSE = 0.02 dS m-1) and about 0.78 (MSE = 0.03 dS m-1) for the 0–0.6 m and 0–1.2 m soil depth intervals, respectively. For the validation subset (March 2003 data), R 2 of the lnECe–EMh relationship was 0.84 (MSE = 0.04 dS m-1) and 0.76 (MSE = 0.05 dS m-1) for 0–0.6 m and 0–1.2 m soil depths, respectively.
For various seasons and years, a significant and negative simple linear relationship was obtained between Dgw, soil properties (ECe and θ) and EM readings. The ECgw was positively but weakly correlated to ECe and EM readings. Over various seasons and years, using the SLR model for the Dgw–EMv relationship gave an R 2 value of 0.41 and MSE of 0.13 m. For seasonal data (March 2002 and 2003), the R 2 value of the Dgw–EMv relationship was 0.88 and MSE was 0.02 m. For the validation subset, 85% of the variance was explained by the SLR model and the MSE for the Dgw prediction was 0.03 m. These results indicate that EM38 readings can be used effectively to predict both soil salinity and groundwater depth in irrigated and arid areas with a shallow water table.
Acknowledgements
The authors acknowledge helpful funding from the Centre for Middle Eastern Studies through the MECW project at Lund University. We would also like to thank the reviewers for their time spent in improving the paper.
REFERENCES
- Aragüés , R. , Guillén , M. and Royo , A. 2010 . Five-year growth and yield response of two young olive cultivars (Olea europaea L., cvs. Arbequina and Empeltre) to soil salinity . Plant and Soil , 334 : 423 – 432 .
- Aragüés , R. , Puy , J. and Isidoro , D. 2004 . Vegetative growth response of young olive trees (Olea europaea L., cv. Arbequina) to soil salinity and waterlogging . Plant and Soil , 258 : 69 – 80 .
- Bahri , A. , Bouksila , F. and Ben Issa , I. 2004 . “ Water, salinity and drainage management in the oasis (in French) ” . Rapport d'activité de l'INRGREF, 32–36 .
- Ben Aïssa , I. 2005 . Water and salinity management in the southern Tunisian Oasis (in French) . Actes du séminaire Euro Méditerranéen “Modernisation de l'agriculture irriguée” (19–23 avril 2004, Rabat Maroc). Tome , 1 : 312 – 322 .
- Bouksila , F. 2008 . Soil water content and salinity determination using different dielectric methods in saline gypsiferous soil . Hydrological Sciences Journal , 53 ( 1 ) : 253 – 265 .
- Bouksila , F. 2010 . Estimating soil salinity over a shallow saline water table in semi-arid Tunisia . The Open Hydrology Journal , 4 : 91 – 101 .
- Brenning , A. , Koszinski , S. and Sommer , M. 2008 . Geostatistical homogenization of soil conductivity across field boundaries . Geoderma , 143 : 254 – 260 .
- Brevik , E.C. and Fenton , T.E. 2002 . Influence of soil water content, clay, temperature and carbonate minerals on electrical conductivity readings taken with the EM-38 . Soil Survey Horizons , 43 ( 1 ) : 9 – 13 .
- Brevik , E.C. and Fenton , T.E. 2004 . The effect of changes in bulk density on soil electrical conductivity as measured with the Geonics® EM-38 . Soil Survey Horizons , 45 ( 3 ) : 96 – 102 .
- Brevik , E.C. , Fenton , T.E. and Horton , R. 2004 . Effect of daily soil temperature fluctuations on soil electrical conductivity as measured with the Geonics EM-38 . Precision Agriculture , 5 : 145 – 152 .
- Brevik , E.C. , Fenton , T.E. and Lazari , A. 2006 . Soil electrical conductivity as a function of soil water content and implications for soil mapping . Precision Agriculture , 7 : 393 – 404 .
- Ceuppens , J. and Wopereis , M.C.S. 1999 . Impact of non-drained irrigated rice cropping on soil salinization in the Senegal River Delta . Geoderma , 92 : 125 – 140 .
- Corwin , D.L. and Lesch , S.M. 2003 . Application of soil electrical conductivity to precision agriculture: theory, principles, and guidelines . Agronomy Journal , 95 : 455 – 471 .
- Corwin , D.L. and Lesch , S.M. 2005 . Characterizing soil spatial variability with apparent soil electrical conductivity. I. Survey protocols . Computers and Electronics in Agriculture , 46 ( 1–3 ) : 103 – 133 .
- Corwin , D.L . 2006 . Monitoring management-induced spatio–temporal changes in soil quality through soil sampling directed by apparent electrical conductivity . Geoderma , 131 : 369 – 387 .
- Corwin , D.L. and Rhoades , J.D. 1984 . Measurement of inverted electrical conductivity profiles using electromagnetic induction . Soil Science Society of America Journal , 48 : 288 – 291 .
- Corwin , D.L. and Rhoades , J.D. 1990 . Establishing soil electrical conductivity–depth relations from electromagnetic induction measurements . Communications in Soil Science and Plant Analysis , 21 ( 11–12 ) : 861 – 901 .
- CRUESI (Centre de Recherche sur l'Utilisation des Eaux Saumâtres en Irrigation) . 1970 . “ Research and training on irrigation with saline water ” . 1962 – 1969 . Paris : Technical Report. Tunis/UNESCO .
- DGACTA (Direction Générale d'Aménagement et de Conservation des Terres Agricoles) . 2007 . “ Examen et évaluation de la situation actuelle de la salinisation des sols et préparation d'un plan d'action de lutte contre ce fléau dans les périmètres irrigués en Tunisie. Phase 2 : Ebauche du plan d'action. DGACTA, Ministère de l'agriculture et des ressources hydrauliques ” .
- Doolittle , J.A. , Noble , C. and Leinard , B. 2000 . An electromagnetic induction survey of a riparian area in southwest Montana . Soil Survey Horizons , 41 ( 2 ) : 27 – 36 .
- FAO (Food and Agriculture Organization) . 1990 . Management of gypsiferous soils , Rome : FAO, Soils Bulletin 62 .
- Friedman , S.P. 2005 . Soil properties influencing apparent electrical conductivity: a review . Computers and Electronics in Agriculture , 46 : 45 – 70 .
- Guganesharajah , K. 2007 . Simulation of processes involved in soil salinization to guide soil remediation . Journal of Irrigation and Drainage Engineering , 133 : 131 – 139 .
- Hachicha , M. and Job , J.O. 1994 . “ Soil salinity monitoring with electromagnetic induction in the Tunisian irrigated land (1989–1993) (in French) ” . Tunis : Rapport Final Convention Direction des Sols/ORSTOM .
- Heilig , J. 2011 . Evaluation of electromagnetic induction to characterize and map sodium-affected soils in the northern Great Plains . Soil Survey Horizons , 52 ( 3 ) : 77 – 88 .
- Herrero , J. , Ba , A.A. and Aragüés , R. 2003 . Soil salinity and its distribution determined by soil sampling and electromagnetic techniques . Soil Use and Management , 19 : 119 – 126 .
- Hossain , M.B . 2010 . EM38 for volumetric soil water content estimation in the root-zone of deep vertisol soils . Computers and Electronics in Agriculture , 74 : 100 – 109 .
- Job , J.O. 1992 . Saline soils in the oasis of El Guettar (southern Tunisia) (in French) , Montpellier , , France : These de Doctorat, University of Science and Technology of Languedoc .
- Job , J.O. and Marai , M. 1990 . “ Soil salinity study in the oasis of El Guettar (in French) ” . Etude SPécial ES 258, Direction des Sols. Ministère de l'Agriculture tunisien et ORSTOM .
- Johnson , C.K. , Eskridge , K.M. and Corwin , D.L. 2005 . Apparent soil electrical conductivity: applications for designing and evaluating field-scale experiments . Computers and Electronics in Agriculture , 46 : 181 – 202 .
- Kachanoski , R.G. , Gregorich , E.G. and Van Wesenbeeck , I.J. 1988 . Estimating spatial variations in soil water content using noncontacting electromagnetic inductive methods . Canadian Journal of Soil Science , 68 : 715 – 722 .
- Lesch , S.M. and Corwin , D.L. 2003 . Using the dual-pathway conductance model to determine how different soil properties influence conductivity survey data . Agronomy Journal , 95 : 365 – 379 .
- Lesch , S.M. , Corwin , D.L. and Robinson , D.A. 2005 . Apparent soil electrical conductivity mapping as an agricultural management tool in arid zone soils . Computers and Electronics in Agriculture , 46 : 351 – 378 .
- Lesch , S.M. 1992 . Mapping soil salinity using calibrated electromagnetic measurements . Soil Science Society of America Journal , 56 : 540 – 548 .
- Lesch , S.M. , Rhoades , J.D. and Corwin , D.L. 2000 . ESAP-95 version 2.10R: User manual and tutorial guide , Riverside , CA : USDA-ARS, George E. Brown, Jr Salinity Laboratory, Research Report 146 .
- Lesch , S.M. , Strauss , D.J. and Rhoades , J.D. 1995a . Spatial prediction of soil salinity using electromagnetic induction techniques: 1. Statistical prediction models: a comparison of multiple linear regression and cokriging . Water Resources Research , 31 : 373 – 386 .
- Lesch , S.M. , Strauss , D.J. and Rhoades , J.D. 1995b . Spatial prediction of soil salinity using electromagnetic induction techniques: 2. An efficient spatial sampling algorithm suitable for multiple linear regression model identification and estimation . Water Resources Research , 31 : 387 – 398 .
- Malicki , M.A. , Campbell , E.C. and Hanks , R.J. 1989 . Investigations on power factor of the soil electrical impedance as related to moisture, salinity, and bulk density . Irrigation Science , 10 : 55 – 62 .
- Masoud , A.A. and Koike , K. 2006 . Arid land salinization detected by remotely-sensed land cover changes: a case study in the Siwa region, NW Egypt . Journal of Arid Environments , 66 ( 152 ) : 151 – 167 .
- McKenzie , R.C. , Homistek , W. and Clark , N.F. 1989 . Conversion of electromagnetic inductance reading to saturated paste extract value in soil for different temperature, texture and moisture conditions . Canadian Journal of Soil Science , 69 : 25 – 32 .
- McNeill , J.D. 1980 . “ Electromagnetic terrain conductivity measurement at low induction numbers ” . Ontario : Geonics Limited, Technical note TN-6 .
- Omrani , N. 2002 . Salinity management (oasis of Fatnassa, Tembib and Tombar) (in French) , Tunis : Rapport de projet de fin d’études de l’ INAT .
- Persson , M. and Berndtsson , R. 1998 . Texture and electrical conductivity effects on temperature dependency in time domain reflectometry . Soil Science Society of America Journal , 62 : 887 – 893 .
- Rhoades , J.D. , Chanduvi , F. and Lesch , S.M. 1999 . Soil salinity assessment: methods and interpretation of electrical conductivity measurements , Rome : FAO Irrigation and Drainage Paper 57 .
- Rongjiang , Y. and Jingsong , Y. 2010 . Quantitative evaluation of soil salinity and its spatial distribution using electromagnetic induction method . Agricultural Water Management , 97 : 1961 – 1970 .
- Saey , T. 2009 . A pedotransfer function to evaluate the soil profile textural heterogeneity using proximally sensed apparent electrical conductivity . Geoderma , 150 : 389 – 395 .
- SAPI study team . 2005 . “ Irrigation perimeters improvement project in oasis in south Tunisia: final report ” . Tunis : DG/GREE .
- Sherlock , M.D. and McDonnell , J.J. 2003 . A new tool for hillslope hydrologists: spatially distributed groundwater level and soil water content measured using electromagnetic induction . Hydrological Processes , 17 : 1965 – 1977 .
- Silberstein, R., et al. 2007. Does grazing perennial pastures on saline land affect farm salt and water balances? SGSL Salt and Water Movement Theme Report. http://www.saltlandgenie.org.au/_literature_23944/RR_-_SGSL_Salt_and_Water_Movement_and_Site_Characterisation_Theme ( http://www.saltlandgenie.org.au/_literature_23944/RR_-_SGSL_Salt_and_Water_Movement_and_Site_Characterisation_Theme) (Accessed: 14 August 2012 ).
- Slavich , P.G. 1990 . Determining ECa–Depth profiles from electromagnetic induction measurements . Australian Journal of Soil Research , 28 : 443 – 452 .
- Slavich , P.G. and Petterson , G.H. 1990 . Estimating average rootzone salinity from electromagnetic induction (EM-38) measurements . Australian Journal of Soil Research , 28 : 453 – 463 .
- Sols de Tunisie . 1994 . Méthodologie d’étude de l’évolution de la salure des sols salés . Bulletin de la Direction des Sols , 15 : 301 – 324 .
- Triantafilis , T , Laslett , G.M. and McBratney , A.B. 2000 . Calibrating an electromagnetic induction instrument to measure salinity in soil under irrigated cotton . Soil Science Society of America Journal , 64 : 1009 – 1017 .
- Weller , U. 2007 . Mapping clay content across boundaries at the landscape scale with electromagnetic induction . Soil Science Society of America Journal , 71 : 1740 – 1747 .
- Zhu , Q. , Lin , H. and Doolittle , J. 2010 . Repeated electromagnetic induction surveys for determining subsurface hydrologic dynamics in an agricultural landscape . Soil Science Society of America Journal , 74 ( 5 ) : 1750 – 1762 .