
Abstract
This paper quantifies the impacts of bushfire and climate variability on streamflow from three southeast Australian catchments where bushfires occurred in February 1983. Three hydrological models (AWRA-L, Xinanjiang and GR4J) were first calibrated against streamflow data from the pre-bushfire period and then used to simulate runoff for the post-bushfire period with the calibrated parameters. The difference in simulated streamflow between pre- and post-bushfire periods provides an estimate of the impact of climate variability on streamflow. The impact of bushfire on streamflow is quantified by removing the climate variability impact from the difference in mean annual observed streamflow between post- and pre-bushfire periods. For the first 15 years after the 1983 bushfires, the results from hydrological models for the three catchments indicate that there is a substantial increase in streamflow; this is attributed to initial decreases in evapotranspiration and soil infiltration rates resulting from the fires, followed by logging activity. After 15 years, streamflow dynamics are more heavily influenced by climate effects, although some impact from fire and logging regeneration may still occur. The results show that hydrological models provide reasonably consistent estimates of bushfire and climate impacts on streamflow for the three catchments. The models can be used to quantify relative contributions of forest disturbance (bushfire, logging and other forest management) and climate variability. The results presented can also help forest managers understand the relationship between bushfire and climate variability impacts on water yield in the context of climate variability.
Résumé
Cet article quantifie les impacts des feux de brousse et de la variabilité climatique sur les débits de trois bassins du Sud-Est australien où des feux de brousse se sont produits en février 1983. Les trois modèles hydrologiques (AWRA-L, Xinanjiang et GR4J) sont tout d’abord été calés par rapport à des débits de la période précédant les feux de brousse, et ils ont été utilisés pour simuler les débits pour la période suivant les feux de brousse avec les paramètres calés. La différence des débits simulés entre les périodes précédant et suivant les feux de brousse fournit une estimation de l’impact de la variabilité climatique sur les débits. L’impact des feux de brousse sur les débits a été quantifié en soustrayant l’impact de la variabilité climatique de la différence entre les débits annuels moyens observés au cours des périodes précédant et suivant les feux de brousse. Pour les 15 premières années suivant les feux de brousse de 1983, les résultats des modèles hydrologiques pour les trois bassins montrent une augmentation substantielle des débits. L’augmentation des débits a été attribuée à des diminutions de l’évapotranspiration et du taux d’infiltration dans le sol résultant des feux, suivies l’exploitation forestière. Après 15 ans, la dynamique des débits est plus lourdement influencée par les effets du climat, bien qu’un certain impact du feu et de la régénération induite par l’exploitation forestière puisse encore se produire. Les résultats de l’étude montrent que les modèles hydrologiques fournissent des estimations cohérentes des impacts des feux de brousse et du climat sur les débits pour les trois bassins. Les modèles hydrologiques peuvent être utilisés pour quantifier les contributions relatives des modifications forestières (feux de brousse, exploitation forestière, et autres opérations forestières) et de la variabilité climatique. Les résultats présentés ici peuvent aussi aider les gestionnaires forestiers à comprendre la relation entre les impacts des feux de brousse et de la variabilité climatique sur le rendement hydrologique en contexte de variabilité climatique.
1 INTRODUCTION
Forested catchments are normally located in higher rainfall areas, and they produce most of the surface water for environmental and human water use in major parts of the world. This is particularly important in southeast (SE) Australia. For instance, most of the water supply for Melbourne, the capital of the State of Victoria, comes from native eucalypt forest catchments (Lane et al. Citation2010). The water yield of these catchments is mainly affected by climatic conditions, but it is also greatly affected by changes in vegetation cover. Bushfires are a major natural disturbance in forested catchments and potentially modify the water yield of the catchments through changes to evapotranspiration (ET) and soil moisture storage.
Water supply in SE Australian native forest catchments has been significantly influenced by natural and/or anthropogenic disturbances (Langford Citation1976, Kuczera Citation1987, Cornish Citation1993, Vertessy et al. Citation1996, Vertessy et al. Citation2001, Watson et al. Citation1999a, Cornish and Vertessy Citation2001, Lane et al. Citation2010). Bushfires are a major natural disturbance in SE Australia and have the potential to modify the hydrological response of forests by significantly altering interception, transpiration and soil properties. To give some scale of this issue, over 3 million ha of forests in SE Australia have been subject to bushfire in the past 9 years. The major anthropogenic forest disturbance is logging, which is a major source of pulp and timber in SE Australia. Like severe fire, clearfell logging substantially changes land cover and the associated hydrological response. In some catchments, salvage logging has combined with bushfire, changing hydrological processes and thus influencing runoff generation (Smith et al. Citation2011).
A number of studies have found that bushfires impact on streamflow by destroying the vegetation cover and litter layer, and altering the soil properties (e.g. Brown Citation1972, Scott Citation1993, Citation1997, Shakesby and Doerr Citation2006, Mataix-Solera et al. Citation2011, Soulis et al. Citation2012). However, bushfires cause a dramatic loss in vegetation cover, and present the potential for a distinct temporal change in ET, as the early loss of leaf area transitions into regrowth or recovering forest. Secondly, bushfires destroy the organic matter, destabilizing the soil structure in top soils (Mataix-Solera et al. Citation2002), produce ash (a mixture of black carbon, soot, charred material, charcoal and mineral material) (Moody et al. Citation2009), and enhance the impacts of water repellency (Debano Citation2000). Therefore, soil infiltration capacity can be reduced due to surface pores being sealed by fine soil and ash particles, and the hydrophobic compounds on the soil surface (Shakesby and Doerr Citation2006, Sheridan et al. Citation2007). Cumulatively, these effects increase runoff, and peak flow magnitude (Soulis et al. Citation2012).
Flow increases have been mostly reported following bushfires (e.g. Brown Citation1972, Helvey Citation1980, Scott Citation1993, Citation1997, Lane et al. Citation2006, Citation2012). However, Tan et al. (Citation2011) also reported no flow increases in Melbourne’s water supply catchments following the 2009 Black Saturday fires in Victoria, and a recent study measuring the evapotranspiration of Eucalyptus delegatensis stands after fire found significant increases in stand ET in years 6–7 post fire (Buckley et al. Citation2012).
Most fire-related studies (and many other disturbance studies) reported in the literature focus only on immediate and short-term impacts. Two landmark studies in Australia (Langford Citation1976, Kuczera Citation1987) that focused on multi-decadal flow sequences were the first to identify a significant flow decline as the forest recovers. These studies found that the regrowth stands of Eucalyptus regnans (mountain ash) killed in the 1939 bushfire were yielding significantly less water than the old growth stands they replaced. Kuczera (Citation1987) proposed a model that, expressed as an age–yield curve, shows a 50% decline in flow by age 25–30 relative to an old growth baseline, with a gradual recovery over more than 100 years. Watson et al. (Citation1999a) agreed with the general trend of the curve, with the major departure being a flow increase in the first few years. Kuczera’s analysis (Kuczera Citation1987) did not identify this early increase. Both models predict streamflow to begin decreasing below pre-fire level in less than 10 years. Feikema et al. (Citation2013) recently suggested the discrepancy in the two models is due to the differences in the rainfall/soil moisture storage prior to and immediately following the disturbance.
The reasons for this age–yield relationship were untangled by a series of process studies (e.g. Vertessy et al. Citation1995, Citation1996, Vertessy et al. Citation2001, Haydon et al. Citation1997, Watson et al. Citation1999b, Vaze et al. Citation2004, Citation2009). Fire is the ecological trigger for E. regnans and other ash-type eucalypt forests (mainly E. delegatensis). Moderately-hot fires kill the trees, which results in very dense regeneration from seeds, leading to a rapid development of sapwood area and leaf area. These single aged stands thin out naturally with competition, leading to development of an understorey and gradual loss of overstorey density. As the stands thin, water use decreases.
In contrast to ash forests, the effect of fire on most other eucalypt species is far less dramatic, as they are fire resistant, with relatively low incidence of mortality compared with ash stands (Benyon and Lane Citation2013). Complete regrowth stands in these mixed species forests are rare. Loss of leaves in the canopy is compensated by growth of epicormic shoots from the trunk and branches, and seedling germination. Gradually the canopy is re-established and the dominant trees out-compete seedlings. Recent studies have increased our knowledge of non-ash post-fire ET dynamics (Gharun et al. Citation2013, Nolan et al. Citation2014), with no data suggesting that significant long-term changes are likely unless there is widespread mortality. It is generally conceded that this rarely occurs (e.g. Purdie and Slatyer Citation1976, Christensen et al. Citation1981, Gill Citation1995, Vivian et al. Citation2008), which means the logging impact reported by Cornish (Citation1993) and Cornish and Vertessy (Citation2001) is unlikely. Although not well measured, it can be argued that these forests re-establish their canopy in less than 10 years (and often much faster) and return to the pre-fire equilibrium ET.
When considering bushfire impact on streamflow, climate variability is also an important factor that can greatly affect streamflow (Dam Citation1999, Lane et al. Citation2005). Precipitation and potential evapotranspiration are two dominant climate factors in the hydrological cycle. The high variability of rainfall and temperature observed in eastern Australia (Stone and Auliciems Citation1992, Kiem and Franks Citation2001) significantly influence catchment hydrology. For example, a prolonged drought since the mid-1990s in southeast Australia has had a serious impact on bushfire regimes and water availability for industrial and consumptive use (Verdon-Kidd and Kiem Citation2009). There have been numerous studies investigating the impacts of land-use/land cover change and climate variability on streamflow (Li et al. Citation2007, Citation2009, Tomer and Schilling Citation2009, Nangia et al. Citation2010, Li et al. Citation2012). Most of these studies focus on vegetation change due to afforestation, deforestation and other human activities. However, bushfire and climate variability impacts on streamflow are rarely covered.
To investigate forest disturbance and climate variability impacts on streamflow, hydrological modelling is extensively used. Modelling studies on forest disturbance in native SE Australian forests have included physically-based (e.g. Vertessy et al. Citation1993, Citation1995, Watson et al. Citation1999b), empirical (Watson et al. Citation1999a, Cornish and Vertessy Citation2001) and lumped rainfall–runoff models (e.g. Post and Jakeman Citation1996). The physically-based approaches are particularly attractive for the ash species because of the dynamic nature of stand responses. This is mainly because these models consider vegetation dynamics, simulate forest regrowth after disturbance, and then try to model runoff under transient conditions. The application of these models on catchments affected by bushfires or logging is subject to the availability of detailed catchment attributes which are necessary for the parameterization of these models (Lane et al. Citation2010, Feikema et al. Citation2013). These detailed catchment attributes at fine spatial resolution are seldom available for medium to large sized catchments and this normally constrains the successful application of such models. Lane et al. (Citation2010) highlighted the strengths and weaknesses of physically-based approaches for fire modelling, and note that parameterization for a wide range of vegetation types and climates is problematic. Bushfires disturb far greater areas and distribution of forest species than commercial logging, leading to parameterization issues. Empirical models have been successfully applied for forecasting at large scales for recent Victorian fire events (Mannik et al. Citation2009). Although this approach avoids some parameterization issues by neglecting rainfall dynamics and internal catchment processes, it is constrained by untested assumptions of vegetation response to fire and by application to highly variable forest and land uses with a paucity of response data.
Lumped rainfall–runoff models have simpler model structure, fewer model parameters and less input information, compared to the physically-based models. Therefore, the lumped rainfall–runoff models are easier to apply for hydrological modelling, and they provide a convenient method to estimate the relative impacts of catchment disturbances (such as bushfire and logging) and climate variability on streamflow for any size of catchment. However, it is essential to calibrate and validate the rainfall–runoff models to get an optimum simulation result (Beven Citation1989). Model calibration is an iterative process to refine model parameters by comparing simulated and observed data to satisfy the criterion of accuracy; model validation is used to evaluate the ability of a model to predict streamflow outside the calibration with the calibrated parameters (Refsgaard and Henriksen Citation2004). This model validation exercise makes sure that a rainfall–runoff model can simulate runoff time series for an independent period or under different climatic conditions. The calibrated and validated rainfall–runoff models can be used to quantify the impact of climate variability on catchment water yield and then to estimate the disturbance impact (Tuteja et al. Citation2007, Li et al. Citation2012).
The main objective of this paper is to quantify the impacts of climate variability and bushfires on streamflow from three southeast Australian catchments where Ash Wednesday bushfires occurred in February 1983 () using three lumped conceptual rainfall–runoff models: AWRA-L (Vaze et al. Citation2013a), Xinanjiang (Ren-Jun Citation1992) and GR4J (Perrin et al. Citation2003). The three models are first calibrated against observed streamflow obtained from the pre-bushfire period and then the calibrated models are applied to predict streamflow for the post-bushfire period. However, model transposability from calibration to validation cannot be checked in these three bushfire-impacted catchments because of major differences in vegetation cover and soil properties between the pre- and post-bushfire periods. Four neighbouring unimpacted catchments with similar vegetation and climatic conditions were used to validate model transposability (). The impacts of bushfire and climate variability on streamflow for the three bushfire-impacted catchments are quantified using the calibrated hydrological models.
2 CATCHMENT AND DATA
2.1 Study catchments
The three bushfire-impacted catchments are located in the Central Highlands of Victoria, east of Melbourne ((a), (b) and (c) in (II)). Elevations range from 112–901 m (Yarra River), 207–1126 m (Latrobe River), and 320–940 m (Starvation Creek). The geology of the catchments is dominated by Devonian granites with smaller areas of Devonian metamorphics (mainly hornfels), and some sandstones. They are characterized by deep, well structured and highly conductive soils (e.g. Davis et al. Citation1999, Lane et al. Citation2004), mainly red or brown ferrosols or dermosols (red or brown earths). These soils can be more than 5 m deep and have large storage capacities. They support a mix of pure E. regnans (mountain ash) and mixed damp eucalypt species, predominantly E. obliqua, E. cypellocarpa and E. sieberi. The area of ash is 56% for the Latrobe River catchment, 50% for the Yarra River catchment and 51% for Starvation Creek. The ash stands were all regrowth, originating from the 1939 bushfires (State Forest Resource Inventory, SFRI).
Fig. 1 Locations of the three study catchments and four validation catchments (I and II); and bushfire extent (III) and logging extent (IV) for the three study catchments.
provides the catchment areas, burnt area, percentage burnt and study period of record, and summarizes the rainfall and areal potential evapotranspiration (APET) data.
Table 1 Catchments attributes and calibration and test periods.
Table 2 Mean annual streamflow, rainfall and areal potential evapotranspiration (APET) for different periods for the three catchments. “start year” is the calibration start year of the streamflow record and “end year” is the end year of the streamflow record.
Apportioning the vegetation impact of the burnt area is not straightforward. Based on forest inventory data we can establish a minimum impact via ash mortality. This is based on the SFRI dataset that gives species and age distributions. However, the impact on the non-ash species is far less certain. We have no fire severity data for this fire. Recent studies have found no evidence of stand replacement in non-ash stands, with overstorey mortality of the order of 10–20% (Benyon and Lane Citation2013, Nolan et al. Citation2014). It is unlikely there was widescale mortality, but it is impossible to know exactly what the mixed-species disturbance was. The SFRI data are derived from ground-truthed air-photo analysis and give a disturbance date, but no information on stand density changes. ) shows the cumulative mortality/regrowth for mountain ash for the catchments. It is assumed that any regeneration area from 1984 was salvage logging of fire-killed ash. The known fire-mortality rates for the catchments are 10%, 25% and 3% for the Latrobe, Yarra and Starvation Creek catchments, respectively. ) includes the non-ash data, but it is unlikely that increased regeneration percentages are realistic. The area burnt for Starvation Creek is 84%, but as only 3% results in a fire-kill of ash it appears the severity was not high in that catchment. shows clearly that, subsequent to 1983/84 there was a significant percentage of further disturbance. This is clearfell logging (in the 1990s and early 2000s) of mountain ash and some other eucalpypt species as the post-1939 fire regrowth reached prime harvest age. Thus the analysis in this paper considers a mixture of fire, logging and climate effects on streamflow.
Fig. 2 Cumulative percentage of mortality/regrowth for the three study catchments: (a) mortality/regrowth for ash; (b) mortality/regrowth for all species.
The four medium-size forested catchments around the three bushfire-impacted catchments are selected for model validation. These four catchments are unregulated and were not affected by bushfires ( (II), catchments (1)–(4): 405205, 405209, 405227 and 227202, respectively). All these four catchments have long-term reliable streamflow records spanning from the pre-bushfire period to the post-bushfire period. Therefore, they can be used for investigating the transposability of calibrated model parameters in time.
The catchment area for the four catchments varies from 109 to 1080 km2 (). The four catchments are mostly covered by eucalypt forest, with a forest ratio varying from 0.86 to 1.0. The mean elevations for catchments 405205, 405209, 405227 and 227202 are 670.5, 604.4, 751.4 and 155.3 m a.s.l., respectively. The vegetation cover and climatic conditions for these four catchments are similar to those for the three bushfire-impacted catchments and they experienced similar dry and wet periods as the bushfire-impacted catchments.
2.2 Data
This study uses more than 30 years of historical streamflow data (Qobs) extending from the pre-bushfire period to the post-bushfire period (). The data for the Latrobe, Yarra and Starvation Creek catchments, as well as the four validation catchments, are available for the periods 1966–2007, 1973–2004, 1971–2000 and 1975–2009, respectively. The daily streamflow data were obtained from the Victorian Water Resources Data Warehouse (http://www.vicwaterdata.net) and checked for data quality to be used for hydrological modelling (Vaze et al. Citation2010a). The climatic data (daily precipitation, P; areal potential evapotranspiration, APET; maximum temperature, Tmax; minimum temperature, Tmin; actual vapour pressure, e; and solar radiation, Rs) used in this study come from the SILO Data Drill produced by the Queensland Department of Environment and Resource Management (http://www.derm.qld.gov.au/silo; Jeffrey et al. Citation2001). The daily gridded SILO data (0.05° × 0.05°) are interpolated from 4600 point measurements across Australia (Jeffrey et al. Citation2001). Ordinary kriging was used to interpolate daily and monthly precipitation and cross-validation indicates precipitation with a mean absolute value of 12.2 mm/month, indicating good quality of interpolation. The daily climatic data are used to drive the three rainfall–runoff models (AWRA-L, Xinanjiang and GR4J). The APET used in the Xinanjiang and GR4J models was calculated from the 0.05° Tmax, Tmin, Rs and e using Morton’s wet environment (or equilibrium evaporation, or areal potential evaporation) algorithms (Morton Citation1983).
3 METHODOLOGY
3.1 General framework
Streamflow is controlled not only by climate conditions, but by catchment characteristics. It can be assumed that streamflow changes as a result of climate variability and the changes in catchment characteristics, which can be written as:
where ΔQtot is the total streamflow change between two periods, 1 and 2, estimated as , where
is the mean annual streamflow observed in Period 1 when catchment disturbance is negligible (the baseline) and
is the mean annual streamflow observed in Period 2 after significant catchment disturbance; ΔQcc is the change in streamflow caused by a change in catchment characteristics; and ΔQclim is the change in streamflow contributed by climate variability.
The three forested catchments selected in this study are not subject to dam regulations or diversions. Therefore, changes in catchment characteristics are primarily due to vegetation cover loss and changes in soil properties due to bushfire (ΔQfire). As a result, ΔQcc is replaced by ΔQfire and equation (1) can be rewritten as:
The value of ΔQtot can be estimated from streamflow data observed in the two periods, and ΔQfire can be quantified once ΔQclim is available. Here, the three hydrological models are used to estimate ΔQclim. First, these models are driven by climate inputs and calibrated against observed streamflow data in Period 1. Secondly, the calibrated models are driven by climate inputs in Period 2 to simulate streamflow in that period. Since these calibrated models are only driven by climate variables, rainfall and areal potential evaporatranspiration (APET), the changes in the simulated streamflow between the two periods are solely caused by climate variability. Therefore, the climatic variability impact on streamflow (ΔQclim) can be estimated as:
where is the mean annual streamflow simulated in the calibration period and
is the mean annual streamflow simulated in the test period (or post-bushfire period).
This approach assumes that there are no noticeable changes in model bias between the model calibration period (pre-bushfire) and the model test period (post-bushfire), and the calibrated parameter set can be transferred from the calibration period to the test period. Once ΔQclim is quantified, ΔQfire can be calculated from equations (2) and (3).
3.2 Hydrological modelling
Three hydrological models, GR4J (Perrin et al. Citation2003), Xinanjiang (XAJ; Ren-Jun Citation1992) and AWRA-L (Vaze et al. Citation2013b), are used in this study. summarizes the major characteristics of, and differences between, the three models. shows the parameter ranges. The AWRA-L, XAJ and GR4J models have 17, 14 and four parameters, respectively. All three models have runoff generation soil stores and account for actual evapotranspiration processes. Although AWRA-L can be applied as a gridded model, the three models are applied as lumped models in this study due to lack of detailed catchment attributes at the grid scale. The XAJ model considers that the soil water storage is distributed in a statistical way in space across the catchment. The GR4J model adopts two unit hydrographs for routing. The models are briefly described below.
Table 3 Overview of the characteristics for the three hydrological models.
Table 4 Free parameters of the three hydrological models.
3.2.1 Model description
3.2.1.1 GR4J
The GR4J model (Perrin et al. Citation2003) is a daily lumped conceptual rainfall–runoff model. Streamflow is estimated from mean areal daily P and APET time series. It has two stores, the production and routing stores, and four parameters to calibrate. It has been applied over a wide range of hydro-climatic conditions (Perrin et al. Citation2003, Coron et al. Citation2012, Lerat et al. Citation2012), including application across southeast Australia (Vaze et al. Citation2010a), and used in the MOPEX experiment of rainfall–runoff model intercomparison (Andréassian et al. Citation2006).
3.2.1.2 XAJ
The Xinanjiang model (XAJ; Ren-Jun Citation1992) is also a lumped conceptual daily rainfall–runoff model. Model inputs include P and APET time series. It has been widely applied in humid and semi-humid regions in China since its publication in 1980 (Zhao et al. Citation1980, Ren-Jun Citation1992, Jayawardena and Zhou Citation2000, Cheng et al. Citation2002), and it has been successfully applied in southeast Australia (Zhang and Chiew Citation2009, Li et al. Citation2012). The XAJ model includes 14 parameters and four submodels: a three-layer evapotranspiration submodel, a runoff generation submodel, a runoff separation submodel and a runoff routing submodel.
3.2.1.3 AWRA-L
The Australian Water Resources Assessment system Landscape Model (AWRA-L; Van Dijk Citation2010, Vaze et al. Citation2013a) is a one-dimensional, grid-based water balance model that simulates water stores and flows in the soil, groundwater and surface water systems. Each grid cell consists of two hydrological response units (HRUs): deep-rooted and shallow-rooted vegetation. The AWRA-L model contains 17 calibration parameters and four submodels for simulating runoff generation, radiation and energy, vapor fluxes and vegetation phenology, respectively. The forcing data include daily precipitation, maximum temperature, minimum temperature and solar radiation and the outputs include daily water fluxes. Though the AWRA-L model is grid-based, it is used as a lumped hydrological model for simulating runoff time series across Australia (Vaze et al. Citation2013b). It is applied as a lumped model in this study due to lack of detailed catchment attributes at grid scale.
3.2.2 Calibration
The particle swarm optimization (PSO; Eberhart and Kennedy Citation1995) is used for model calibration (or parameter optimization). The PSO method originates from the swarm paradigm, called particle swarm, and can find the so-called global or near-global optimum; it has been successfully used for calibrating hydrological models (Chau Citation2006, Gill et al. Citation2006, Zhang and Chiew Citation2009).
All conceptual hydrological models need to be calibrated before they can be applied for catchment water balance assessments. The Nash-Sutcliffe efficiency criterion (NSE; Nash and Sutcliffe Citation1970) is the most widely used for calibration and evaluation of hydrological models. The AWRA-L, XAJ and GR4J hydrological models are calibrated by maximizing the objective function, F,which is a weighted combination of NSE of monthly runoff and a logarithmic function of bias (B, total model error divided by total observed streamflow) (Viney et al. Citation2009, Vaze et al. Citation2010b) given by:
NSE is expressed as:
B is defined as:
where Qobs is recorded monthly runoff, Qsim is simulated monthly runoff, is the arithmetic mean of the observed runoff, i is the ith month, and n is the number of months. This objective function provides a smooth but less severe bias constraint, compared to the bucket constraint, and an advantage of the log-bias constraint is that it does not suffer from the numerical issues that can influence predictions/simulations using the non-continuous bucket constraint (Viney et al. Citation2009).
The pre-bushfire period (start of flow record to 1982) is used for model calibration and the post-bushfire period (1983 to end of flow record) is used as the test period. summarizes the calibration and test periods for each catchment, with the first year of calibration period used for model warm-up. summarizes the optimized parameter values.
Table 5 Optimal sets of free parameters from three hydrological models for the three study catchments.
3.2.3 Validation
Validation is used to determine the suitability of the calibrated models for predicting streamflow over any period outside the calibration period using the same catchment characteristics (Vaze et al. Citation2012). However, the study catchments in this paper suffered from significant changes in vegetation cover and soil properties due to the 1983 bushfires. There was also a prolonged drought in the mid-1990s. As such, it was necessary to evaluate whether the models are able to adequately reproduce catchment hydrology behaviour in the post-bushfire period. Therefore, four unregulated (unburnt) forested catchments located around the three study catchments were selected for validation ().
For the four selected catchments, the pre-bushfire period (1975–1982) was used for model calibration and three post-bushfire periods, 1983–2009, 1983–1998 and 1999–2009, were used for model validation (). The calibrated parameter sets from the pre-bushfire period were used to simulate the streamflow in the post-bushfire period. The NSE and B in the validation period are compared to those in the calibration period to assess whether the model calibrated in the pre-bushfire period can reproduce the hydrological behaviour in the post-bushfire period.
Table 6 Calibration and validation results for the GR4J model in four undisturbed catchments.
4 RESULTS AND DISCUSSION
4.1 Hydrological model calibration
The hydrological models’ calibration and test periods, and the calibration results for the study catchments are shown in and , respectively. The NSE results of calibration period for the three models are in the ranges 0.78–0.85, 0.78–0.85 and 0.67–0.83 for AWRA-L, XAJ and GR4J, respectively. The calibration B values range from –0.76 to 0.39% for AWRA-L, 0.66 to 2.65% for XAJ and–0.57 to 2.29% for the GR4J model. The predicted and observed annual streamflow for the entire modelling periods are shown in –. There is a good agreement between the simulated and observed streamflow in the calibration period (start of flow record to 1982). The calibration results for the three models are satisfactory and are comparable with other hydrological model calibration results reported in the literature (Vaze and Teng Citation2011, Vaze et al. Citation2011a, Citation2011b). The calibration results also indicate that the model bias in simulating monthly runoff is small and non-systematic and the models used in this study are robust enough to simulate streamflow over an independent test period. The daily time series of observed and simulated streamflow in model calibration for a 2-year period for the Latrobe catchment at Noojee (hereafter Latrobe@Noojee) is shown in ). The results show that the calibrated model is able to reproduce the daily observed streamflow reasonably well.
Fig. 3 Variation of annual rainfall, observed and simulated annual streamflow at the three study catchments for the AWRA-L model: (a) Latrobe@Noojee, (b) Starvation Creek, and (c) Yarra River@Little Yarra. The two dashed vertical lines indicate the years 1983 and 1998.
Fig. 4 Variation of annual rainfall, observed and simulated annual streamflow at the three study catchments for the XAJ model: (a) Latrobe@Noojee, (b) Starvation Creek, and (c) Yarra River@Little Yarra. The two dashed vertical lines indicate the years 1983 and 1998.
Fig. 5 Variation of annual rainfall, observed and simulated annual streamflow at the three study catchments for the GR4J model: (a) Latrobe@Noojee, (b) Starvation Creek, and (c) Yarra River@Little Yarra. The two dashed vertical lines indicate the years 1983 and 1998.
Fig. 6 Comparison of observed and simulated daily streamflow for the Latrobe@Noojee catchment using the GR4J model: (a) Calibration, 1977–1978, and (b) Simulation, 1991–1992.
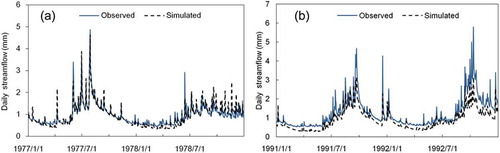
Table 7 Hydrological model calibration results for the three catchments.
4.2 Model validation
The results from the three models for the parameter transposability modelling experiments are similar; shows the model calibration and validation results for the GR4J model.
The modelling results show that the GR4J model generally performs reasonably well both in the calibration and validation periods. For all the four catchments, the NSE values obtained for the validation periods are similar to those obtained for the calibration period. The differences between the B values for the calibration and validation periods for all the four catchments are also small. First, the B values obtained in the whole validation period (1983–2009) are compared to those obtained in the calibration period (1975–1982). For catchment 405205, the B value obtained in the validation period is actually smaller (about 0.06) than that obtained in the calibration period; for the other three catchments, the B values are slightly larger (B increase of about 0.03–0.07) than those obtained in the calibration period. Secondly, the validation period is split into two: 1983–1998 and 1999–2009, to match the two post-bushfire periods used for bushfire impact analysis. The bias obtained in the first validation period (1983–1998) is similar to that obtained in the second validation period (1999–2004) for catchment 405205, but is about 0.03–0.12 smaller for other three catchments. The results for these four neighbouring catchments provide reasonable confidence in the hydrological modelling results (as discussed in Section 4.5), quantifying the impacts of climate variability and vegetation change for the three study catchments.
4.3 Hydrological model simulation
The calibrated rainfall–runoff model parameters combined with climatic data (P, APET, Tmax, Tmin, Rs and e) were applied to simulate streamflow for the entire post-bushfire test periods () to investigate the 1983 bushfire and climate variability impact on streamflow from the three catchments. As the hydrological models are driven using observed climatic data for the post-bushfire period, it can be assumed that the impact of climatic difference between pre- and post-bushfire periods has been taken out. Therefore, the difference in observed and predicted streamflow during the post-bushfire period is solely due to reductions in interception, actual transpiration and soil infiltration rates caused by bushfire.
The observed and simulated monthly streamflow for the three catchments are shown in – for the AWRA-L, XAJ and GR4J models, respectively, and ) shows the daily streamflow for one of the catchments. For all the three catchments, simulated annual streamflow from the three models is noticeably lower than the observed streamflow in the initial period post-bushfire (1983–1998). In the period after 1999, the runoff simulated by the three models is in reasonable agreement with the observed runoff.
To quantify the relative impacts of the 1983 bushfire and climate variability on streamflow during the post-bushfire test period, the simulated streamflow for the AWRA-L, XAJ and GR4J models was compared with the observed streamflow (see Section 3.1 for the methodology). The difference in observed and simulated streamflow during post-bushfire periods is due to bushfire. The climate variability impact on streamflow is the difference of simulated streamflow between pre- and post-bushfire periods. shows the simulation results for the AWRA-L model (columns 5 to 8), the XAJ model (columns 9 to 12) and the GR4J model (columns 13 to 16), for the post-bushfire climate dataset and calibrated parameters from calibration periods.
Table 8 Effects of bushfire and climate variability on the mean annual streamflow for the three catchments.
As shown in , the total streamflow change for the first 15 years post-bushfire shows an increase (when compared to the pre-bushfire period). The values of ΔQtot caused by the 1983 bushfires and climate variability for the Latrobe@Noojee, Starvation Creek and Yarra River@Little Yarra catchments are 52, 107 and 36 mm, respectively, which represent about 17, 26 and 12% increase in streamflow, respectively. summarizes the relative effects of climate variability and bushfire on streamflow from the three hydrological models. During the first 15 years post-bushfire, all the three models show (ΔQfire) that bushfire causes an increase in streamflow and the simulation results are similar in magnitude for the three catchments. When averaged over the three models, the increases in streamflow caused by bushfire are 80, 136 and 30mm (26.4, 32.6 and 9.9%) for the Latrobe@Noojee, Starvation Creek and Yarra River@Little Yarra catchments, respectively. Compared to the impact of bushfire, the impact of climate variability (ΔQclim) is small for all three study catchments. When averaged over the three models, the changes in streamflow caused by climate variability are –35, –6 and 2 mm (–10.4%, –1.4% and 0.7% of pre-bushfire streamflow) for the Latrobe@Noojee, Starvation Creek and Yarra River@Little Yarra catchments, respectively. The streamflow changes caused by climate variability are similar to what one would expect based on the concept of streamflow elasticity to rainfall (Chiew Citation2006); see , rainfall changes of –19, –17 and 20 mm (–1.3, –1.0 and 1.4%) in the first 15 years post-bushfire period compared with the pre-bushfire period. As shown in and , the median values of the increase in streamflow due to bushfire change are 79, 143 and 33 (26, 34 and 11% of pre-bushfire streamflow), and the corresponding changes in streamflow due to climatic differences between the pre-bushfire and the first 15 years post-bushfire periods for the three catchments are 28, –36 and 3 mm (–9, –9 and 1% of pre-bushfire streamflow), respectively. The increase in streamflow in the first 15 years of post-bushfire period is mainly caused by reducing actual evapotranspiration and altered hydraulic properties of soil due to bushfire. The consistency in modelling results from the three models with substantially different model structures and conceptulizations provide confidence in the modelling results.
Fig. 7 Summary of bushfire impact on annual streamflow (in mm) from 1983 to the end year of streamflow record for the three catchments. White boxplots: 1983 to 1998; grey boxplots: 1999 to the end year of record. For each catchment, the three white/grey boxplots represent total streamflow (mm) change relative to the pre-bushfire period (horizontal line), bushfire impact on streamflow (mm) (without notch), climate change impact on streamflow (mm) (with notch), respectively.
Fig. 8 Summary of bushfire impact on annual streamflow (%) from 1983 to the end year of record for the three catchments. White boxplots: 1983 to 1998; grey boxplots: 1999 to the end year of record. For each catchment, the three white/grey boxplots represent total streamflow change (%) relative to pre-bushfire period (horizontal line), bushfire impact on streamflow (%) (without notch), and climate change impact on streamflow (%) (with notch), respectively.
The results for the post-1998 period (after 15 years post-bushfire) show that the impact of the 1983 bushfires on streamflow for the three catchments is smaller compared to that in the first 15 years after bushfire. For the Latrobe@Noojee, Starvation Creek and Yarra River@Little Yarra catchments, the total change in observed streamflow compared to the pre-bushfire period (ΔQtot) is –87, –101 and –86 mm, respectively, which represents about 29, 24 and 28% reduction in streamflow compared to the pre-bushfire period. For the post-1998 period, the reduction in streamflow due to climate variability is larger than that caused by the 1983 bushfire as the observed climate is significantly drier than in the pre-bushfire period (and slightly drier than the climate for the first 15 years post-bushfire) (). When averaged over the three models, the reductions in streamflow caused by climate variability for the three catchments are –91, –122 and –57 mm (–30, –29 and –19% of pre-bushfire streamflow). The three models show increases in streamflow due to bushfire for the Latrobe@Noojee and Starvation Creek catchments, but a mixed response to bushfire in the Yarra River@Little Yarra catchment. The AWRA-L and GR4J models show reductions of –25 and –29 mm (–8.4 and –9.5% of pre-bushfire period) in streamflow, while the XAJ model shows an increase of 8 mm (2.7% of pre-bushfire period). The XAJ model is specifically developed for humid and semi-humid catchments (Zhao et al. Citation1980, Ren-Jun Citation1992) and so the difference between the XAJ and AWRA-L and GR4J models is partially due to the transposability of model parameters from wet to dry periods for the XAJ model (as discussed in Section 4.5). When averaged over the three models, the values of streamflow change caused by bushfire compared to pre-bushfire period for the three catchments are 27, 32 and –15 mm (9.0, 7.7 and –5.1% of pre-bushfire streamflow), respectively. As shown in and , the median increase in streamflow due to vegetation cover change is 30, 27 and –25 mm (10, 7 and –8%), respectively, and the corresponding changes in streamflow caused by climatic differences between the pre-bushfire and after 15 years post-bushfire periods for the three catchments are –117, –129 and –60 mm (–39, –31 and –20% of pre-bushfire streamflow). The consistency in the modelling results from the three models suggests that the impact of climate variability on streamflow is much larger than that caused by bushfire.
4.4 Comparisons between different models
The box-and-whisker plots in and show the change in streamflow in the two periods (the first 15 years after the 1983 bushfires and after 15 years post-bushfire) estimated by the three hydrological models (AWRA-L, XAJ and GR4J) for the three catchments (Latrobe@Noojee, Starvation Creek and Yarra River@Little Yarra) in mm and percentage change respectively. The horizontal line in each box shows the median of the modelling results over the three models, the upper and lower envelops show the 75th and 25th percentile values and the upper and lower whiskers show the 95th and 5th percentile values.
There are some differences in bushfire and climate variability impacts estimated by the three models for the three study catchments ( and ). The maximum difference between the modelling results during the first 15 years due to bushfire for the three models is 29 mm (95–66 mm), 44 mm (155–110 mm) and 18 mm (38–20 mm) for the Latrobe@Noojee, Starvation Creek and Yarra River@Little Yarra catchments, respectively. This maximum difference is equivalent to 9.5, 10.7 and 5.9% relative to pre-bushfire period streamflow for the three catchments, respectively. After 15 years post-bushfire, the maximum difference between the modelling results for the three models is 43 mm (48 to 4 mm), 27 mm (48 to 21 mm) and 37 mm (8 to –29 mm), equivalent to 14.3, 6.6 and 12.2% relative to pre-bushfire period streamflow for the three catchments, respectively. The differences between the results from the three hydrological models can be attributed to differences in the conceptual complexity, structure, parameter numbers and transposability of model parameters. This is further discussed in Section 4.5.
All results from the three models show reasonable agreement with each other. In the first 15 years after bushfires (1983–1998), bushfire causes substantial increase in streamflow and its impact on streamflow are much larger than that of climate variability. Streamflow in the Starvation Creek catchment shows a much larger increase than that in the Latrobe@Noojee catchment, which in turn shows a larger increase than in the Yarra River@Little Yarra catchment. Streamflow seems to be inversely related to percentage of ash disturbance. The Yarra River@Little Yarra catchment, with the highest percentage of ash disturbance (), has the lowest increase in streamflow.
After 15 years post-bushfire, bushfire impacts on streamflow are negligible for the post-1999 period (after 15 years post-bushfire), when compared to the impacts in the first 15 years post-bushfire. During this period, there is a large reduction in streamflow due to substantial reduction in mean annual rainfall of 217, 221 and 150 mm (15.4, 13.6 and 10.2%) compared to the pre-bushfire period for the Latrobe@Noojee, Starvation Creek and Yarra River@Little Yarra catchments, respectively. The differences in the results from the three models are partially due to the uncertainties in hydrological model structure and parameterization.
4.5 Discussion
The applicability of hydrological modelling to quantify vegetation change and climate variability impacts on streamflow mainly depends on how the model parameters are calibrated and how they are transferred from calibration period to simulation period. It is important to investigate the transposability of model parameters in time (i.e. to make sure that their estimation is not dependent on climate characteristics of the calibration periods). This can provide us with a better understanding of uncertainty associated with using hydrological models for quantifying bushfire and climatic variability impacts on streamflow. To investigate the model transposability, four medium-size catchments close to the three study catchments shown in were selected. As shown in , the differences in B between the calibration period and the first validation period range between 0.01 and 0.06, and the differences in B between the calibration period and the second validation period range between 0.07 and 0.11. The slightly higher B values in the second validation period may be partly due to the larger climatic differences between the two periods (the 1999–2009 period is about 15% drier than the 1975–1982 period for these four catchments). This is in agreement with the findings of some recent studies, which indicate that there can be a reduction in model predictive capability when transferring calibrated model parameters from wet to dry periods (Vaze et al. Citation2010b, Merz et al. Citation2011, Coron et al. Citation2012). The modelling experiments carried out in this study suggest that the uncertainty of transferring model parameters from the calibration period to the first test period (the first 15 years post-bushfire) is very small (difference in B of 0.01–0.06) and it increases slightly when transferring the calibrated parameters from the calibration period to the second test period (after the first 15 years post-bushfire). The 0.01–0.06 changes in B from the calibration period to the first test period are much smaller than the impacts of the 1983 bushfire impact on streamflow, and the 0.07–0.11 changes in B from the calibration period to the second test period are also smaller than the climate variability impact on streamflow in the second period (). These results provide confidence in the climate variability and bushfire impact assessments based on hydrological modelling.
The hydrological modelling results for all the three study catchments indicate that there is a substantial increase in streamflow in the first 15 years after the 1983 bushfires that is not attributable to climate alone. An increase in streamflow in the early years is consistent with conceptual models of leaf area loss/ET decrease, as nearly 19–84% of the forest cover in the three catchments was burnt in the 1983 bushfires. However, we cannot be sure how much canopy area was affected due to lack of detailed information about the fire intensities for the 1983 bushfire. The Bosch and Hewlett (Citation1982) review of forest cover change and streamflow found that streamflow response to cover changes of <20% of catchment area could not be verified statistically.
The only hypothesis that supports the persistence of such increases after the first 3–5 years is disturbance by subsequent logging activities ((IV)), which almost doubles the fire kill area for the Latrobe and Yarra catchments, and results in the largest area of ash disturbance at Starvation Creek. Removal of more ash through logging effectively increases the fire mortality and consequently magnifies the hydrological effect. Given that there would be some soil moisture deficits, a lag in response to lowered ET is likely. However, the large streamflow increases for Starvation Creek that can be attributed to the fire appear to be highly disproportionate to the fire-related mortality area of only 3%, and even once logging begins at this catchment the response apportioned to vegetation change appears to be quite high for the area affected.
There are two issues that require consideration if we are to accept the modelling results as representative of real effects. Firstly, what processes could drive such large flow increase at Starvation Creek with a 3% mortality area, and secondly, how would the balance of disturbance/regrowth over two decades play out in streamflow changes for all catchments?
For Starvation Creek, the only plausible explanation for the early post-fire years is that there was a significant impact on the non-ash species that resulted in high canopy loss and low ET immediately after the fire. Rainfall in 1983 and 1984 was 1453 and 1541 mm, respectively (long-term SILO mean: 1565 mm), which means there was a significant supply of potential water for streamflow. The catchment received 979 mm of rainfall between the fire (16 February) and 30 September 1983. Little ET could be expected from burnt areas during this period. An increase of this magnitude is less than that measured by Lane et al. (Citation2006) for stands with almost complete canopy loss (but extensive alpine ash mortality). It is also consistent with early increases predicted and observed by Lane et al. (Citation2010) using physically-based modelling for the 1533-km2 Mitta Mitta catchment after the 2003 fires. Further, the dry period that preceded the Ash Wednesday fire was relatively short (rainfall in 1981 was 1515 mm and in 1982 it was 1243 mm), suggesting that soil moisture deficits were not extreme.
There is current unpublished research into the ecohydrology of recovering mixed species eucalypt stands that suggests early post-fire water use may vary as a function of fire severity (Nolan et al. Citation2014). Moderate burns appear to produce higher water use once seedling recruitment and leaf area recovery begins. Conversely, severe burns may retard the re-development of canopy for some years, leading to lower water use for a few years. If the fire was severe at Starvation Creek then it could drive the flow increases at Starvation Creek after 1984, but it also may be that the post-fire rainfall (almost 1000 mm) recharged deep stores that fed the streamflow for some years. The low ash mortality also means there would be little effect in subsequent years of high water-using regrowth with an origin in 1983 or 1984. This may in part explain the scale of flow increases in the late 1990s.
The water gain/loss over time is the balance between lower and higher rates of ET relative to the pre-disturbance values as the ash stands recover. The conceptual model for ash ET is a decrease for 1–5 years followed by an increase until age 25–30, then a return toward equilibrium rates over many decades. The fire disturbance followed by logging would result in different areas of the catchments being in varying states of ET. It is notable that the three models show either flow decreases or (for Latrobe) a very small increase for the post-1998 period. This accords (at least relatively) with a trend toward high water use in the latter part of the record. However, the modelling suggests in some instances that the streamflow changes are due to climate rather than vegetation dynamics.
There is a background vegetation–hydrologic dynamic that may or may not have been dealt with by the calibration. The ash stands that were not subject to fire or logging are ageing, and according to the Kuczera and Watson curves, are on a trajectory of increasing streamflow. Over the period of interest (1983–2000, 2004, 2007) we could expect flow increases of the order of 4% for 1983–1998 for the Latrobe and Yarra catchments, and 8% for Starvation Creek from the remaining ash stands, plus further increases for the post-1998 period. It could be argued that the good calibration results reflect the models’ ability to deal with this issue. If this is not the case then some of the flow increases may have been inflated in the first post-fire period, and perhaps decreases masked subsequently.
Finally, the other fire-related hydrological processes that should be considered in modelling are changes to soil hydraulic properties and consequent runoff generation. Increases in surface runoff generation after fire have been widely reported in the literature (e.g. White and Wells Citation1979, Prosser and Williams Citation1998, Robichaud Citation2000, Benavides-Solorio and MacDonald Citation2001, Johanson et al. Citation2001, Moody and Martin Citation2001, Onda et al. Citation2008). Development or enhancement of water repellency (e.g. Shakesby et al. Citation1993, Doerr et al. Citation2000, Robichaud Citation2000, Martin and Moody Citation2001), the effect of ash on infiltration (Campbell et al. Citation1977, Cerdà and Doerr Citation2008, Onda et al. Citation2008, Woods and Balfour Citation2010, Ebel et al. Citation2012), or loss of roughness/detention storage from plant immolation (e.g. Lavee et al. Citation1995, Scott Citation1997, Inbar et al. Citation1998) have been invoked as the agent driving the process change. The implication is that water is more efficiently routed to the stream network via infiltration-excess overland flow, and that peak flows in particular may increase markedly (e.g. Campbell et al. Citation1977, Scott Citation1993, Moody and Martin Citation2001, Moody et al. Citation2009, Soulis et al. Citation2012). Some of these runoff generation studies have been at plot or small experimental catchment scales, where scale effects may not be captured.
Recent studies into post-fire soil hydraulic responses to fire in similar environments to the wet eucalypt catchments modelled here (Lane et al. Citation2004, Citation2006, Sheridan et al. Citation2007, Nyman et al. Citation2010) have found that, although there is enhancement of water repellency (which is naturally occurring in summer) and generation of surface runoff, this does not translate into broadscale overland flow. The principal reason is the spatial heterogeneity in infiltration properties mainly controlled by macropore distribution and their suction characteristics (Nyman et al. Citation2010). As the background hydraulic conductivities can be in the order of metres per day, small patches of non-repellent soil can capture any generated flow. Lane et al. (Citation2006) found all flow percentiles increased after fire, but no evidence of altered runoff generation processes. The net result is that it is unlikely these soil factors are important for streamflow analysis on an annual scale in the modelled catchments. However it is emerging that soils in drier eucalypt forests may respond differently (Nyman et al. Citation2011).
The streamflow response to bushfire for the first 15 years, shown in –, is not as large as expected (Cornish and Vertessy Citation2001, Lane et al. Citation2010, Soulis et al. Citation2012). First, the interaction of vegetation dynamic and hydrological response may or may not be considered in the calibration. Second, hydrological response to bushfire is greatly related to fire severity. The more severely the catchments are burnt, the more significantly the vegetation and soil properties are disturbed. The severe destruction of vegetation cover can reduce catchment evapotranspiration rates in early post-bushfire period and changes in soil properties affect runoff generation mechanism (Scott et al. Citation1998). As discussed previously, we are not sure about the fire severity and the quantity of direct bushfire impact on streamflow using rainfall–runoff modelling. All of these factors contribute uncertainties to explain the modelling results.
The lumped hydrological modelling approach used here has advantages, compared to simple statistical methods or paired catchment study. The simple statistical methods provide the estimates for mean annual level impact but in reality for catchments like the ones used in this study, we (catchment managers) need to know not only the mean annual impact but also the impact on salient flow characteristics. The catchments used here are important water supply catchments for Melbourne. This can be only achieved with a daily or monthly model such as the ones used in this study. The paired study catchments are normally relatively small catchments which are really useful for understanding the change in processes with plantations going in or getting cleared. The response at the scale of the catchment we have modelled is in reality quite different to those small catchments and that is the main reason we need a methodology like that presented herein to address practical on-ground issues faced by water managers.
Overall, the modelling results are plausible from a process perspective for the Latrobe and Yarra catchments, but explaining the large effect at Starvation Creek is contingent on significant (and unknown) loss of canopy from non-ash species. Generalizing these results for bushfire impacts is difficult. As stated, the lack of information on fire severity and canopy loss is limited for this fire event, so the exact vegetation impact is not known. There were two quite distinct patterns of rainfall over the period of interest, with a relatively wet period coinciding with the first analysis period (1983–1998) followed by a sequence of dry years. Finally, the issue of soil moisture deficits at the time of the fire and the subsequent rainfall in the next 6–9 months before significant vegetation recovery is likely to be a large lever on flow responses.
5 CONCLUSIONS
Forested catchments provide most of the surface water for natural environmental and human water uses in southeast Australia. However, streamflow generated from these catchments is not only affected by climatic variability, but also by vegetation cover change such as severe bushfires. This study uses three lumped hydrological models to separate and quantify the relative impacts of bushfire and climate variability on streamflow from three southeast Australian catchments where Ash Wednesday bushfires occurred in February 1983. The three hydrological models show reasonably consistent estimates of bushfire and climate impacts on streamflow for the three catchments. The modelling results suggest that there is a substantial increase in streamflow in the first 15 years after the 1983 bushfires that could not be accounted for by climate effects. The increase in streamflow is attributed to initial decreases in evapotranspiration and soil infiltration rates resulting from the fires, followed by logging activity. After 15 years, streamflow dynamics are more heavily influenced by climate effects, although some impact from fire and logging regeneration may still occur.
The hydrological modelling method used in this study has advantages compared to simple statistical methods that provide the estimates for mean annual level impact only. The hydrological modelling method can provide not only the mean annual impact, but also the impact on salient flow characteristics. One weak point of the hydrological modelling method is that uncertainties arise from: transferring the model parameters from calibration to test periods, imprecise knowledge on fire severity and associated impact on non-ash species, the interplay of fire recovery, logging effects and a background vegetation–flow dynamic in these forests, and from distinct climate regimes over the period of the study. However the modelling has produced some interesting insights into fire and logging effects in southestern Australian forests.
Disclosure statement
No potential conflict of interest was reported by the author(s).
Acknowledgements
The authors would like to thank Andrew Davidson, Jorge Pena Arancibia, two anonymous reviewers and the editor for their useful comments and suggestions.
Additional information
Funding
REFERENCES
- Andréassian, V., et al., 2006. Introduction and synethsis: Why should hydrologists work on a large number of basin data sets? In: V. Andréassian et al., eds., Large sample basin experiments for hydrological model parameterization: Results of the Model Parameter Experiment (MOPEX), Paris. Wallingford: International Association of Hydrological Sciences, IAHS publication no. 307, 1–5.
- Benavides-Solorio, J. and MacDonald, L.H., 2001. Post-fire runoff and erosion from simulated rainfall on small plots, Colorado Front Range. Hydrological Processes, 15, 2931–2952. doi:10.1002/hyp.383
- Benyon, R.B. and Lane, P.N.J., 2013. Ground and satellite-based assessments of wet eucalypt forest survival and regeneration for predicting long-term hydrological responses to a large wildfire For. Forest Ecology and Management, 294, 197–207. doi:10.1016/j.foreco.2012.04.003
- Beven, K., 1989. Changing ideas in hydrology – the case of physically-based models. Journal of Hydrology, 105, 157–172. doi:10.1016/0022-1694(89)90101-7
- Bosch, J.M. and Hewlett, J.D., 1982. A review of catchment experiments to determine the effect of vegetation changes on water yield and evapotranspiration. Journal of Hydrology, 55, 3–23. doi:10.1016/0022-1694(82)90117-2
- Brown, J.A.H., 1972. Hydrologic effects of a bushfire in a catchment in south-eastern New South Wales. Journal of Hydrology, 15, 77–96. doi:10.1016/0022-1694(72)90077-7
- Buckley, T.N., et al., 2012. Differences in water use between mature and post-fire regrowth stands of subalpine Eucalyptus delegatensis R. Baker. Forest Ecology and Management, 270, 1–10. doi:10.1016/j.foreco.2012.01.008
- Campbell, R.E., et al., 1977. Wildfire effects on a Ponderosa Pine ecosystem: An Arizona case study. USDA Forest Service Research Paper RM-191, USDA for. Serv. Rocky Mountains Forest and Range Experiment Station, Fort Collins, Colorado.
- Cerdà, A. and Doerr, S.H., 2008. The effect of ash and needle cover on surface runoff and erosion in the immediate post-fire period. Catena, 74, 256–263. doi:10.1016/j.catena.2008.03.010
- Chau, K.W., 2006. Particle swarm optimization training algorithm for ANNs in stage prediction of Shing Mun River. Journal of Hydrology, 329, 363–367. doi:10.1016/j.jhydrol.2006.02.025
- Cheng, C.T., Ou, C.P., and Chau, K.W., 2002. Combining a fuzzy optimal model with a genetic algorithm to solve multi-objective rainfall–runoff model calibration. Journal of Hydrology, 268 (1–4), 72–86. doi:10.1016/S0022-1694(02)00122-1
- Chiew, F.H.S., 2006. Estimation of rainfall elasticity of streamflow in Australia. Hydrological Sciences Journal, 51, 613–625. doi:10.1623/hysj.51.4.613
- Christensen, P.E., Recher, H.F., and Hoare, J., 1981. Responses of open forests (dry sclerophyll forests) to fire regimes. In: A.M. Gill, R.H. Groves and I.R. Noble. Fire and the Australian Biota. Canberra: Australian Academy of Science, 367–393.
- Cornish, P.M., 1993. The effects of logging and forest regeneration on water yields in a moist eucalypt forest in New South Wales, Australia. Journal of Hydrology, 150, 301–322. doi:10.1016/0022-1694(93)90114-O
- Cornish, P.M. and Vertessy, R.A., 2001. Forest age-induced changes in evapotranspiration and water yield in a eucalypt forest. Journal of Hydrology, 242, 43–63. doi:10.1016/S0022-1694(00)00384-X
- Coron, L., et al., 2012. Crash testing hydrological models in contrasted climate conditions: an experiment on 216 Australian catchments. Water Resources Research, 48, W05552. doi:10.1029/2011WR011721
- Dam, J.C., 1999. Impacts of climate change and variability on hydrological regimes. Cambridge: Cambridge University Press.
- Davis, S.H., Vertessy, R.A., and Silberstein, R.P., 1999. The sensitivity of a catchment model to soil hydraulic properties obtained by using different measurement techniques. Hydrological Processes, 13, 677–688. doi:10.1002/(SICI)1099-1085(19990415)13:5<677::AID-HYP772>3.0.CO;2-N
- DeBano, L.F., 2000. The role of fire and soil heating on water repellency in wildland environments: a review. Journal of Hydrology, 231–232, 195–206. doi:10.1016/S0022-1694(00)00194-3
- Doerr, S.H., Shakesby, R.A., and Walsh, R.P.D., 2000. Soil water repellency: its causes, characteristics and hydro-geomorphological significance. Earth Science Reviews, 51, 33–65.
- Ebel, B.A., Moody, J.A., and Martin, D.A., 2012. Hydrologic conditions controlling runoff generation immediately after wildfire. Water Resources Research, 48, W03529. doi:10.1029/2011WR011470
- Eberhart, R.C. and Kennedy, J., 1995. A new optimizer using particle swarm theory. In: Sixth international symposium on micro machine and human science, Nagoya Municipal Industrial Research Institute, Nagoya, October 4–6, 39–43.
- Feikema, P.M., Sherwin, C.B., and Lane, P.N.J., 2013. Influence of climate, fire severity and forest mortality on predictions of long term streamflow: potential effect of the 2009 wildfire on Melbourne’s water supply catchments. Journal of Hydrology, 488, 1–16. doi:10.1016/j.jhydrol.2013.02.001
- Gharun, M., Turnbull, T.T., and Adams, M.A., 2013. Stand water use status in relation to fire in a mixed species eucalypt forest. Forest Ecology and Management, 304, 162–170. doi:10.1016/j.foreco.2013.05.002
- Gill, A.M., 1995. Stems and fires. Plant Stems. Physiology and Functional Morphology. B. Gartner. San Diego, CA: Academic Press, 323–342.
- Gill, M.K., et al., 2006. Multiobjective particle swarm optimization for parameter estimation in hydrology. Water Resources Research, 42, W07417. doi:10.1029/2005WR004528
- Haydon, S.R., Benyon, R.G., and Lewis, R., 1997. Variation in sapwood area and throughfall with forest age in mountain ash (Eucalyptus regnans F. Muell.). Journal of Hydrology, 187, 351–366. doi:10.1016/S0022-1694(96)03016-8
- Helvey, J.D., 1980. Effects of a north central Washington wildfire on runoff and sediment production. Journal of the American Water Resources Association, 16, 627–634. doi:10.1111/j.1752-1688.1980.tb02441.x
- Inbar, M., Tamir, M., and Wittenberg, L., 1998. Runoff and erosion processes after a forest fire in Mount Carmel, a Mediterranean area. Geomorphology, 24, 17–33. doi:10.1016/S0169-555X(97)00098-6
- Jayawardena, A.W. and Zhou, M.C., 2000. A modified spatial soil moisture storage capacity distribution curve for the Xinanjiang model. Journal of Hydrology, 227 (1–4), 93–113. doi:10.1016/S0022-1694(99)00173-0
- Jeffrey, S.J., et al., 2001. Using spatial interpolation to construct a comprehensive archive of Australian climate data. Environmental Modelling & Software, 16 (4), 309–330. doi:10.1016/S1364-8152(01)00008-1
- Johansen, M.P., Hakonson, T.E., and Breshears, D.D., 2001. Post – fire runoff and erosion from rainfall simulation: contrasting forests with shrublands and grasslands. Hydrological Processes, 15, 2953–2965. doi:10.1002/hyp.384
- Kiem, A.S. and Franks, S.W., 2001. On the identification of ENSO-induced rainfall and runoff variability: a comparison of methods and indices. Hydrological Sciences Journal, 46, 715–727. doi:10.1080/02626660109492866
- Kuczera, G.A., 1987. Prediction of water yield reductions following a bushfire in ash-mixed species eucalypt forest. Journal of Hydrology, 94, 215–236. doi:10.1016/0022-1694(87)90054-0
- Lane, P.N.J., Croke, J.C., and Dignan, P., 2004. Runoff generation from logged and burnt convergent hillslopes: rainfall simulation and modelling. Hydrological Processes, 18, 879–892. doi:10.1002/hyp.1316
- Lane, P.N.J., et al., 2005. The response of flow duration curves to afforestation. Journal of Hydrology, 310, 253–265. doi:10.1016/j.jhydrol.2005.01.006
- Lane, P.N.J., et al., 2010. Modelling the long term water yield impact of wildfire and other forest disturbance in Eucalypt forests. Environmental Modelling & Software, 25, 467–478. doi:10.1016/j.envsoft.2009.11.001
- Lane, P.N.J., et al., 2012. Fire effects on forest hydrology: lessons from a multi-scale catchment experiment in SE Australia. In: A.A. Webb et al., eds. Revisiting experimental catchment studies in forest hydrology. Wallingford: International Association of Hydrological Sciences, IAHS publication no. 353, 137–143.
- Lane, P.N.J., Sheridan, G.J., and Noske, P.J., 2006. Changes in sediment loads and discharge from small mountain catchments following wildfire in south eastern Australia. Journal of Hydrology, 331, 495–510. doi:10.1016/j.jhydrol.2006.05.035
- Langford, K.J., 1976. Change in yield of water following a bushfire in a forest of eucalyptus regnans. Journal of Hydrology, 29, 87–114. doi:10.1016/0022-1694(76)90007-X
- Lavee, H., et al., 1995. Effect of surface roughness on runoff and erosion in a Mediterranean ecosystem: the role of fire. Geomorphology, 11 (3), 227–234. doi:10.1016/0169-555X(94)00059-Z
- Lerat, J., et al., 2012. Do internal flow measurements improve the calibration of rainfall–runoff models? Water Resources Research, 48, W02511. doi:10.1029/2010WR010179
- Li, L.J., et al., 2007. Assessing the impact of climate variability and human activities on streamflow from the Wuding River basin in China. Hydrological Processes, 21, 3485–3491. doi:10.1002/hyp.6485
- Li, Z., et al., 2009. Impacts of land use change and climate variability on hydrology in an agricultural catchment on the Loess Plateau of China. Journal of Hydrology, 377 (1–2), 35–42. doi:10.1016/j.jhydrol.2009.08.007
- Li, H.Y., et al., 2012. Separating effects of vegetation change and climate variability using hydrological modelling and sensitivity-based approaches. Journal of Hydrology, 420–421, 403–418. doi:10.1016/j.jhydrol.2011.12.033
- Mannik, R.D., et al., 2009. Estimating the change in streamflow resulting from the 2003 and 2006/07 bushfires in south eastern Australia. In: Proceedings of the 32nd hydrology and sater resources symposium. Newcastle, 30 November–3 December, 1666–1677.
- Martin, D.A. and Moody, J.A., 2001. Comparison of soil infiltration rates in burned and unburned mountainous watersheds. Hydrological Processes, 15 (15), 2893–2903. doi:10.1002/hyp.380
- Mataix-Solera, J., et al., 2002. Soil organic matter and aggregates affected by wildfire in a Pinus halepensis forest in a Mediterranean environment. International Journal of Wildland Fire, 11, 107–114. doi:10.1071/WF02020
- Mataix-Solera, J., et al., 2011. Fire effects on soil aggregation: a review. Earth-Science Reviews, 109, 44–60. doi:10.1016/j.earscirev.2011.08.002
- Merz, R., Parajka, J., and Blöschl, G., 2011. Time stability of catchment model parameters: implications for climate impact analyses. Water Resources Research, 47, W02531. doi:10.1029/2010WR009505
- Moody, J.A. and Martin, D.A., 2001. Post-fire, rainfall intensity–peak discharge relations for three mountainous watersheds in the western USA. Hydrological Processes, 15, 2981–2993. doi:10.1002/hyp.386
- Moody, J.A., Kinner, D.A., and Úbeda, X., 2009. Linking hydraulic properties of fire affected soils to infiltration and water repellency. Journal of Hydrology, 379, 291–303. doi:10.1016/j.jhydrol.2009.10.015
- Morton, F.I., 1983. Operational estimates of areal evapo-transpiration and their significance to the science and practice of hydrology. Journal of Hydrology, 66 (1–4), 1–76. doi:10.1016/0022-1694(83)90177-4
- Nangia, V., Mulla, D.J., and Gowda, P.H., 2010. Precipitation changes impact stream discharge, nitrate–nitrogen load more than agricultural management changes. Journal of Environmental Quality, 39, 2063–2071. doi:10.2134/jeq2010.0105
- Nash, J.E. and Sutcliffe, J.V., 1970. River flow forecasting through conceptual models part I - a discussion of principles. Journal of Hydrology, 10 (3), 282–290. doi:10.1016/0022-1694(70)90255-6
- Nolan, R.H., et al., 2014. Changes in evapotranspiration following wildfire in resprouting eucalypt forests. Ecohydrology, 7, 1363–1377. doi:10.1002/eco.1463
- Nyman, P., et al., 2011. Evidence of debris flow occurrence after wildfire in upland catchments of south east Australia. Geomorphology, 125, 383–401. doi:10.1016/j.geomorph.2010.10.016
- Nyman, P., Sheridan, G.J., and Lane, P.N.J., 2010. Synergistic effects of water repellency and macropore flow on the hydraulic conductivity of a burned forest soil, south-east Australia. Hydrological Processes, 24, 2871–2887. doi:10.1002/hyp.7701
- Onda, Y., Dietrich, W.E., and Booker, F., 2008. Evolution of overland flow after a severe forest fire, Point Reyes, California. Catena, 72, 13–20. doi:10.1016/j.catena.2007.02.003
- Perrin, C., Michel, C., and Andréassian, V., 2003. Improvement of a parsimonious model for streamflow simulation. Journal of Hydrology, 279, 275–289. doi:10.1016/S0022-1694(03)00225-7
- Post, D.A. and Jakeman, A.J., 1996. Relationships between catchment attributes and hydrological response characteristics in small Australian mountain ash catchments. Hydrological Processes, 10, 877–892. doi:10.1002/(SICI)1099-1085(199606)10:6<877::AID-HYP377>3.0.CO;2-T
- Prosser, I.P. and Williams, L., 1998. The effect of wildfire on runoff and erosion in native Eucalyptus forest. Hydrological Processes, 12, 251–265. doi:10.1002/(SICI)1099-1085(199802)12:2<251::AID-HYP574>3.0.CO;2-4
- Purdie, R.W. and Slatyer, R.O., 1976. Vegetation succession after fire in sclerophyll woodland communities in south-eastern Australia. Austral Ecology, 1 (4), 223–236. doi:10.1111/j.1442-9993.1976.tb01111.x
- Refsgaard, J.C. and Henriksen, H.J., 2004. Modelling guidelines—terminology and guiding principles. Advances in Water Resources, 27, 71–82. doi:10.1016/j.advwatres.2003.08.006
- Ren-Jun, Z., 1992. The Xinanjiang model applied in China. Journal of Hydrology, 135 (1–4), 371–381. doi:10.1016/0022-1694(92)90096-E
- Robichaud, P.R., 2000. Fire effects on infiltration rates after prescribed fire in Northern Rocky Mountain forests, USA. Journal of Hydrology, 231–232, 220–229. doi:10.1016/S0022-1694(00)00196-7
- Scott, D.F., 1993. The hydrological effects of fire in South African mountain catchments. Journal of Hydrology, 150, 409–432. doi:10.1016/0022-1694(93)90119-T
- Scott, D.F., 1997. The contrasting effects of wildfire and clearfelling on the hydrology of a small catchment. Hydrological Processes, 11, 543–555. doi:10.1002/(SICI)1099-1085(199705)11:6<543::AID-HYP474>3.0.CO;2-J
- Scott, D.F., Versfeld, D.B., and Lesch, W., 1998. Erosion and sediment yield in relation to afforestation and fire in the mountains of the Western Cape Province, South Africa. South African Geographical Journal, 80, 52–59. doi:10.1080/03736245.1998.9713644
- Shakesby, R.A. and Doerr, S.H., 2006. Wildfire as a hydrological and geomorphological agent. Earth-Science Reviews, 74, 269–307. doi:10.1016/j.earscirev.2005.10.006
- Shakesby, R.A., et al., 1993. Wildfire impacts on soil erosion and hydrology in wet Mediterranean forest, Portugal. International Journal of Wildland Fire, 3 (2), 95–110. doi:10.1071/WF9930095
- Sheridan, G.J., Lane, P.N.J., and Noske, P.J., 2007. Quantification of hillslope runoff and erosion processes before and after wildfire in a wet Eucalyptus forest. Journal of Hydrology, 343, 12–28. doi:10.1016/j.jhydrol.2007.06.005
- Smith, H.G., et al., 2011. Wildfire and salvage harvesting effects on runoff generation and sediment exports from radiata pine and eucalypt forest catchments, south-eastern Australia. Forest Ecology and Management, 261 (3), 570–581. doi:10.1016/j.foreco.2010.11.009
- Soulis, K.X., Dercas, N., and Valiantzas, J.D., 2012. Wildfires impact on hydrological response – the case of Lykorrema experimental watershed. Global NEST Journal, 14 (3), 303–310.
- Stone, R. and Auliciems, A., 1992. SOI phase relationships with rainfall in eastern Australia. International Journal of Climatology, 12, 625–636. doi:10.1002/joc.3370120608
- Tan, K.S., Flower, D.J.M., and Flower, D.M., 2011. An event runoff coefficient approach for assessing changes in short-term catchment runoff following bushfires. In: Proceedings of the 33rd hydrology and water resources symposium, Brisbane, 26 June–1 July, 1522–1529.
- Tomer, M.D. and Schilling, K.E., 2009. A simple approach to distinguish land-use and climate-change effects on watershed hydrology. Journal of Hydrology, 376 (1–2), 24–33. doi:10.1016/j.jhydrol.2009.07.029
- Tuteja, N.K., et al., 2007. Partitioning the effects of pine plantations and climate variability on runoff from a large catchment in southeastern Australia. Water Resources Research, 43, W08415. doi:10.1029/2006WR005016
- Van Dijk, A.I.J.M., 2010. The Australian Water Resources Assessment System. Technical Report 3. Landscape Model (version 0.5) Technical Description. CSIRO, Canberra.
- Vaze, J., et al., 2004. Modelling the effects of landuse change on water and salt delivery from a catchment affected by dryland salinity in south-east Australia. Hydrological Processes, 18, 1613–1637. doi:10.1002/hyp.1409
- Vaze, J., et al., 2009. Development and implementation of a generic pasture growth model (CLASS PGM). Environmental Modelling and Software, 24 (1), 107–114. doi:10.1016/j.envsoft.2008.06.003
- Vaze, J., et al., 2010a. Rainfall–runoff modelling across southeast Australia: datasets, models and results. Australian Journal of Water Resources, 14 (2), 101–116.
- Vaze, J., et al., 2010b. Climate non-stationarity—validity of calibrated rainfall–runoff models for use in climate change studies. Journal of Hydrology, 394, 447–457. doi:10.1016/j.jhydrol.2010.09.018
- Vaze, J., et al., 2011a. Impact of climate change on water availability in the Macquarie-Castlereagh River basin in Australia. Hydrological Processes, 25 (16), 2597–2612. doi:10.1002/hyp.8030
- Vaze, J., et al., 2011b. Conceptual rainfall–runoff model performance with different spatial rainfall inputs. Journal of Hydrometeorology, 12 (5), 1100–1112. doi:10.1175/2011JHM1340.1
- Vaze, J., et al., 2012. Guidelines for rainfall–runoff modeling: towards best practice model application. Bruce: eWater Cooperative Research Centre.
- Vaze, J., et al., 2013a. The Australian Water Resource Assessment System (AWRA). In: 20th MODSIM congress [online], 1–6 December, Adelaide. Available from: http://mssanz.org.au/modsim13 [Accessed 30 March 2014].
- Vaze, J., et al., 2013b. Regional calibration against multiple data sources to predict streamflow. In: E. Boegh et al., eds., Climate and land surface changes in hydrology. Proceedings of H01, IAHS-IAPSO-IASPEI Assembly, Gothenburg, Sweden, July 2013. Wallingford: International Association of Hydrological Sciences, IAHS publication no. 359, 165–170.
- Vaze, J. and Teng, J., 2011. Future climate and runoff projections across New South Wales, Australia: results and practical applications. Hydrological Processes, 25 (1), 18–35. doi:10.1002/hyp.7812
- Verdon-Kidd, D.C. and Kiem, A.S., 2009. Nature and causes of protracted droughts in southeast Australia: comparison between the Federation, WWII, and Big Dry droughts. Geophysical Research Letters, 36, L22707. doi:10.1029/2009GL041067
- Vertessy, R.A., et al., 1993. Predicting water yield from a mountain ash forest catchment using a terrain analysis based catchment model. Journal of Hydrology, 150 (2), 665–700.
- Vertessy, R.A., et al., 1995. Relationships between stem diameter, sapwood area, leaf area and transpiration in a young mountain ash forest. Tree Physiology, 15, 559–567. doi:10.1093/treephys/15.9.559
- Vertessy, R.A., et al., 1996. Long-term growth and water balance predictions for a mountain ash (Eucalyptus regnans) forest catchment subject to clear-felling and regeneration. Tree Physiology, 16, 221–232. doi:10.1093/treephys/16.1-2.221
- Vertessy, R.A., Watson, F.G.R., and O′Sullivan, S.K., 2001. Factors determining relations between stand age and catchment water balance in mountain ash forests. Forest Ecology and Management, 143, 13–26. doi:10.1016/S0378-1127(00)00501-6
- Viney, N.R., et al., 2009. The usefulness of bias constraints in model calibration for regionalisation to ungauged catchments. In: 18th World IMACS/MODSIM congress, Cairns, 13–17 July, 3421–3427.
- Vivian, L.M., et al., 2008. Influence of fire severity on the regeneration, recruitment and distribution of eucalypts in the Cotter River Catchment, Australian Capital Territory. Austral Ecology, 33 (1), 55–67. doi:10.1111/j.1442-9993.2007.01790.x
- Watson, F.G.R., Vertessy, R.A., and Grayson, R.B., 1999a. Large-scale modelling of forest hydrological processes and their long-term effect on water yield. Hydrological Processes, 13, 689–700. doi:10.1002/(SICI)1099-1085(19990415)13:5<689::AID-HYP773>3.0.CO;2-D
- Watson, F.G.R., et al., 1999b. The hydrologic impact of forestry on the Maroondah catchments. Cooperative Research Centre for Catchment Hydrology Technical Report 99/1.
- White, W.D. and Wells, S.G., 1979. Forest-fire devegetation and drainage basin adjustments in mountainous terrain. In: D.D. Rhodes and G.P. Williams, eds. Adjustments of the fluvial system, proceedings of the tenth annual geomorphology symposium, Binghamton, NY, 21–22 September. Dubuque, IA: Kendall/Hunt, 199–223.
- Woods, S.W. and Balfour, V.N., 2010. The effects of soil texture and ash thickness on the post-fire hydrological response from ash covered soils. Journal of Hydrology, 393, 274–286. doi:10.1016/j.jhydrol.2010.08.025
- Zhang, Y.Q. and Chiew, F.H.S., 2009. Relative merits of different methods for runoff predictions in ungauged catchments. Water Resources Research, 45, W07412. doi:10.1029/2008WR007504
- Zhao, R.J., et al., 1980. The Xinanjiang model. In: Hydrological forecasting: Oxford symposium 1980. Wallingford,: International Association of Hydrological Sciences, IAHS publication no. 129, 351–356.