
ABSTRACT
This work aimed to evaluate the capability of modelled vs in situ soil moisture observations in the northwest of Spain for a period of four years (2010–2013) in order to validate the SMOS L2 product. Comparisons were performed for a set of representative stations of the Soil Moisture Measurement Stations network of the University of Salamanca (REMEDHUS) at both point and area scales. The SMOS series showed good correlation with the modelled series, better than that obtained with the in situ observations (0.77 vs 0.68 average correlation coefficients). However, some underestimation or overestimation of the SMOS series, related to the soil characteristics, was observed with respect to both the in situ and the modelled series. The SMOS data normalization produced a notable improvement in the results, highlighting the capability of the modelled data to validate the SMOS soil moisture series. This research provides a solid foundation for the future validation of SMOS at large scales, overcoming the spatial representativeness issues arising from the use of in situ point measurements.
Editor M.C. Acreman; Associate editor N. Verhoest
1 Introduction
Soil moisture controls a variety of hydro-meteorological and environmental processes. Knowledge of soil moisture during long periods over large areas helps to improve the forecasting of precipitation, droughts and floods as well as climate projections and predictions. Information pertaining to the spatial and temporal variability of soil moisture is key in supporting decisions on the management of water resources and helps to improve parameterizations for agricultural, hydrological and meteorological modelling processes.
Important issues in the understanding of soil moisture behaviour are related to the spatial scale and the spatial-temporal variability of soil moisture, which is controlled by a large set of interrelated factors such as climate, topography, soil properties, land use and vegetation (Vinnikov et al. Citation1996).
The main approaches to studying surface soil moisture use ground-based observations, remote sensing (frequently used in large-scale studies) and modelling. Despite significant efforts throughout the world to establish a large number of networks, from the local to the regional scale (Dorigo et al. Citation2011), spatial and temporal coverage and density are frequently not adequate to represent the spatial distribution of soil moisture over large areas and long periods (Crow et al. Citation2012, Wanders et al. Citation2012, Gruber et al. Citation2013, Ochsner et al. Citation2013). Despite these limitations, ground-based measurements are necessary for studying the spatial and temporal dynamics of soil moisture and also for the calibration and validation of modelled and satellite data (i.e. Martínez-Fernández and Ceballos Citation2005, De Rosnay et al. Citation2006, Robinson et al. Citation2008, Albergel et al. Citation2012, Tavakoli and De Smedt Citation2013, Vereecken et al. Citation2013, Brocca et al. Citation2014, Chen et al. Citation2014).
Remote-sensing techniques are considered a potential alternative for the monitoring of surface soil moisture in large-scale applications (Schmugge et al. Citation2002, Moran et al. Citation2004, Wigneron et al. Citation2004, Wagner et al. Citation2007). In particular, remote-sensing systems operating at low microwave frequencies have proven to be useful for the accurate estimation of surface soil moisture because they are less affected by atmospheric conditions and their penetration depth in soil and vegetation is larger than those operating at higher microwave frequencies (Wigneron et al. Citation2007).
Of the L-band microwave missions, the first satellite focused primarily on the retrieval of soil moisture was the Soil Moisture and Ocean Salinity (SMOS), launched in 2009 (Kerr et al. Citation2012). SMOS is a sun-synchronous orbiting satellite that observes the Earth’s surface in the L-band frequency (1.41 GHz) and offers global coverage with a spatial resolution of approximately 40 km and a revisit time of about 3 days. The interferometric technology of the Microwave Imaging Radiometer with Aperture Synthesis (MIRAS) on board SMOS includes multi-angular viewing and full-polarimetric capabilities, provides brightness temperature measurements of the soil at different incidence angles, and shows good sensitivity to surface soil moisture variations, with an accuracy target of 0.04 m3 m−3 (Kerr et al. Citation2010).
Its capabilities notwithstanding, SMOS has some constraints. One of them is contamination of the L-band by radio-frequency interference (RFI), which has been detected in several areas around the world. In addition, common difficulties in obtaining accurate soil moisture retrievals arise from the presence of dense vegetation, snow cover and some land-surface characteristics (Kerr Citation2007).
Another important limitation of SMOS for monitoring soil moisture is related to its coarse spatial resolution and limited depth of observation (about 5 cm). The surface heterogeneity at the spatial resolution of SMOS and the significant differences in behaviour of different targets within a single footprint, together with the lack of sufficient soil moisture measurements within the area corresponding to the footprint, are currently considered the main issues that could cause bias and uncertainty in the soil moisture products (Loew Citation2008, Kerr et al. Citation2010, Collow et al. Citation2012, Dall’amico et al. Citation2012, Schlenz et al. Citation2012, Sánchez et al. Citation2012a, Gruber et al. Citation2013).
Despite these limitations, at present, the spatial-temporal coverage of SMOS could be very useful for large-scale hydrological applications (Wanders et al. Citation2014). However, it is necessary to provide a good estimate of the uncertainty of the remotely sensed soil moisture products (Wanders et al. Citation2012), and the validation of coarse-resolution SMOS data in different environmental conditions is a difficult task.
Several studies have had successful results using in situ data for SMOS validation (Albergel et al. Citation2012, Jackson et al. Citation2012, Sánchez et al. Citation2012a, Ford et al. Citation2014). However, some of them did not take into account the differences between the spatial resolutions of in situ and remote-sensing observations (Crow et al. Citation2012). In these studies, it was often assumed that in situ observations of soil moisture provide representative values at the footprint scale, but this is not always true (Crow et al. Citation2012, Wanders et al. Citation2012). Therefore, several evaluation techniques have been developed to overcome this problem (Crow and Zhan Citation2007, Scipal et al. Citation2008, Crow et al. Citation2010, Dorigo et al. Citation2010, Crow et al. Citation2012). Some of these caveats may be overcome by the new satellite mission from the National Aeronautics and Space Administration (NASA): Soil Moisture Active Passive (SMAP), operative since January 2015. SMAP will provide global soil moisture data with improved spatial resolution owing to its concurrent measurements from an L-band radiometer and an L-band radar operating as a single observation system.
The use of unsaturated zone models has been considered by several authors to evaluate the uncertainty of the remote-sensing products by matching the spatial scales of the models and the remotely sensed soil moisture products (Wagner et al. Citation2007, Rüdiger et al. Citation2009, Juglea et al. Citation2010, Brocca et al. Citation2011, Dall’amico et al. Citation2012, Rötzer et al. Citation2012, Citation2014, Wanders et al. Citation2012, Lacava et al. Citation2012a, Citation2012b, Al-Yaari et al. Citation2014). The use of these hydrological models represents a potential advantage because of their capability to represent spatial-temporal variations in meteorological forcing, soil parameters and unsaturated zone processes (Finke et al. Citation1996, De Lannoy et al. Citation2006). In these studies, soil moisture modelling provides long-term estimations useful in evaluating satellite spatial-temporal soil moisture dynamics.
The results of SMOS validation with modelled data have shown different degrees of success. Wanders et al. (Citation2012) successfully used a distributed unsaturated model as an effective tool to validate the SMOS product over Spain, but Dall’amico et al. (Citation2012) found some issues linked not only to uncertainties in the SMOS L2 product but also to the inaccuracy of the meteorological input data used in the model.
Brocca et al. (Citation2010, Citation2011) and Lacava et al. (Citation2012a, Citation2012b) highlighted the benefit of using a soil water balance model (Soil Water Balance Model Green-Ampt, SWBM-GA, Brocca et al. Citation2008) to validate soil moisture from active and passive microwave remote sensors (ASCAT, AMSR-E and SMOS) in different parts of Europe. The integration of in situ measurements and model data improves the assessment of the accuracy of the SMOS soil moisture product because it reduces the impact of ground data uncertainties as well as forcing data and model parameters (Lacava et al. Citation2012a).
One important issue in the validation of SMOS soil moisture using modelled and in situ data is that each data source has different characteristics and is affected by uncertainties related to their different spatial scales and the limitations of each technique (Reichle et al. Citation2004, Brocca et al. Citation2013b). For example, systematic differences can arise from (i) differences in the processes, soil and vegetation parameters involved in each model or retrieval algorithm; (ii) differences in the spatial support, in the temporal scale, and in the observation layer depth of each estimate; and (iii) the intrinsic errors of each estimation method. These systematic differences should be reduced because they hinder the achievement of good agreement between datasets, even though their temporal dynamics are very similar (Reichle and Koster Citation2004, Loew and Schlenz Citation2011, Brocca et al. Citation2013b). To accomplish this task, several normalization techniques, such as linear regression correction (Jackson et al. Citation2010, Brocca et al. Citation2011) and cumulative density function (CDF) matching (Reichle and Koster Citation2004, Drusch et al. Citation2005, Lacava et al. Citation2012a, Citation2012b), have been developed.
These studies confirmed that comparisons of the information from in situ soil moisture networks, hydrological modelling and satellite soil moisture retrieval could improve soil moisture monitoring at large scales and agreed on the need for future research with new improved satellite soil moisture retrievals.
The focus of this work is to assess the use of modelled data in addition to in situ soil moisture measurement data to validate the SMOS L2 soil moisture product (L2 version 5.51). For this purpose, a set of representative stations of the REMEDHUS network was selected, and the results of the SMOS validations obtained from both modelled and in situ data compared over a long time period (from January 2010 to December 2013) in the central part of the Duero basin (Spain). Moreover, the effects of soil characteristics and land use are evaluated at the point scale. The last goal was to test the application of the model with area-averaged data, with the aim of minimizing the effects of scale differences between in situ and satellite data. Normalization techniques are applied for reducing the systematic differences observed in the comparison between datasets.
It is noteworthy that the long period of study (4 years) presents an opportunity to evaluate with confidence the SMOS and modelled datasets in simulating the intra- and inter-annual variability of soil moisture under meteorological conditions representative of the Mediterranean semi-arid climate of this region.
2 Materials and methods
2.1 Datasets
2.1.1 REMEDHUS dataset
The study area () is located in the central part of the Duero basin, in northwest Spain, with a surface area of approximately 1300 km2 (41.1–41.5°N, 5.1–5.7°W). In this region, the climate is continental semi-arid Mediterranean, and the topography is nearly flat with gentle slopes (<10%). The main land use is agricultural, with rainfed cereals and smaller areas of irrigated crops, vineyards, forest and pasture (Sánchez et al. Citation2012a). Most of the soils are sandy in the top layer and have low organic matter content (Ceballos et al. Citation2002, Martínez-Fernández and Ceballos Citation2003).
Figure 1. Location of the REMEDHUS area representing soil moisture stations, weather stations and DGG centres of SMOS L2.
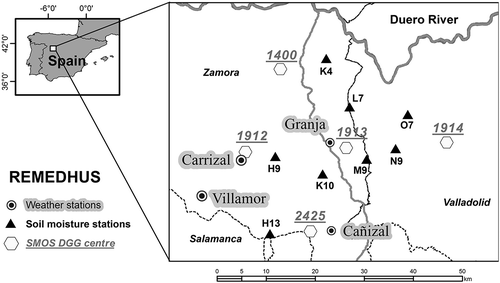
The REMEDHUS network includes a set of automatic soil moisture stations equipped with capacitance probes (Hydra, Stevens® Water Monitoring System, Inc.) providing continuous hourly soil moisture measurements for the first 5 cm of the topsoil, and four automatic weather stations measuring the main climatic variables every 10 minutes (). The network provides an intensive and continuous long-term soil moisture dataset and has been used to calibrate and validate different multiscale sources such as hydrological models and remote-sensing data from different satellites, providing good results (Ceballos et al. Citation2005b, Sánchez et al. Citation2010, Citation2012a, Citation2012b, Brocca et al. Citation2011, Wanders et al. Citation2012, Sánchez-Ruiz et al. Citation2014, González-Zamora et al. Citation2015). Noteworthy characteristics of the REMEDHUS network area for the validation of remote-sensing datasets are its homogeneous vegetation cover and gentle and uniform topography (Sánchez et al. Citation2012a). The network stations were distributed according to topographic, lithological, edaphic, geomorphological and land-use criteria (Ceballos et al. Citation2005a).
Selection of the stations was based on knowledge from previous studies (Ceballos et al. Citation2002, Citation2005a, Martínez-Fernández and Ceballos Citation2005, Martínez-Fernández et al. Citation2007) that considered soil properties (texture and organic matter) and land use as the most useful characteristics to explain the spatial-temporal variability of soil moisture and taking into account the spatial homogeneity of other characteristics in the study area (climate and topography). The REMEDHUS stations were grouped on the basis of texture class and organic matter content, and for each resulting group a few stations were selected as a function of land use and the quality of the soil moisture data series in the study period. This classification showed a consistent relationship between the in situ soil moisture content and soil characteristics, in accordance with the results of previous studies (). Finally, the eight selected stations provided an in situ dataset from January 2008 to December 2013 (). The highest soil water content was found in the clayey soils (H9 station) located at the valley bottom in a forest–pasture area. At this station, the water table is shallow in winter and spring, and occasional flooding occurs. The water contribution of the river leads to a high variability of soil moisture between the dry and wet periods, with a temporal coefficient of variation of 49%.
Table 1. REMEDHUS representative stations (topsoil properties). CV: coefficient of variation.
Medium water contents were found for the stations with a sandy clay loam texture (N9, M9 and L7 stations), and in this group the soil moisture content increases as the sand content decreases and the organic matter content increases.
Loamy sand and sandy loam textures and low organic matter usually have low water content (O7 and H13 stations). The lowest soil water content was located in well-drained sandy soils with very low organic matter content (K10 and K4 stations). These soils have the lowest soil water retention capacity. The stations with the highest sand content (K10, K4 and O7) showed the highest coefficients of variation (more than 50%). Note that the classification from high to very low soil moisture content is referred to as the common semi-arid condition of the study area.
2.1.2 SMOS L2 dataset
The remotely sensed soil moisture comes from the SMOS L2 soil moisture product (version 5.51) delivered by ESA, with both ascending and descending satellite passes (6 a.m./6 p.m.). The processing of the SMOS brightness temperature data and the soil moisture retrieval are fully described in Kerr et al. (Citation2011).
The main difference between version 5.51 and the previous processor version is a change in the dielectric constant model from the semi-empirical Dobson model to the semi-physical Mironov formulation (Mironov et al. Citation2009), leading to a simpler and more robust mathematical formulation when the soil moisture is close to zero (Kerr et al. Citation2011). The first analyses showed that the latter model improves soil moisture estimates, increases the number of better and more successful retrievals over dry warm surfaces, and reduces extreme values of soil moisture (Kerr et al. Citation2011). Empirical relations that depend on soil texture are valid for a wider range of soil textures, with a more robust representation of very sandy soils (Kerr et al. Citation2011). Moreover, the “average” retrieved soil moisture increases significantly (more than 0.04 m3 m−3 globally) with the Mironov formulation (Release note of the SMOS level 2 v. 5.51 Soil Moisture data products Citation2013).
The Soil Moisture Level 2 User Data Product (SMUDP2) data were geolocated and projected on the icosahedral Snyder equal area hexagonal discrete global grid (DGG), with a spacing of 15 km between nodes (identified by a Grid_Point_ID). This L2 dataset contains the retrieved geophysical parameters and their associated theoretical uncertainties, expressed in a data quality index (DQX), which is the theoretical retrieval standard deviation, and in a radio-frequency interference (RFI) probability flag. In this work, data with a DQX value above a threshold of 0.06 m3 m−3 were excluded to ensure the best quality of SMOS retrievals. Moreover, the impact of RFI in the SMOS data is well known. The possible RFI-corrupted data were discarded by filtering the data out using the RFI probability flag from the SMDUP2 v. 5.51 product (ranging from 0, no RFI probability, to 1, expect corrupted data). A threshold of 0.3 was chosen, meaning a probability of RFI < 30%, in line with more recent applications of SMOS data (Bircher et al. Citation2013).
The nominal class of the current reference land cover for the retrieval algorithm, ECOCLIMAP 2004 (Masson et al. Citation2003), is low vegetation of grass and crops, coinciding with the characteristics of the most widespread land use in the study area.
The selected area (1300 km2) encompasses ~16 DGG cells, and for this study each soil moisture value was extracted from the DGG cell closest to each selected station (). Five DGG cells were used in the analysis (1081400, 1081912, 1081913, 1081914 and 1082425). For convenience, only the four last numbers of the Grid_Point_ID of the DGG are used hereafter. The time series of the ascending and descending orbits were compared separately to explore whether significant differences could be detected.
2.2 Methods
2.2.1 Soil water balance model Green-Ampt
The modelled time series were estimated using a parsimonious and lumped soil water balance model (SWBM-GA). The structure of the model used in this study was developed by Brocca et al. (Citation2008), and it has been widely tested and applied in different test sites located across Europe, obtaining satisfactory performance (Brocca et al. Citation2013a, Citation2014).
The model is schematized as a spatially lumped system that simulates soil moisture temporal evolution for a soil layer, where the following water content balance equation holds:
where t is time, Z is soil layer depth, θ(t) is average soil moisture content (in volumetric units) of the investigated soil layer, θs is saturated soil moisture content, and f(t), e(t) and g(t) are the infiltration, evapotranspiration and percolation (due to the interflow and/or the deep percolation) rates, respectively. The model employs the Green-Ampt equation for infiltration (Green and Ampt Citation1911), a gravity-driven nonlinear relationship for percolation (Famiglietti and Wood Citation1994), and the evapotranspiration is a fraction of its potential value according to the degree of saturation of the soil layer, θe = (θ – θr ⁄θs – θr), where θr is the residual soil moisture value. The potential evapotranspiration is computed using Blaney and Criddle’s formulation, modified by Doorenbos and Pruitt (Citation1977).
The input data of the model are routinely measured variables (rainfall and air temperature), and only four parameters need to be calibrated: the saturated hydraulic conductivity (Ks), the wetting front soil suction head (ψb), the pore-size distribution index (λ), and a correction factor Kc for taking into account the empirical nature of the potential evapotranspiration equation. Moreover, the saturated and residual soil moisture contents (θs, θr) are needed.
In this work, the model was applied at an hourly rate using different periods for calibration and validation (January 2008 to December 2009 and January 2010 to December 2013, respectively). Two strategies were applied: point-scale simulations for each selected station using hourly rainfall and air temperature from the closest weather station as inputs (Cañizal and La Granja) and in situ measurements, using a 5 cm depth as a benchmark. In the second method, the area-averaged simulations used the weather station data average (of all the meteorological stations available in the study area) as input and the averaged in situ data of the selected soil moisture station as the benchmark. shows the annual rainfall and the aridity index, AI (UNEP Citation1997), for the weather stations and for the averaged data. The average AI through the whole calibration period was similar to the validation value (). In the study period, the climatic conditions show that years differ in terms of the amount of rainfall.
Table 2. Annual rainfall and aridity index (AI) during the calibration and validation periods.
Using the input meteorological series, the model parameters (Ks, ψb, λ, Kc) were optimized against in situ observations by minimizing the error over the calibration period. As the parameters Ks, ψb and λ are physically based, their values were limited on the basis of those obtained by Rawls et al. (Citation1982) as a function of the texture classes (). Kc was limited on the basis of previous studies in the area (). The accuracy of the parameter calibration was assessed through the correlation coefficient (R), the index of agreement (d; Willmott Citation1982), the root mean square difference (RMSD) and the bias. The parameters θs and θr were obtained using the maximum and the minimum observed soil moisture values, respectively, for the whole period (January 2008–December 2013). The layer depth was fixed at 10 cm, considering the representativeness of the soil volume monitored by the in situ probes.
Table 3. Range of calibrated parameter values based on Rawls et al. (Citation1982).
After the calibration phase, the model simulations ran with the input meteorological series and the calibrated parameters from January 2010 to December 2013, and the results were validated against the in situ measurements in the same period. The statistics used to assess the validation were the same as those used in the calibration phase.
2.2.2 Comparison and normalization strategies
The comparisons were conducted both at the point scale (each station vs its collocated grid cell) and area-averaged. In situ and modelled soil moisture series were obtained, coinciding with the date and time of the SMOS overpasses.
Comparisons at the point scale are essential for evaluating the results under the representative characteristics (soil, land use) related to soil moisture variability. Otherwise, these characteristics are averaged for the areal soil moisture data. Moreover, the application of the model with area-averaged data could reduce the spatial scale difference effect between the in situ and SMOS datasets in the study area.
The systematic bias between the SMOS data with in situ observations and modelled data was removed by normalization techniques consisting of linear regression correction (Jackson et al. Citation2010, Brocca et al. Citation2011) and cumulative distribution function (CDF) matching (Drusch et al. Citation2005, Lacava et al. Citation2012a). The first method is based on the application of a regression equation between satellite and in situ/modelled soil moisture time series. In the CDF-matching method, the satellite data are normalized by matching their cumulative distribution function to the cumulative distribution function of in situ/modelled data. The method of Drusch et al. (Citation2005) was used in this study by ranking the datasets of SMOS and the in situ/modelled soil moisture, computing the differences between the ranked datasets, and then fitting a fifth-order polynomial to the ranked SMOS soil moisture and the corresponding differences.
The statistics used to evaluate the comparison between SMOS L2 with in situ and modelled datasets were R, RMSD and bias.
3 Results
3.1 Soil water balance model (SWBM-GA)
The long-term continuous soil moisture in situ series allowed for performing a robust calibration (2008–2009) of the SWBM-GA model and determining the accuracy of the model to simulate the intra and inter-annual variability of the in situ soil moisture within a validation period of four years (2010–2013). For the calibration period, the modelled and observed time series showed a good fit at the point scale and using area-averaged data. The results showed R and d values above 0.84 and 0.91, respectively, with low bias for all the stations (). The RMSD values were below 0.04 m3 m−3, except for that of the H9 station.
Table 4. Calibration and validation model results at the representative stations and for its application with averaged data. R: correlation coefficient; d: agreement index; RMSD: root mean square difference and bias in volumetric units (m3 m−3). All the correlations are significant at a 95% confidence level.
Overall, the results of the validation show that the soil moisture simulated by SWBM-GA was in good agreement with the observed soil moisture in the study area, obtaining a high index of agreement (d ≥ 0.80), high correlation coefficient (R ≥ 0.86, except for K10 and K4), low RMSD (≤0.05, with the exception of H9) and very low bias (<0.03 for all stations). In particular, it highlights the good model performance using the area-averaged meteorological data, which could be considered a successful way to upscale the data (). These results are similar to those obtained by other authors who applied the SWBM-GA model (Brocca et al. Citation2010, Citation2011, Citation2013a, Citation2014, Lacava et al. Citation2012a) and those obtained in the REMEDHUS network with other models (i.e. SWAP, Wanders et al. Citation2012). Specifically, by applying the SWBM-GA model at the K10 station of REMEDHUS, Brocca et al. (Citation2014) obtained, for a period of 1 year, R and RMSD values of approximately 0.83 and 0.024 m3 m−3, respectively, similar to the 0.73 and 0.03 m3 m−3 found in this work for a longer period. These good results in the REMEDHUS network have been attributed to the high quality of the hydrometeorological data and the capability of the model to reproduce the different processes involved in the soil water balance (Brocca et al. Citation2014).
The simulation series captured the inter- and intra-annual variability of the soil moisture, both at the selected stations and especially in the area-averaged pattern, through the seasons and most of the peaks and troughs of the soil moisture pattern, regardless of whether it was a dry (2011 and 2012) or wet (2010 and 2013) year ( and ).
Figure 2. Modelled soil moisture (SWBM) vs in situ soil moisture (in situ) in the calibration (Cal) and validation periods (Val) for the M9, O7 and H13 stations and for the simulations with averaged data. The rainfall series of the La Granja and Cañizal weather stations and the average rainfall of the four weather stations are also shown.
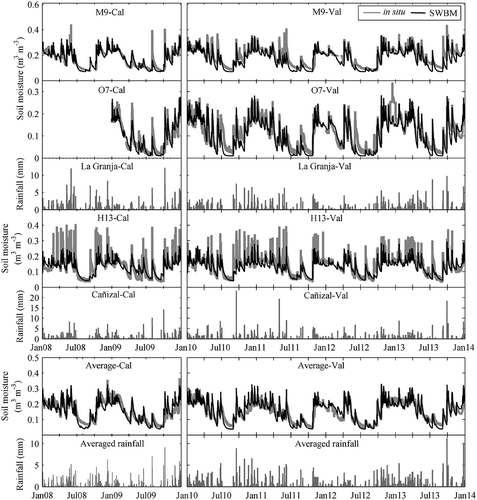
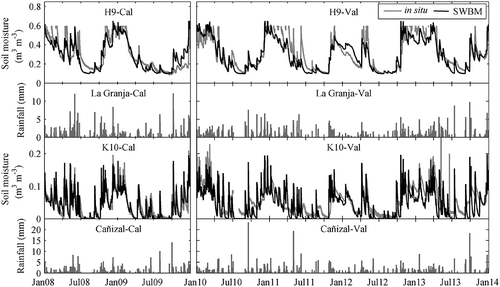
Only for the locations with some peculiar characteristics (K10, K4 and H9) was the model performance less satisfactory. One particular case is related to the capability of the model to simulate the soil moisture under conditions of very low water content and a narrow dynamic range (), linked to the well-drained sandy soils and limited rainfall in this area, which led to slightly smaller correlation coefficient values (R = 0.73 for both K10 and K4). This situation represented a tougher test for the model and was also detected by Brocca et al. (Citation2014) in a different simulation period (2007 and 2009) at the K10 station. Another particular case (H9) was observed in some periods of winter and spring, when the soil moisture content was high (), coinciding with temporary flood events occurring in a clay soil located in the valley bottom. This situation could be considered unusual in terms of the soil moisture dynamics in the area, taking into account its semi-arid characteristics. In this case, the model showed difficulties in simulating in situ soil moisture observations () and, as a result, the RMSD was the highest in both the calibration and validation periods ().
Figure 3. Modelled soil moisture (SWBM) vs in situ observed soil moisture (in situ) in the calibration (Cal) and validation periods (Val) for the H9 and K10 stations and the rainfall series of the Cañizal and La Granja weather stations.
Based on these results, the SWBM-GA model seems suitable for the study area to simulate the dynamics of soil moisture at the representative stations and the area-averaged soil moisture, which is of especial interest in SMOS validation.
3.2 Comparison of the SMOS L2 series with in situ observations
The dynamics of soil moisture of both the ascending and the descending SMOS L2 series were similar throughout the study period for the DGG cells associated with the different soil moisture stations (). Nevertheless, the results of the validation () showed a slightly better performance for the ascending SMOS L2 series than the descending series, with an improvement in R ranging between 0.01 and 0.10 for all cases (). Similar behaviour was also observed in other studies (Piles et al. Citation2011, Lacava et al. Citation2012a, Leroux et al. Citation2013) and was ascribed to several reasons, including the non-hydraulic equilibrium of the soil moisture at 6:00 p.m. local solar time, corresponding with the descending orbits, and more stability in the temperature during the ascending orbits (6:00 a.m.).
Table 5. Validation results of ascending (A) and descending (D) SMOS L2 series and the corresponding normalized SMOS series by linear regression (SMOSREG) and by CDF matching (SMOSCDF) vs in situ observations and vs the average of in situ observations within the 1913 DGG cell, and validation results of the averaged SMOS series vs the averaged in situ series of all the selected stations. N obs: number of observations; R: correlation coefficient; RMSD: root mean square difference and bias, both in volumetric units (m3 m−3). All the correlations are significant at a 95% confidence level.
Figure 4. Ascending (A) vs descending (D) SMOS L2 series of the DGG cells: 1400 (K4), 1912 (H9), 1913 (K10, L7, M9 and N9), 1914 (O7) and 2425 (H13).
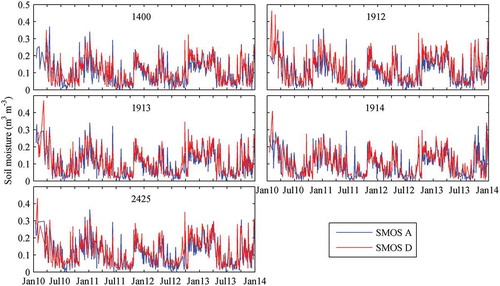
In the winter of 2010, some unexpected peaks were observed for the descending time series of the 1912, 1913, 1914 and 2425 DGG cells () which, despite efforts to filter the data, could be attributed to the RFI detected in the Spain area during the first weeks of 2010 (Sánchez et al. Citation2012a). In addition, some data were lost before the beginning of the routine operations phase in May 2010.
Notwithstanding its inherent limitations, mainly linked to the coarse spatial resolution, the results of the validation of SMOS L2 with in situ data were satisfactory in terms of R and acceptable in terms of RMSD and bias, with the exception of H9, which had higher values (). These results are generally better in terms of R than those obtained in previous validations of L2 data in REMEDHUS for a shorter validation period and with a previous version of SMOS (Albergel et al. Citation2012, Sánchez et al. Citation2012a).
For all the locations, the SMOS L2 series were able to reproduce the general pattern of the observed soil moisture dynamics over the study period (). However, a fairly constant underestimation from the SMOS dataset of in situ observations was observed in the ascending and descending SMOS series, regardless of whether it was a dry or wet period and in cases of stations with both medium soil moisture content in sandy clay loam soils (L7, M9 and N9) and high soil moisture content in silty clay loam soil (H9). In these cases, the highest values of the RMSD and a dry bias were observed. The underestimation was also observed in other studies of SMOS validation (Al Bitar et al. Citation2011, Collow et al. Citation2012, Dall’amico et al. Citation2012, Dente et al. Citation2012, Lacava et al. Citation2012a). In the case of Sánchez et al. (Citation2012a), the underestimation in the REMEDHUS area was fairly constant during the entire period of study, except for some rain events during which SMOS seemed to be more reactive than the in situ data.
Figure 5. Time series of in situ (in situ) and SMOS ascending (SMOS) for the H9, M9, O7, H13 and K10 stations. The rainfall from La Granja and Cañizal weather stations is also shown.
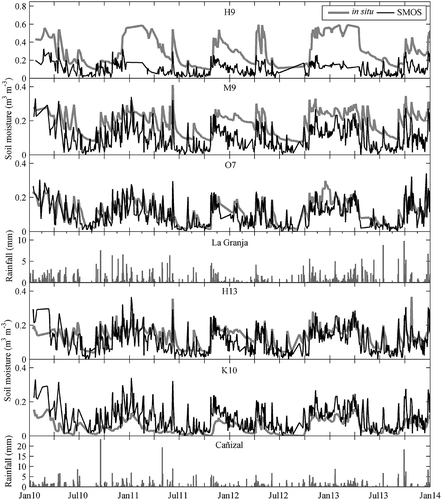
The underestimation of the in situ values by SMOS L2 and the high values of the RMSD and bias could be related to the very dissimilar spatial scales between the SMOS L2 DGG cells and the in situ observations. Another reason could be the particular conditions of the soils studied, such as an unusual soil moisture content and/or soil texture. In the H9 case, the nominal class at the REMEDHUS DGGs (low vegetation of grass and crops) mismatched the land cover of this site, which is located in a valley bottom within a forested area. In addition, the specific characteristics of this soil (silty and clayey soil and high soil moisture content due to the saturation of the soil in the winter and spring) do not represent the averaged cell area of SMOS (). For this station, the RMSD and bias were high (), as found by Sánchez et al. (Citation2012a).
At the L7, M9 and N9 stations, whose land cover corresponds to the nominal class used in the SMOS retrieval algorithms, the RMSD values were significantly smaller compared to those at the H9 station (). Nevertheless, the underestimation persisted throughout the whole study period ().
As expected, the underestimation was smaller at sites with low soil moisture content located in loamy sand and sandy loam soils (O7 and H13, and ), with an RMSD and bias below 0.06 m3 m−3 and 0.03 m3 m−3, respectively ().
In contrast to the rest of the stations, at K10 and K4, an overestimation of the in situ soil moisture appeared during the whole period, especially during rainfall periods with less significance in the summer (), which led to a negative bias and an RMSD between 0.07 and 0.09 m3 m−3. The overestimation is more relevant in sandy soils and semi-arid meteorological conditions because the radiometer could measure a wetter and shallower layer than the depth of the in situ measurements during or shortly after a rainfall (Jackson et al. Citation2012, Wanders et al. Citation2012). However, after the rainfall event the soil moisture of the surface layer will equilibrate and become more uniform, so it does not appear to be the single reason for the overestimation of SMOS at the K10 and K4 stations.
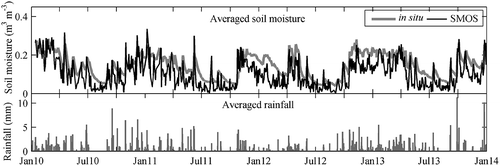
The main reason for the overestimation is probably related to the very low soil moisture content of very well drained sandy soils (approximately 90% sand) at K4 and K10 (). This particular condition might not be representative of the DGG cell of SMOS. Indeed, it could be noted that, as K10, L7, M9 and N9 are in the same SMOS DGG cell (1913), the soil moisture content at the stations with sandy clay loam soils (L7, M9 and N9) was underestimated, whereas with sandy soil (K10), it was overestimated. Therefore, another analysis was performed, comparing the SMOS data with the average of the soil moisture stations within the DGG cell area. It was determined that the SMOS series were more correlated with the averaged soil moisture than with the soil moisture of each station separately (), and the RMSD and bias were smaller than for the series of individual stations. In this vein, the comparison between the averaged series showed the highest correlation, in accordance with the averaged nature of the SMOS data ( and ). Again, in this new comparison, the SMOS averaged series showed an underestimation of the averaged in situ series ().
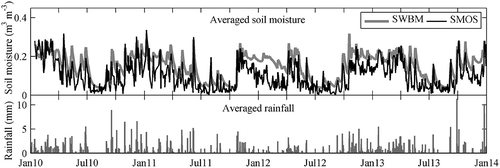
Figure 6. Time series of averaged in situ (in situ) and averaged SMOS ascending (SMOS) of the selected stations and the average rainfall.
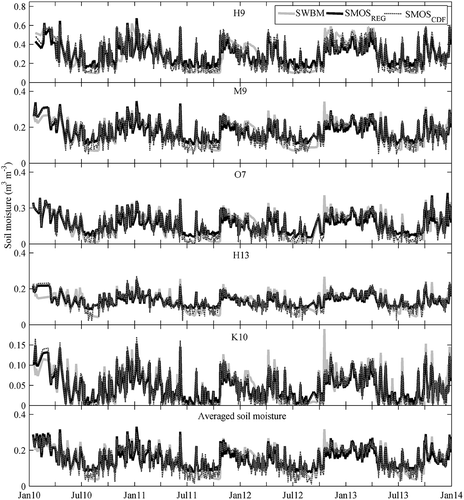
After the application of normalization techniques, the SMOS L2 time series (SMOSREG and SMOSCDF) reproduced the soil moisture temporal pattern more accurately (), reducing the bias to negligible values. Moreover, as expected, the normalization of the SMOS L2 data introduced an appreciable reduction of the soil moisture underestimation, especially in the locations associated with high and intermediate soil moisture content and with respect to the averaged soil moisture observations (), and also of the soil moisture overestimation of the stations with very low soil moisture content ().
Figure 7. Time series of in situ (in situ) and of normalized SMOS ascending by linear regression (SMOSREG) and by CDF matching (SMOSCDF) for the H9, M9, O7, H13 and K10 stations and for the average of the selected stations.
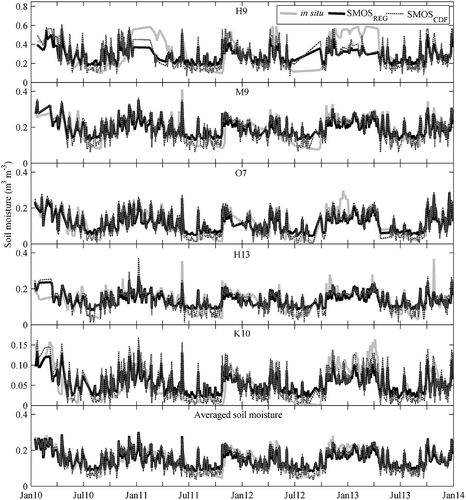
In all cases, the reduction of the RMSD was slightly higher when applying the normalization using linear regression than when applying CDF matching (). However, the linear regression technique reduced the variability of the SMOS series in the summer periods.
3.3 Comparison of the SMOS L2 and SWBM-GA data
Similarly to the comparison in the previous section, both the SMOS L2 and the normalized SMOS L2 time series (SMOSREG and SMOSCDF) were compared with those obtained by the SWBM-GA model in the period January 2010–December 2013 (). The SMOS L2 and modelled series showed high similarity in the temporal pattern (), with correlation coefficients between 0.72 and 0.83 (). Moreover, the RMSD and bias (in absolute value) ranged between 0.04 and 0.12 m3 m−3 and between 0.01 and 0.11 m3 m−3, respectively, with the exceptions of the L7 and H9 stations with higher values (). No distinct performance in terms of the R, RMSD and bias series was observed between the ascending and descending overpasses.
Table 6. Validation results of ascending (A) and descending (D) SMOS L2 series and the corresponding normalized SMOS series by linear regression (SMOSREG) and by CDF matching (SMOSCDF) vs modelled series and vs the averaged modelled series within the 1913 DGG cell, and validation results of averaged SMOS series vs modelled series using averaged data. N obs: number of observations; R: correlation coefficient; RMSD: root mean square difference and bias, in volumetric units (m3 m−3). All the correlations are significant at a 95% confidence level.
Figure 8. Time series of modelled observations (SWBM) and SMOS ascending (SMOS) for the H9, M9, O7, H13 and K10 stations. The rainfall pattern of La Granja and Cañizal weather stations is also shown.
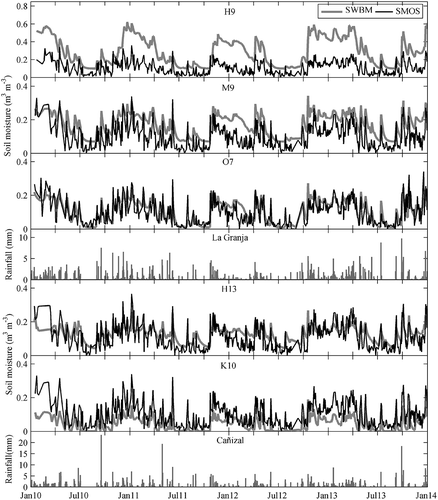
As in the SMOS L2 validation with in situ observations, a similar underestimation with respect to the modelled soil moisture was observed for the stations with relatively high and intermediate soil moisture contents (), with values of RMSD between 0.08 and 0.14 m3 m−3 and a dry bias between 0.07 and 0.13 m3 m−3 and higher values for the H9 station, probably due to their specific environmental conditions ().
The underestimation had low relevance in the case of the stations with relatively low soil moisture content in loamy sand and sandy loam soils (O7 and H13). Nevertheless, for these cases, the SMOS L2 time series adequately represented the temporal variability of the soil moisture for the modelled data (), and showed very satisfactory values of R and RMSD in both the ascending and the descending series, with a negligible bias ().
For the soil moisture stations in sandy soils with very low soil moisture content (K4 and K10), the overestimation of SMOS with respect to the modelled data occurred once again (). Despite this fact, their respective correlation coefficients were the highest (), probably due to the high sensitivity of both the model and SMOS to rainfall events, particularly in sandy soils with a low water-retention capacity, where the evolution of the soil moisture is closely dependent on the rainfall events (Ceballos et al. Citation2002).
When the comparison was carried out between the 1913 DGG and the averaged modelled soil moisture within the DGG cell, the improvement of the correlation with respect to the analysis at each individual station was not so clear as that with the in situ series ( and ). This could be because the modelled soil moisture represents an area closer to the spatial resolution of that of the DGG cell. However, when a comparison was carried out between the averaged series, a clear improvement in the results in terms of the correlation, RMSD and bias, as well as a reduction of the underestimation, was achieved ( and ).
Figure 9. Time series of modelled observations using averaged data (SWBM) and of averaged SMOS ascending (SMOS) data and the average rainfall.
The SMOSREG and SMOSCDF series exhibited good agreement with the modelled series, reducing the effects of the underestimation for H9, L7, M9 and N9, and with respect to the averaged modelled series and the overestimation for K10 and K4 ().
Figure 10. Time series of modelled (SWBM) and of normalized SMOS ascending by linear regression (SMOSREG) and by CDF matching (SMOSCDF) for the H9, M9, O7, H13 and K10 stations and for the average of the selected stations.
4 Discussion
The results of the validation of both SMOS and SWBM-GA were related to the soil texture and soil moisture content. This issue is especially important in understanding the behaviour of the different datasets in relation to the spatial-temporal variability of the soil moisture in the study area. In the case of SMOS validation, the best fit and results in terms of R and RMSD were found for the stations with low soil moisture content (loamy sand and sandy loam textures). However, some underestimation was detected for the locations with medium soil moisture content (sandy clay loam texture), with an RMSD between 0.10 and 0.13 m3 m−3 and a dry bias between 0.08 and 0.11 m3 m−3. Moreover, the model showed a very good fit (d ≥ 0.91, R ≥ 0.88 and RMSD ≤ 0.05) with the in situ data at the stations with soil moisture content in the low to medium range (loamy sand to sandy clay loam soils).
Under particular conditions, both SWBM-GA and SMOS showed difficulties in depicting in situ data (i.e. highest RMSD and underestimation of in situ data), as in the case of H9, but in different manners. For SMOS, the caveat could be related to the mismatch between the theoretical land cover used in the retrieval for this cell and the actual land cover of the site, which could lead to different behaviour of the soil moisture. The SMOS L2 algorithm could not capture the non-representative specific conditions of one particular location of the DGG. However, for the model, it could be related to the temporary flooding of the soil at the valley bottom in the winter and spring, which the model could not simulate. Probably for this reason, the RMSD is lower for the model validation than for SMOS (0.08 m3 m−3 vs 0.21 m3 m−3).
In the case of locations with well-drained sandy soil (K4 and K10), some overestimation was detected in the SMOS data with respect to the in situ data, mostly in rainfall periods (RMSD between 0.07 and 0.09 m3 m−3 and bias between −0.05 and −0.07 m3 m−3) that were not found in the modelled data (RMSD of 0.02 and 0.03 m3 m−3, respectively). However, in the model output, the effect is emphasized in terms of R, probably due to difficulties in the model simulating the soil moisture in soils with very low content and high variability in a narrow dynamic range of soil moisture.
The validation of the SMOS L2 with the modelled time series generally showed a better correlation than that with the in situ observations. This improvement is probably due to the model’s reliance on precipitation and air temperature as input data. These factors can be considered representative of larger areas, closer to the spatial resolution of SMOS L2 data. Moreover, when the simulation was performed with averaged meteorological data, the best results in terms of the correlation, as well as acceptable values of RMSD and bias, were obtained. These results are in agreement with other applications of the SWBM-GA model in SMOS validation (Lacava et al. Citation2012a), in which the model was forced with meteorological data representative of 15 km2. It was observed that the agreement was better when modelled data were used rather than in situ measurements. Thus, the application of the model reduces the spatial mismatch between the ground and satellite data. Along this line, a range of existing soil moisture upscaling strategies, including modelling, are being developed for reducing the impact of the spatial sampling error on satellite soil moisture validation activities (Crow et al. Citation2012).
For comparisons at the point scale, in both validations (SMOS vs model and SMOS vs in situ), the best agreement was observed for the locations with low soil moisture content, i.e. loamy sand and sandy loam soils. For these sites, SMOS was able to suitably reproduce the soil moisture content and the temporal variations of both the in situ and modelled soil moisture.
The relationships between SMOS accuracy and specific environmental conditions were analysed in previous research. Jackson et al. (Citation2012) highlighted that the overestimation effect associated with rainfall events was more significant for a semi-arid watershed with well-drained sandy soils because it is more likely when the soil is initially dry and the precipitation event is of short duration and high intensity. Moreover, in Bircher et al. (Citation2013), SMOS L2 data and in situ measurements seemed to be better correlated with a group of stations within sandy soils in the summer period because they were more representative of the overall conditions of the study area. Wanders et al. (Citation2012) highlighted that there are several factors, such as vegetation, soil moisture dynamics, average soil moisture content and the actual soil moisture content, that could cause adverse effects on the satellite accuracy in estimating soil moisture. In particular, SMOS performed worse in highly dynamic soil moisture regimes because of its higher signal to noise ratio compared to other sensors such as AMSR-E and ASCAT, showing an increase in the satellite standard error.
5 Conclusions
In this study, datasets from different sources were compared at the point scale at representative stations and on the area-averaged scale to assess the ability of the SWBM-GA model to validate the SMOS L2 version 5.51 soil moisture product.
The modelled SWBM-GA soil moisture provided satisfactory results compared to the in situ observations. Moreover, the modelled series accurately simulated the general trend of the soil moisture annual cycles and captured the soil moisture temporal pattern at short temporal scales under different soil properties and land uses of the study area. Based on the results, the SWBM-GA can be used with confidence in validation activities.
The dynamics of soil moisture throughout the study period were also correctly represented by the SMOS L2 series for most of the analysed stations. The SMOS L2 series had a good correlation with the modelled time series, better than that obtained by validation with in situ observations. However, some critical issues were observed in the comparison of SMOS with both the in situ observations and the modelled series, arising from the specific environmental characteristics of the sites and the different spatial scales among datasets, which resulted in underestimation of the soil moisture through the whole period and overestimation linked to rainfall events.
The application of normalization techniques to the SMOS L2 data produced, as expected, a remarkable improvement in the agreement with in situ and modelled observations. The results obtained by comparison between the SMOS normalized and modelled series equal (or even improve upon) the expected accuracy of the SMOS mission.
The model was considered fully accurate to simulate soil moisture and validate the SMOS L2 v. 5.51 product under different characteristics related to soil moisture during a long and climatically contrasting period.
To overcome the spatial representativeness problems arising from the use of different dataset sources (in situ, remote sensing and modelling), the results shown here appear to provide a solid foundation for future spatially distributed applications of the SWBM-GA model with the purpose of SMOS validation in large-scale studies. The validation of the satellite soil moisture with modelled data could allow reliable soil moisture maps to be obtained over large areas with good temporal coverage in a wide range of environmental conditions, which is especially important in the dominant agricultural areas of the central plateau of the Duero basin.
Disclosure statement
No potential conflict of interest was reported by the authors.
Additional information
Funding
Related Research Data
References
- Al Bitar, A., et al. 2011. Validation of SMOS soil moisture over SCAN/SNOTEL network. Geophysical Research Abstracts, 13, 1.
- Albergel, C., et al., 2012. Evaluation of remotely sensed and modelled soil moisture products using global ground-based in situ observations. Remote Sensing of Environment, 118, 215–226. doi:10.1016/j.rse.2011.11.017
- Al-Yaari, A., et al., 2014. Global-scale evaluation of two satellite-based passive microwave soil moisture datasets (SMOS and AMSR-E) with respect to land data assimilation system estimates. Remote Sensing of Environment, 149, 181–195. doi:10.1016/j.rse.2014.04.006
- Bircher, S., Skou, N., and Kerr, Y.H., 2013. Validation of SMOS L1C and L2 products and important parameters of the retrieval algorithm in the skjern river catchment, Western Denmark. IEEE Transactions on Geoscience and Remote Sensing, 51 (5), 2969–2985. doi:10.1109/TGRS.2012.2215041
- Brocca, L., et al., 2010. ASCAT soil wetness index validation through in situ and modelled soil moisture data in central Italy. Remote Sensing of Environment, 114, 2745–2755. doi:10.1016/j.rse.2010.06.009
- Brocca, L., et al., 2011. Soil moisture estimation through ASCAT and AMSR-E sensors: an intercomparison and validation study across Europe. Remote Sensing of Environment, 115, 3390–3408. doi:10.1016/j.rse.2011.08.003
- Brocca, L., et al., 2013a. Developing and testing a long-term soil moisture dataset at the catchment scale. Journal of Hydrology, 490, 144–151. doi:10.1016/j.jhydrol.2013.03.029
- Brocca, L., et al., 2013b. Scaling and filtering approaches for the use of satellite soil moisture observations. In: G.P. Petropoulos, ed. Remote sensing of energy fluxes and soil moisture content. Boca Raton, FL: CRC Press 2013, Taylor & Francis Group, Chapter 17, 411–426. ISBN: 978-1-4665-0578-0. doi:10.1201/b15610-21
- Brocca, L., et al., 2014. Improving the representation of soil moisture by using a semi-analytical infiltration model. Hydrological Processes, 28 (4), 2103–2115. doi:10.1002/hyp.9766
- Brocca, L., Melone, F., and Moramarco, T., 2008. On the estimation of antecedent wetness conditions in rainfall–runoff modelling. Hydrological Processes, 22 (5), 629–642. doi:10.1002/hyp.6629
- Ceballos, A., et al., 2002. Soil water behaviour of sandy soils under semi-arid conditions in the Duero Basin (Spain). Journal of Arid Environments, 51 (4), 501–519. doi:10.1016/S0140-1963(02)90973-0
- Ceballos, A., et al., 2005a. Variabilidad espacio-temporal de la humedad del suelo en el sector semiárido de la cuenca del Duero (España). Revista Cuaternario Y Geomorfología, 19 (3–4), 63-77. ISSN:0214-1744.
- Ceballos, A., et al., 2005b. Validation of ERS scatterometer-derived soil moisture data in the central part of the Duero Basin, Spain. Hydrological Processes, 19 (8), 1549–1566. doi:10.1002/hyp.5585
- Chen, M., Willgoose, G.R., and Saco, P.M., 2014. Spatial prediction of temporal soil moisture dynamics using HYDRUS-1D. Hydrological Processes, 28, 171–185. doi:10.1002/hyp.9518
- Collow, T.W., et al., 2012. Evaluation of SMOS retrievals of soil moisture over the central United States with currently available in situ observations. Journal of Geophysical Research, 117 (D09113). doi:10.1029/2011JD017095
- Crow, W., et al., 2012. Upscaling sparse ground-based soil moisture observations for the validation of coarse-resolution satellite soil moisture products. Reviews of Geophysics, 50 (2), RG2001/2012. doi:10.1029/2011RG000372
- Crow, W.T., Miralles, D.G., and Cosh, M.H., 2010. A quasi-global evaluation system for satellite-based surface soil moisture retrievals. IEEE Transactions on Geoscience and Remote Sensing, 48 (6), 2516–2527. doi:10.1109/TGRS.2010.2040481
- Crow, W.T. and Zhan, X., 2007. Continental-scale evaluation of remotely sensed soil moisture products. IEEE Geoscience and Remote Sensing Letters, 4, 451–455. doi:10.1109/LGRS.2007.896533
- Dall’amico, J.T., et al., 2012. First results of SMOS soil moisture validation in the upper danube catchment. IEEE Transactions on Geoscience and Remote Sensing, 50 (5), 1507–1516. doi:10.1109/TGRS.2011.2171496
- De Lannoy, G.J.M., et al., 2006. Assessment of model uncertainty for soil moisture through ensemble verification. Journal of Geophysical Research, 111, D10101. doi:10.1029/2005JD006367
- De Rosnay, P., et al., 2006. SMOSREX: A long term field campaign experiment for soil moisture and land surface processes remote sensing. Remote Sensing of Environment, 102 (3–4), 377–389. doi:10.1016/j.rse.2006.02.021
- Dente, L., Su, Z., and Wen, J., 2012. Validation of SMOS soil moisture products over the Maqu and Twente regions. Sensors, 12, 9965–9986. doi:10.3390/s120809965
- Doorenbos, J. and Pruitt, W.O., 1977. Background and development of methods to predict reference crop evapotranspiration (ETo). FAO-ID-24, Appendix II, 108–119.
- Dorigo, W.A., et al., 2010. Error characterization of global active and passive microwave soil moisture datasets. Hydrology and Earth System Sciences, 14 (12), 2605–2616. doi:10.5194/hess-14-2605-2010
- Dorigo, W.A., et al., 2011. The international soil moisture network: a data hosting facility for global in situ soil moisture measurements. Hydrology and Earth System Sciences, 15, 1675–1698. doi:10.5194/hessd-8-1609-2011
- Drusch, M., Wood, E.F., and Gao, H., 2005. Observation operators for the direct assimilation of TRMM microwave imager retrieved soil moisture. Geophysical Research Letters, 32 (15), L15403. doi:10.1029/2005GL023623
- Famiglietti, J.S. and Wood, E.F., 1994. Multiscale modeling of spatially variable water and energy balance processes. Water Resources Research, 30 (11), 3061–3078. doi:10.1029/94WR01498
- Finke, P.A., Wösten, J.H.M., and Jansen, M.J.W., 1996. Effects of uncertainty in major input variables on simulated functional soil behaviour. Hydrological Processes, 10 (5), 661–669. doi:10.1002/(SICI)1099-1085(199605)10:5<661::AID-HYP346>3.0.CO;2-R
- Ford, T.W., Harris, E., and Quiring, S.M., 2014. Estimating root zone soil moisture using near-surface observations from SMOS. Hydrology and Earth System Sciences, 18, 139–154. doi:10.5194/hess-18-139-2014
- González-Zamora, A., et al., 2015. Long-term SMOS soil moisture products: A comprehensive evaluation across scales and methods in the Duero Basin (Spain), Physics and Chemistry of the Earth, Parts A/B/C. [cited 4 June 2015], ISSN 1474-7065. Available from: http://www.sciencedirect.com/science/article/pii/S1474706515000686
- Green, W.H. and Ampt, G., 1911. Studies of soil physics. Part I. The flow of air and water through soils. Journal of Agricultural Science, 4, 1–24. doi:10.1017/S0021859600001441
- Gruber, A., et al., 2013. Characterizing coarse-scale representativeness of in situ soil moisture measurements from the international soil moisture network. Vadose Zone Journal, 12 (2), 16. doi:10.2136/vzj2012.0170
- Jackson, T.J., et al., 2010. Validation of advanced microwave scanning radiometer soil moisture products. IEEE Transactions on Geoscience and Remote Sensing, 48 (12), 4256–4272. doi:10.1109/TGRS.2010.2051035
- Jackson, T.J., et al., 2012. Validation of soil moisture and ocean salinity (SMOS) soil moisture over watershed networks in the U.S. IEEE Transactions on Geoscience and Remote Sensing, 50 (5), 1530–1543. doi:10.1109/TGRS.2011.2168533
- Juglea, S., et al., 2010. Modelling soil moisture at SMOS scale by use of a SVAT model over the valencia anchor station. Hydrology and Earth System Sciences, 14, 1509–1525. doi:10.5194/hess-14-1509-2010
- Kerr, Y., 2007. Soil moisture from space: where are we? Hydrogeology Journal, 15 (1), 117–120. doi:10.1007/10040-006-0095-3
- Kerr, Y., et al., 2010. The SMOS mission: new tool for monitoring key elements of the global water cycle. IEEE Transactions on Geoscience and Remote Sensing, 98 (5), 666–687. doi:10.1109/JPROC.2010.2043032
- Kerr, Y., et al., 2011. SMOS level 2 processor soil moisture algorithm theoretical basis document (ATBD), CBSA, UoR, TV and INRA, Toulouse, Tech. Rep. SO-TN-ARR-L2PP-0037, V3.4, 24/01/2011 2011. Available from: http://www.cesbio.ups-tlse.fr/fr/indexsmos.html
- Kerr, Y., et al., 2012. The SMOS soil moisture retrieval algorithm. IEEE Transactions on Geoscience and Remote Sensing, 50, 1384–1403. doi:10.1109/TGRS.2012.2184548
- Lacava, T., et al., 2012a. A first assessment of the SMOS soil moisture product with in-situ and modelled data in Italy and Luxembourg. IEEE Transaction on Geoscience and Remote Sensing, 50 (5), 1612–1622. doi:10.1109/TGRS.2012.2186819
- Lacava, T., et al., 2012b. A multisensor (SMOS, AMSR-E and ASCAT) satellite-based soil moisture products inter-comparison. In: Proceedings of Geoscience and Remote Sensing Symposium (IGARSS), 2012 IEEE International, 1135–1138. doi:10.1109/IGARSS.2012.6351348.
- Leroux, D.J., et al., 2013. Comparison between SMOS, VUA, ASCAT, and ECMWF soil moisture products over four watersheds in U.S. IEEE Transactions on Geoscience and Remote Sensing, 52 (3), 1562–1571. doi:10.1109/TGRS.2013.2252468
- Loew, A., 2008. Impact of surface heterogeneity on surface soil moisture retrievals from passive microwave data at the regional scale: the upper Danube case. Remote Sensing of Environment, 112 (1), 231–248. doi:10.1016/j.rse.2007.04.009
- Loew, A. and Schlenz, F., 2011. A dynamic approach for evaluating coarse scale satellite soil moisture products. Hydrology and Earth System Sciences, 15 (1), 75–90. doi:0.5194/hess-15-75-2011. doi:10.5194/hess-15-75-2011
- Martínez-Fernández, J. et al., 2007. Evolución de la humedad del suelo bajo diferentes tipos de cubierta vegetal de la cuenca del Duero. In: J.V. Giráldez Cervera and F.J. Jiménez Hornero, et al., eds. Estudios de la Zona No-Saturada del Suelo Vol. VIII. Córdoba (España): Universidad de Córdoba, 275–280.
- Martínez-Fernández, J. and Ceballos, A., 2003. Temporal stability of soil moisture in a large-field experiment in Spain. Soil Science Society of America Journal, 67, 1647–1656. doi:10.2136/sssaj2003.1647
- Martínez-Fernández, J. and Ceballos, A., 2005. Mean soil moisture estimation using temporal stability analysis. Journal of Hydrology, 312, 28–38. doi:10.1016/j.jhydrol.2005.02.007
- Masson, V., et al., 2003. A global data base of land surface parameters at 1 km resolution in meteorological and climate models. Journal of Climate, 16 (9), 1261–1282. doi:10.1175/1520-0442-16.9.1261
- Mironov, V.L., Kosolapova, L.G., and Fomin, S.V., 2009. Physically and mineralogically based spectroscopic dielectric model for moist soils. IEEE Transactions on Geoscience and Remote Sensing, 47 (7), 2085–2085. doi:10.1109/TGRS.2008.2011631
- Moran, M.S., et al., 2004. Estimating soil moisture at the watershed scale with satellite-based radar and land surface models. Canadian Journal of Remote Sensing, 30 (5), 805–826. doi:10.5589/m04-043
- Ochsner, T., et al., 2013. The state of the art in large-scale soil moisture monitoring. Soil Science Society of America Journal, 77 (6), 1888–1919. doi:10.2136/sssaj2013.03.0093
- Piles, M., et al., 2011. Downscaling SMOS-derived soil moisture using MODIS visible/infrared data. IEEE Transactions on Geoscience and Remote Sensing, 49 (9), 3156–3166. doi:10.1109/TGRS.2011.2120615
- Rawls, W.J., Brakensiek, D.L. and Saxton, K.E., 1982. Estimation of soil water properties. Transaction of the ASAE, 25(5), 1316–1320.
- Reichle, R., et al., 2004. Global soil moisture from satellite observations, land surface models and ground data: Implications for data assimilation. Journal of Hydrometeorology, 5, 430–442. doi:10.1175/1525-7541(2004)005<0430:GSMFSO>2.0.CO;2
- Reichle, R.H. and Koster, R.D., 2004. Bias reduction in short records of satellite soil moisture. Geophysical Research Letters, 31 (L19501), 1–4. doi:10.1029/2004GL020938
- Release note of the SMOS level 2 v. 5.51 Soil Moisture data products, 2013. Available from: https://earth.esa.int/documents/10174/118493/L2SMv551_release_note_2013-08-09.pdf
- Robinson, D.A., et al., 2008. Soil moisture measurement for ecological and hydrological watershed-scale observatories: A review. Vadose Zone Journal, 7, 358–389. doi:10.2136/vzj2007.0143
- Rötzer, K., et al., 2012. Time series analysis of SMOS and ASCAT: soil moisture product validation in the Rur and Erft catchments. In: Proceedings of Geoscience and Remote Sensing Symposium (IGARSS), 2012 IEEE International, 3716–3719. doi:10.1109/IGARSS.2012.6350510.
- Rötzer, K., et al., 2014. Catchment scale validation of SMOS and ASCAT soil moisture products using hydrological modelling and temporal stability analysis. Journal of Hydrology, 519, 934–946. doi:10.1016/j.jhydrol.2014.07.065
- Rüdiger, C., et al., 2009. An intercomparison of ERS-SCAT and AMSR-E soil moisture observations with model simulations over France. Journal of Hydrometeorology, 10 (2), 431–447. doi:10.1175/2008JHM997.1
- Sánchez, N., et al., 2010. Combining remote sensing and in situ soil moisture data for the application and validation of a distributed water balance model (HIDROMORE). Agricultural Water Management, 98, 69–78. doi:10.1016/j.agwat.2010.07.014
- Sánchez, N., et al., 2012a. Validation of the SMOS L2 soil moisture data in the REMEDHUS network (Spain). IEEE Transactions on Geoscience and Remote Sensing, 50 (5), 1602–1611. doi:10.1109/TGRS.2012.2186971
- Sánchez, N., et al., 2012b. Spatial patters of SMOS downscaled soil moisture maps over the REMEDHUS network (Spain). In: Proceedings of Geoscience and Remote Sensing Symposium (IGARSS), 2012 IEEE International, 714–717. doi:10.1109/IGARSS.2012.6351465.
- Sánchez-Ruiz, S., et al., 2014. Combining SMOS with visible and near/shortwave/thermal infrared satellite data for high resolution soil moisture estimates. Journal of Hydrology, 516, 273–283. doi:10.1016/j.jhydrol.2013.12.047
- Schlenz, F., et al., 2012. Uncertainty assessment of the SMOS validation in the Upper Danube catchment. IEEE Transactions on Geoscience and Remote Sensing, 50, 1517–1529. doi:10.1109/TGRS.2011.2171694
- Schmugge, T.J., et al., 2002. Remote sensing in hydrology. Advances in Water Resources, 25 (8–12), 1367–1385. doi:10.1016/S0309-1708(02)00065-9
- Scipal, K., Drusch, M., and Wagner, W., 2008. Assimilation of a ERS scatterometer derived soil moisture index in the ECMWF numerical weather prediction system. Advances in Water Resources, 31 (8), 1101–1112. doi:10.1016/j.advwatres.2008.04.013
- Tavakoli, M. and De Smedt, F., 2013. Validation of soil moisture simulation with a distributed hydrologic model (WetSpa). Environmental Earth Sciences, 69, 739–747. doi:10.1007/s12665-012-1957-8
- UNEP, 1997. World Atlas of Desertification. United Nations Environment Programme. Nairobi. 182 pp.
- Vereecken, H., et al., 2013. On the spatio-temporal dynamics of soil moisture at the field scale. Journal of Hydrology, 516, 76–96. doi:10.1016/j.jhydrol.2013.11.061
- Vinnikov, K.Y., et al., 1996. Scales of temporal and spatial variability of midlatitude soil moisture. Journal of Geophysical Research, 101 (D3), 7163–7174. doi:10.1029/95JD02753
- Wagner, W., et al., 2007. Operational readiness of microwave remote sensing of soil moisture for hydrologic applications. Nordic Hydrology, 38 (1), 1–20. doi:10.2166/nh.2007.029
- Wanders, N., et al., 2012. Observations uncertainty of satellite soil moisture products determined with physically-based modelling. Remote Sensing Environment, 127, 341–356. doi:10.1016/j.rse.2012.09.004
- Wanders, N., et al., 2014. The benefits of using remotely sensed soil moisture in parameter identification of large-scale hydrological models. Water Resource Research, 50 (8), 6874–6891. doi:10.1002/2013WR014639
- Wigneron, J.P., et al., 2004. Soil moisture retrievals from biangular L-band passive microwave observations. IEEE Transactions on Geoscience and Remote Sensing, 1 (4), 277–281. doi:10.1109/LGRS.2004.834594
- Wigneron, J.P., et al., 2007. L-band microwave emission of the biosphere (L-MEB) model: description and calibration against experimental data sets over crop fields. Remote Sensing of Environment, 107 (4), 639–655. doi:10.1016/j.rse.2006.10.014
- Willmott, C.J., 1982. Some comments on the evaluation of model performance. Bulletin of the American Meteorological Society, 63, 1309–1313. doi:10.1175/1520-0477(1982)063<1309:SCOTEO>2.0.CO;2