
ABSTRACT
We investigated dam behaviours during high-flow events and their robustness against perturbations in meteorological conditions using the H08 global hydrological model. Differences in these behaviours were examined by comparing simulation runs, with and without dams and using multiple meteorological datasets, at a case-study site, Fort Peck Dam on the Missouri River, USA. The results demonstrated that dam-regulated river flow reduced temporal variability over large time periods and also dampened inter-forcing discrepancies in river discharge (smoothing effects). However, during wet years, differences in peak flow were accentuated downstream of the dam, resulting in divergence in simulated peak flow across the meteorological forcing (pulsing effect). The pulsing effect was detected at other major dams in global simulations. Depending upon the meteorological forcing, the dams act as a selective filter against high-flow events. Synergy between a generic dam scheme and differences in meteorological forcing data might introduce additional uncertainties in global hydrological simulations.
Editor R. Woods; Associate editor H. Kreibich
1 Introduction
Humans have constructed dams and reservoirs to reduce riverine disasters and enhance water supply security. To date, it is estimated that 16.7 million dams with a total storage capacity of 8070 km3 have been constructed globally (Lehner et al. Citation2011a). The storage capacity corresponds to approximately 18% of the annual global runoff (45 500 km3/year; Oki and Kanae Citation2006) and four times the mean annual water storage in riverine channels (2000 km3; Oki and Kanae Citation2006). As reservoir water storage is too large to neglect, efforts have been made to unlock the effects of reservoirs on the global hydrological cycle. One approach is to incorporate reservoirs into global hydrological models (GHMs).
In this context, a number of GHMs have incorporated dam operation algorithms that simulate actual dam operation (Hanasaki et al. Citation2008a, Döll et al. Citation2009, Biemans et al. Citation2011, Wada et al. Citation2011), after the use of generic dam operation algorithms was proposed (Haddeland et al. Citation2006, Hanasaki et al. Citation2006). Voisin et al. (Citation2013) investigated the regional application of a generic dam operation algorithm by applying it to the Columbia River Basin. The authors demonstrated that the optimal parameterization of the generic algorithm performed well once appropriately calibrated for local requirements. However, river discharge simulated with dams has not yet been closely analysed or validated due to three major obstacles. First, publicly available information on dam operation and historical observation records are lacking. Second, dam operation rules may vary annually. Dam operation rules are determined by a variety of conditions such as reservoir storage, downstream water use, weather, and other conditions. The annual variability of these conditions makes it difficult to develop or infer actual dam operations. Third, most GHMs are not calibrated, and the results include errors and biases. This is primarily due to a lack of quality-controlled river discharge data for river basins globally. The reproducibility of dam operation at reservoirs was reported by Hanasaki et al. (Citation2006), Haddeland et al. (Citation2006), and Döll et al. (Citation2009) using a single meteorological forcing dataset. Comparisons across different meteorological forcing datasets have been performed focusing on historical energy and water balances on land (Dirmeyer et al. Citation2006), past and future water balances or river discharge (Oki et al. Citation1999, Haddeland et al. Citation2011, Hagemann et al. Citation2013, Schewe et al. Citation2014), irrigation water (Wada et al. Citation2013), and industrial and domestic water (Wada et al. Citation2016). However, dam behaviours implemented in GHMs and dam robustness against different volumes of inflow into dams have not been closely examined.
Regarding dam behaviours, global hydrological simulations play a substantial role in assessing future high-flow risks because some regions are projected to experience heavier precipitation events in the future due to global warming (e.g. Bindoff et al. Citation2013). Global-scale simulations have been utilized to evaluate such risks; however, they were based on natural river flow without dam regulation (e.g. Hirabayashi et al. Citation2013, Dankers et al. Citation2014). Voisin et al. (Citation2013) reported in their regional analysis that a target for flood control storage set in one generic dam algorithm was a major error source in hydrological simulations. Because one fundamental function of dams is preventing disastrous high flow by cutting peak flow, it would be more practical to conduct hydrological simulations using dams to assess high-flow events under a given social infrastructure. It is effective to retrieve the effects of dams from simulated river discharge by comparing two simulation runs: one with dams and one without. Regarding dam robustness, because multiple meteorological datasets and multiple climate projection datasets are available for historical and future periods, respectively, uncertainties in meteorological forcing datasets are anticipated. Differences in meteorological conditions over the catchment area of a dam across the datasets can result in differences in inflow into the dam. Moreover, future simulation runs are also subject to differences in meteorological forcing because each global circulation model has different climate projection characteristics. Different dam behaviours caused by meteorological forcing were reported by Masaki et al. (Citation2017) in a study of multi-forcing simulations. However, because they analysed dam behaviours only for normal-year conditions, behaviours during other characteristic periods (e.g. high-flow seasons) remain unknown. Since dams have a vast variety of functions designed to meet local requirements, dam behaviour should first be examined for a specific case-study site.
This study focused on dam operation simulations from a single GHM, H08 (Hanasaki et al. Citation2008a, Citation2008b), using four separate meteorological datasets to consider uncertainties in meteorological input data. As a case study, we focused on Fort Peck Dam on the Missouri River, Montana, USA, because this dam is a rare case in which both operation records and downstream river discharge have been recorded over a long period. We investigated a number of aspects related to model performance to answer two research questions: (1) How does a generic dam algorithm influence river discharge (especially during high-flow events) simulated by GHMs; how sensitive are the models to meteorological inputs; and how well does the algorithm describe the spread of river discharge simulated with multiple meteorological forcing datasets? and (2) Were characteristics of the study site commonly observed at other dam sites? This is because a generic dam algorithm conceptually represents common dam behaviours. This study was conducted within the framework of the Inter-Sectoral Impact Model Intercomparison Project, Phase 2a (ISIMIP2a; Warszawski et al. Citation2014) at a resolution of 0.5° × 0.5°.
Datasets and the analysis methods are discussed in Section 2. The results of the case-study site and global major dam sites are presented in Sections 3 and 4, respectively. The performance and potential problems in simulating regulated river flows are then discussed in Section 5.
2 Data and method
2.1 Historical meteorological data
All hydrological simulations under the given meteorological conditions followed the protocol outlined in ISIMIP2a (ISIMIP Citation2015). Four historical meteorological datasets were used in this study, including GSWP3 (Kim Citation2014), Princeton PGMFD ver2 (Sheffield et al. Citation2006), WFDEI.gpcc (Weedon et al. Citation2014), and WATCH (Weedon et al. Citation2010). Hereafter, these datasets are referred to as GSWP3, PGFv2, WFDEI, and WATCH, respectively. These datasets were compiled from independent observation records and re-analysis products. Specifically, the precipitation data were compiled from the Global Precipitation Climatology Centre (GPCC) (Schneider et al. Citation2014) and/or CRU, University of East Anglia (New et al. Citation1999, Mitchell and Jones Citation2005). Descriptions of the datasets are listed in . As such, they are expected to contain different values that have the potential to impact hydrological simulations. The characteristics of the datasets have been summarized by Müller Schmied et al. (Citation2016), who highlighted differences in the chronological decadal trends in temperature, precipitation, and subsequent simulated hydrological variables (discharge and actual evapotranspiration).
Table 1. Meteorological datasets used in this study. These datasets were re-gridded and distributed by the Inter-Sectoral Impact Model Intercomparison Project (ISIMIP).
In this study, we used daily mean air temperature, rainfall, snowfall, sea-level pressure, relative humidity, shortwave downward radiation, longwave downward radiation, and wind speed. Because only precipitation data were available for GSWP3 and PGFv2, the rain–snow partition was calculated using the procedure from Yasutomi et al. (Citation2011).
2.2 Hydrological simulations
The H08 GHM solves both the water and energy balances on the land surface with a daily time step at 0.5° × 0.5° resolution (Hanasaki et al. Citation2008a, Citation2008b). The analysis period was 1971–2000. However, the model was spun up from 1901 to stabilize hydrological state variables at the start of the modelling period. H08 consists of six sub-models (land surface hydrology, river routing, crop growth, water abstraction, reservoir operation, and environmental flow requirement).
The land surface hydrology sub-model solves the water and energy balances. Water infiltrates into the 1-m soil layer. The evapotranspiration calculation is described in Supplementary material S1. Runoff is defined as the sum of the surface and subsurface (water flowing out of the soil) runoff. Subsurface runoff is a function of soil moisture content. Hydrological parameters were not calibrated by observation because river discharge simulated by most GHMs is uncalibrated (Hattermann et al. Citation2017, Masaki et al. Citation2017). Two experiments with and without human influence, referred to as “varsoc” and “nosoc”, respectively, were made to examine the human effects on river discharge. In the varsoc runs, time-varying human impacts, such as an expansion of the irrigated area, construction of dams, and increases in municipal and industrial water uses, were included in the simulation (Inter-Sectoral Impact Model Intercomparison Project Citation2015).
Dam operations were based on the algorithm by Hanasaki et al. (Citation2006), who proposed two operational modes: proportional-to-demand and independent-from-demand. In the former mode, dams release a large amount of water downstream to meet seasonally changing water demand (e.g. for agricultural cropping). However, real dams do not necessarily operate for a single purpose. For simplicity, we therefore assumed the independent-from-demand mode for all dams. In general, dam operation removed the temporal variation in downstream river flow, particularly at time scales shorter than annual. This condition is modelled by a scheme in which dams regulate the river flow such that a dam releases water at the rate of the annual mean discharge. The regular release, R (m3/s), of a dam for an operational year is assumed to be given by:
where Sinit (m3) is the storage at the beginning of the operational year, C (m3) is the storage capacity of the dam, and Imean (m3/s) is the mean annual flow. The dam was defined to have a constant release (R) except when the storage was depleted or there was overflow (the overflowed volume was added to R). Dam specifications, such as location, storage capacity, and construction year, were provided from the ISIMIP, which were originally based on GRanD ver.1.1 (Lehner et al. Citation2011a, Citation2011b). In total, 6863 dams (6862 dams from GRanD and Fort Randall Dam) were considered for the global simulations.
The water abstraction sub-model calculated irrigation and municipal and industrial river water abstraction from rivers. We assumed that irrigation water was supplied to irrigated cropland when the soil water content was <75% of field capacity, except for the case of rice (100%). We considered time-varying crop cultivation for 13 of the 14 crop types (pasture excluded). Crop growth was internally calculated under the given meteorological conditions. The geographical distribution of cultivated crops and irrigated area at the year 2000 was provided by MIRCA2000 (Portmann et al. Citation2010). The historical annual distribution change was derived from HYDE3.1 (Goldewijk et al. Citation2011). Municipal and industrial water was based on Yoshikawa et al. (Citation2014).
2.3 Local analysis: case study of Fort Peck Dam on the Missouri River
We took a two-step approach to examine the behavioural characteristics of dam regulation within the global hydrological simulations. First, we analysed the overall characteristics of regulated river flow for a simulated case study on Fort Peck Dam. Then, we examined global characteristics of flow regulation by major dams.
Local analysis allowed for specification of the dominant processes or mechanisms with regard to the observed phenomena. In this study, Fort Peck Dam on the Missouri River, Montana, USA (Supplementary Fig. S1), was chosen because both historical river discharge and dam operation records were available. Moreover, Fort Peck Dam is located at the uppermost reach on the river (Supplementary Table S1) and has a significant impact on river flow due to its large storage capacity (2.356 × 10¹⁰ m3) relative to the annual river discharge (3.940 × 10⁹ m3; observed dam release data for 1970–1999). Due to these factors, it was considered suitable for an analysis of dam regulation effects on regulated river discharge for the observed and simulated results.
To follow the flow along the river channel, we numbered land cells along the main channel from upstream to downstream (sequential cell numbers, SCNs), after Masaki et al. (Citation2017) (see Supplementary Fig. S1). Major dams and gauging stations on the Missouri River are summarized in the Supplementary material (Tables S1 and S2). The observed discharge data were collected from US Geological Survey (USGS) archives and the World Meteorological Organization (WMO) Global Runoff Data Centre (GRDC). Historic dam operation data obtained by the US Army Corps of Engineers (Northwest Division) were also utilized.
2.4 Global analysis
Dams dampen the temporal variation of river flow and reduce peak-flow events to prevent disasters. We introduced metrics to quantify these two characteristics.
2.4.1 Effects of dams on temporal variability of river discharge
First, we evaluated the extent of temporal river discharge dampening at dam sites from human influences (dam regulation and water withdrawal). Temporal variation was quantified by the coefficient of variation (CV) from daily discharge data for 30 years. To quantify human influence, we evaluated the ratio of the CV for regulated river discharge (varsoc runs), CVvar, to the CV for natural river discharge (nosoc runs), CVno, hereafter CVR. Thus, at land cell j where the dam is located, CVR is given by:
The CVR is quantified for each meteorological forcing dataset. Because water abstraction or tributary confluences can alter the absolute quantity of river discharge, we used the CV, the variability normalized by the mean river discharge, rather than the standard deviation.
2.4.2 Regulation of peak flow through dams along channels
Next, we examined the extent of peak-flow regulation from a discharge comparison at two land cells before and after dam regulation (on the same river channel) for each dam site. The two land cells were: (a) the adjacent upstream cell (u), just before the flow was regulated, and (b) the land cell that included the dam (j), just after the flow was regulated. We also evaluated differences in peak-flow regulation from different meteorological forcing data inputs. Differences between the meteorological forcing data were also analysed. We selected 47 major dam sites throughout the world using the following criteria: (i) the dam was located on major river channel cells (defined in Masaki et al. Citation2014), (ii) the storage of the dam was >5 × 10⁹ m3 to neglect the effect of water abstraction, and (iii) there were no tributary confluences between the upstream land cell and the dam.
First, we extracted dry and wet years from 1971–2000 at each dam site by selecting five calendar years that maintained the smallest and largest annual discharge at the adjacent upstream cells, respectively. We made this choice because analysis of contrasting conditions (e.g. dry and wet years) is beneficial for clearly detecting effects during the wet years, when high-flow events are expected to occur more frequently. We explain only the five driest years (subscript d5) here; however, a similar discussion holds true for the five wettest years (w5). We then evaluated Q5 (daily discharge exceeded 5% of the five dry years; used as a high-flow indicator) for each meteorological forcing dataset. The CV (denoted as CVd5) was then calculated across the four forcing datasets at each of the land cells for all dam sites. If CVd5 decreased in a downstream direction (CVd5(u) > CVd5(j)), then the spread in high flow among the meteorological forcing data was damped at the dam site. In contrast, if CVd5 increased in the downstream direction (CVd5(u) < CVd5(j)), the spread in high flow was magnified. We use CV instead of standard deviation for cells u and j to account for changes in the magnitude of discharge due to local runoff or water abstraction between the two cells.
2.4.3 Characteristics of regulated river flow during overflow
Heavier than normal rainfall maintains high dam storage. If a dam is full, the dam can no longer regulate river flow. These situations also affect river flow downstream of the dam. We evaluated the frequency of overflow events from simulations with different meteorological forcing inputs. Overflow was judged when simulated dam storage S was greater than or equal to 99% of the dam capacity C (S ≥ 0.99C).
3 Results: Fort Peck Dam case study
3.1 Preliminary analysis of hydrographs at Fort Peck
First, we analysed the characteristics of simulated hydrographs at Fort Peck Dam for 1971–1980. ) and (b) displays hydrographs before (at the upstream land cell, SCN 21) and after (at SCN 22 where the dam is located) flow regulation, respectively. ) displays the hydrographs with and without human influence (both flow regulation and water abstraction) at SCN 22. Simulations demonstrated well-known dam functions (i.e. regulated river discharge with flattened temporal variation).
Figure 1. Simulated hydrographs at Fort Peck Dam for the period 1971–1980: (a) before flow regulation at SCN 21 (land cell upstream of the dam), and (b) after flow regulation at SCN 22 (location of the dam). Meteorological forcing datasets GSWP3, PGFv2, WFDEI, and WATCH are indicated as different coloured lines (purple, red, blue, and green lines, respectively). (c) Hydrographs with (solid line) and without (dashed) human influence on river flow at SCN 22 for the GSWP3 dataset. Blue- and orange-shaded years represent, respectively, the five wettest and five driest years in the period 1971–2000.
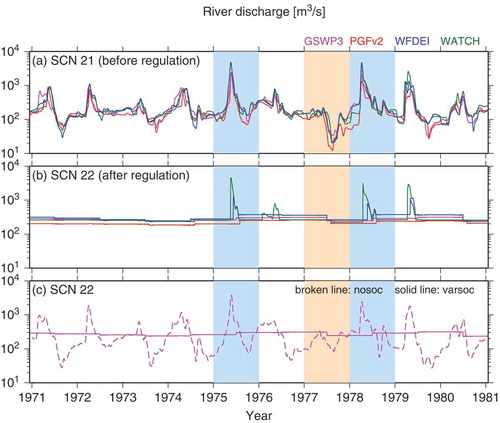
From a viewpoint of flow regulation under multi-forcing simulations, several characteristic features were present in the hydrographs:
Different meteorological forcing inputs produced different natural river flows prior to flow regulation, but with synchronous time variation ()).
) shows that regulated river discharge displayed a reduction in temporal variability (smoothing effect by the dam); however, some peak-flow events were nonetheless observed and their amplitudes were markedly different between the four meteorological forcing datasets (pulsing effect of the dam or an occasional magnification in the discharge variation among different meteorological forcings (we examine the pulsing effect in detail in Section 3.3). Peak-flow events were primarily observed in wet years when the annual river discharge was larger than normal years. In the catchment area of Fort Peck Dam, the WATCH and WFDEI datasets displayed higher peaks than the other forcing datasets.
If human influences were not exerted on river flow at this reach, then the temporal variability at SCN 21 ()) was well preserved in that at SCN 22 (broken line in )).
When the CVR metric was implemented for Fort Peck Dam, where CVno = 1.015 and CVvar = 0.131, then CVR = 0.129 for the GSWP3 dataset. The time series of natural and regulated river discharge along the river course under each meteorological forcing dataset are shown in Supplementary Figures S4–S7. Similarly, CVR values were 0.118 for PGFv2, 0.119 for WFDEI, and 0.610 for WATCH. WATCH had a higher CVR value than the other datasets, implying large temporal variability of regulated river flow over a 30-year time span (see Supplementary Fig. S7).
3.2 Behaviours mitigating peak flow across multiple meteorological forcing datasets
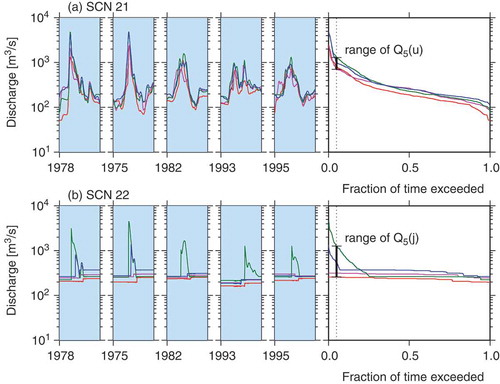
The introduction of CVw5 in Section 2.4.2 quantified the spread of peak flow between the meteorological forcing datasets. The five wettest years (1975, 1978, 1982, 1993, and 1995) and the five driest years (1977, 1987, 1988, 1994, and 2000) in the period 1971–2000 were determined from the simulated annual discharge at SCN 21 (see also blue- and orange-shaded years in ). We determined Q5 and its CVw5 at SCN 21 (u) and SCN 22 (j) for each meteorological dataset ( and ) from an analysis of simulated daily discharge of the five wettest years. The range of Q5(j) was larger than that of Q5(u), as shown in . Therefore, CVw5(u) < CVw5(j), demonstrating that dams magnified the differences in peak-flow discharge between meteorological forcing datasets. also shows that both CVw5 and CVd5 increased downstream and CVw5 at SCN 22 displayed a high value (0.6807).
Table 2. Values of Q5 (m3/s) for the five wettest and driest years in the period 1971–2000 at Fort Peck Dam. SCN 21 and SCN 22 correspond, respectively, to the land cells before (i.e. upstream) and after (i.e. where the dam is located) flow regulation. See also . CV: coefficient of variation.
Figure 2. Schematic explanation of CVw5(u) and CVw5(j) at (a) SCN 21 and (b) SCN 22 at Fort Peck Dam. Meteorological forcing datasets are indicated as different coloured lines (see caption). The five left-hand panels display simulated hydrographs for the five wet years (in order from high to low annual discharge) for each site. The right panel displays the flow–duration curves for the same five years. The vertical dotted line shows 5% of the total period. The range of Q5 is indicated by an error bar.
3.3 Overflow behaviour
As the characteristic flow regulation feature (b) was clearly detected in wet years (), we focused on the reservoir storage and outflow from Fort Peck Dam to understand the cause. The results are shown in .
Figure 3. (a) Discharge and (b) reservoir storage at Fort Peck Dam for four meteorological forcing datasets. Simulated storage from the GSWP3, PGFv2, WFDEI, and WATCH datasets is indicated as different coloured lines (see ). The black line is observed storage (1971–1999). Blue- and orange-shaded years represent, respectively, the five wettest and five driest years in the period 1971–2000. The wettest and driest years were determined from the annual river discharge at SCN 21.
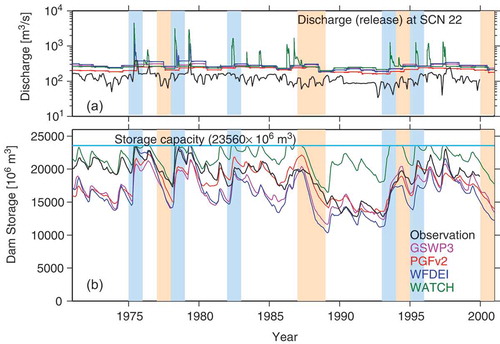
Although all storage simulations under the four forcing datasets varied synchronously with time, their values showed considerable spread between the forcing datasets. These differences were due to the cumulative effect of small biases in the simulated dam inflow under the differing meteorological inputs. The simulated water storage of Fort Peck Dam for the WATCH dataset was greater than for the other datasets, indicating that overflow was likely at Fort Peck Dam for the WATCH dataset, consistent with results reported in the previous section (Supplementary Fig. S14).
also shows that storage approached capacity during the wet years (blue-shaded years), whereas the storage decreased during the dry years (orange-shaded years). Although not all wet years created dam overflow, the frequency of overflow was higher during wet years than dry years. In fact, peak-flow events ()) with the WATCH dataset corresponded to the period of storage closest to reservoir capacity ()). This confirmed that the peak-flow events in 1975, 1978, and 1979 (shown in )) were attributable to overflow. During the 1975 peak event, all simulations showed an increase in water storage and approached reservoir storage capacity (2.356 × 10¹⁰ m3). The simulated storage with the WATCH dataset was the highest. The GSWP3 and PGFv2 datasets maintained a high storage level with no overflow events.
The observed discharge from Fort Peck Dam doubled or tripled relative to the normal discharge level during high-flow events, but did not show spikes (i.e. surges of outflow greater than 10 times the normal outflow) as seen in WATCH ()). Therefore, such surge overflow was artificially created in hydrological simulations under given meteorological conditions. These simulations are discussed in Section 5.1.
Biases existed between the observed data and the simulated water storage simulations for 1970–1974 due to the cumulative effect of data biases. The biases decreased after the 1975 high-flow event. An excess volume of water that is greater than reservoir capacity must overflow the dam. Due to this, the observed and simulated storage also approached reservoir capacity, which resulted in a reduced bias.
The simulated annual mean discharge has biases with respect to the observed annual mean discharge, partly due to the uncalibrated runoff results of the land surface hydrology sub-model. Since GHMs are usually uncalibrated (see Section 1), we ran our model under the same conditions in this study.
Lastly, we would like to summarize the pulsing effect. The pulsing effects, which are observed in multi-forcing hydrological simulations, are defined as divergence in simulated river discharge across different meteorological forcing datasets just after dam regulation, when numerical overflow occurs for some meteorological forcing datasets and not for others. Different storage levels, caused by cumulative biases in storage across forcing datasets, affect regulation efficiency.
3.4 Characteristic behaviour during high-flow events: consequence of overflow downstream of the dam
Overflow formed pulse-like events visible in hydrographs. shows the observed and simulated river discharge at gauge stations along the river upstream to downstream. At upstream gauge stations on the Missouri River (SCNs 13 and 16) during the events in 1975, the model displayed peak discharge in spring, regardless of the meteorological forcing datasets. There was a difference in magnitude of the peak discharge between the datasets. After the peak-flow event arrived at Fort Peck Dam (SCN 22), it continued to propagate to the lower reach for the WATCH and WFDEI datasets. For the WATCH dataset, the peak event lasted for 69 days and the total river discharge was 8.89 × 10⁹ m3 (corresponding to 37.7% of the storage capacity of the dam). For the WFDEI dataset, total river discharge was 2.57 × 10⁹ m3 (10.9%) during a 42-day peak event. This was contrasted by the GSWP3 and PGFv2 datasets. These datasets displayed minimal increases during the same period. The observed release data displayed no peak flow during the events (dotted line in the SCN 22 panel in ). The pulse-like features propagated downstream under the WATCH and WFDEI datasets.
Figure 4. Simulated hydrographs along the Missouri River using H08 (varsoc run) under four meteorological forcing datasets. The panels are ordered from upper to lower reaches. The observed dam release is indicated as black dots. See caption for further explanation, and Supplementary Figure S1 for the sequential cell numbers (SCNs) along the river.
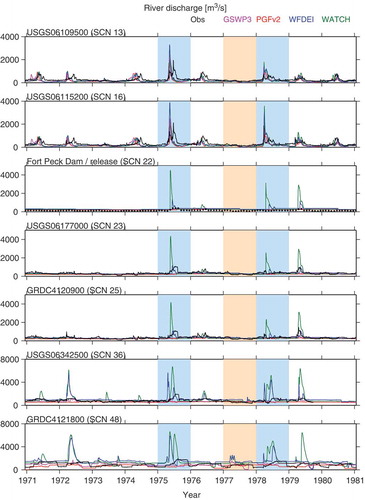
These results demonstrate that dams act as a filter to selectively release high-flow events and affect downstream peak-flow discharge over long distances. We refer to this as the “filtering effect”. Even if the dam inflow differed between meteorological datasets, these differences were typically absorbed by the dams during most of the simulation period while the dams acted to smooth native temporal discharge variability. However, during high-flow events, the dams could not always absorb the differences in high-flow events. Peak flow was completely absorbed by the dams under some meteorological datasets; in other datasets, the events passed through the dams. If the dam was full, additional inflow was released downstream without regulation. As a result, the filtering effect of dams magnified peak-flow differences between meteorological forcing datasets. Due to the disparity in data input between the meteorological forcing datasets, high-flow events were expected to have larger discrepancies than the normal flow state.
We quantified Q5 metrics for 1971–1980. shows that Q5 had a larger spread (see CV) between the meteorological forcing datasets downstream of Fort Peck Dam than upstream. Such a stepwise increase in the CV of Q5 discharge at a dam site indicates that the pulsing effect occurred in the simulations under some sets of meteorological forcing.
Table 3. Values of Q5 (m3/s) at the gauge stations on the Upper Missouri River, evaluated from daily data for the period 1971–1980. SCN numbers correspond to those in Supplementary Figure S1. Nr.: near; Obs.: observation; CV: coefficient of variation, calculated as the standard deviation of the four Q5 values under the four meteorological forcing datasets divided by the ensemble mean of the forcing datasets.
The natural river discharge (Supplementary Figs S4–S7) displayed the 1975 peak-flow event passing Fort Peck Dam (SCN 22). The simulated natural river discharge was substantially divergent from the observed discharge. This supports the integration of dam operation schemes to accurately simulate discharge in systems such as the Missouri River.
If the sources of error are tracked back through the modelling chain, differences in precipitation intensity created differences in simulated runoff intensity, resulting in deviation in simulated river discharge as inflow to the dam (Supplementary Figs S2 and S3). The results of land processes over the catchment area using the four meteorological datasets are summarized in the Supplementary material.
4 Results: consequences of including the dam operation algorithm
We examined characteristic behaviours of dams () in numerical simulations for Fort Peck Dam. Because the generic dam operation algorithm conceptually represents common dam regulation characteristics, it is natural to consider that dams behave in a similar manner at other sites globally. In this section, we attempt to determine whether similar characteristics of the generic dam algorithm are commonly observed at different dam sites in global hydrological simulations.
4.1 Flattening variation in river discharge
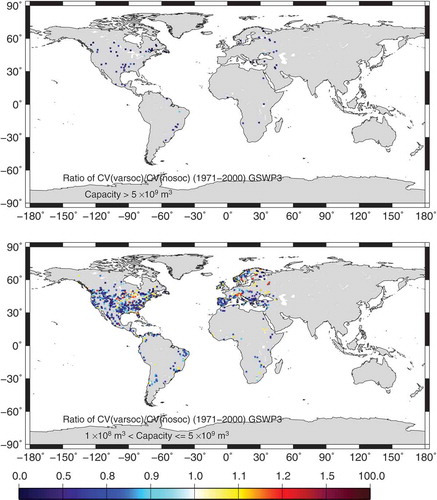
Changes in temporal variability at dam sites from human influence were evaluated with the CVR for different classes of dam capacity (). Large dams with a capacity >5 × 10⁹ m3 dampened the temporal variability of the hydrological response and displayed CVR values far less than unity. The majority of the smaller dams with a capacity between 1 × 10⁸ and 5 × 10⁹ m3 displayed CVR values <1. These values were higher than those at large dams due to other human influences. These features were also observed for all other meteorological datasets (Supplementary Figs S8–S10).
Figure 5. CVR at dam sites with the GSWP3 forcing dataset for dams with capacity >5 × 10⁹ m3 (top) and between 1 × 10⁸ and 5 × 10⁹ m3 (bottom).
4.2 Differences in dam regulation responses in dry and wet years
To examine whether dams acted to diminish or augment the spread in peak-flow discharge between meteorological forcing datasets, we evaluated CVd5 and CVw5 at 47 global major dam sites. For dry years (), both an increasing (CVd5 increased downstream) and decreasing (CVd5 decreased downstream) spread of high flows were observed. The number of sites that displayed a decrease in CVd5 was slightly greater than those that displayed an increase in CVd5 for dry years ().
Table 4. Number of dam sites where CV increases and decreases downstream. The four regions coincide with the maps shown in and . Increases in CV indicate CV(u) < CV(j), whereas decreases in CV indicate CV(u) > CV(j). Subscripts d5 and w5 correspond to the five dry years and the five wet years, respectively.
Figure 6. CVd5 at 47 major dam sites. Increasing and decreasing downstream CVd5 values are represented by red upward and blue downward triangles, respectively.
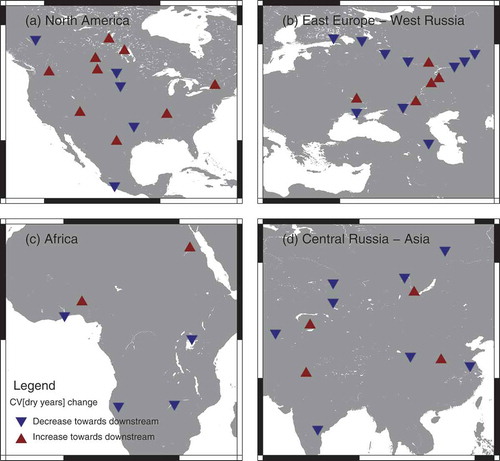
Figure 7. CVw5 at 47 major dam sites. Increasing and decreasing downstream CVw5 values are represented by red upward and blue downward triangles, respectively.
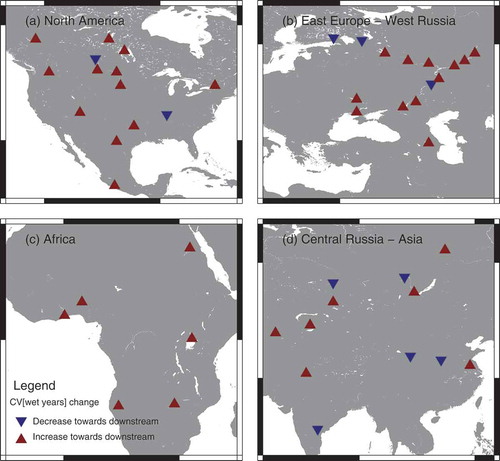
For wet years, the CVw5 increased downstream at most dam sites due to dam regulation (). Of 47 dam sites, 37 had an increasing CVw5 downstream, suggesting that the majority of dams magnified the spread of high-flow discharge between meteorological forcing datasets (). This agreed with the results from the Fort Peck Dam case study ( and ), where an increase in spread in peak-flow discharge between meteorological datasets due to high levels of dam storage for wet years was observed. Although this contradicted the dampening effect of dams on discharge variation, dams have a reduced regulatory function against high-flow events. This was also present for large dams (capacity: >5 × 10⁹ m3) in wet years.
4.3 Frequency of overflow events at dams
displays the frequency of overflow events (total number of months of dam overflow to the total number of months after dam construction for the period 1971–2000) from the GSWP3 dataset. In general, most dams rarely had numerical overflow events, and smaller dams displayed higher rates of numerical overflow than larger dams.
Figure 8. Overflow frequency at major dam sites from the GSWP3 forcing dataset for dams with capacity >5 × 10⁹ m3 (top) and >1 × 10⁷ m3 (bottom).
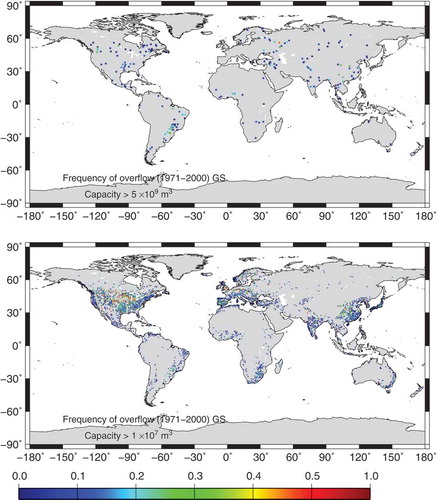
Supplementary Figures S11–S14 display the anomaly of the overflow frequency of each meteorological forcing dataset relative to the mean frequency of all forcing datasets. The WATCH dataset had the highest frequency among all datasets, even for the large dam class (capacity: >5 × 10⁹ m3). The WATCH dataset also displayed a regional inhomogeneity: a higher frequency in high latitudes and mountainous areas than in tropical and subtropical areas. PGFv2 also exhibited higher frequency in the northeast United States and Central Europe.
5 Discussion
5.1 Interpretation of overflow at Fort Peck Dam
As shown in Section 3.3, hydrological simulations demonstrated overflow at Fort Peck Dam for some meteorological forcing datasets during peak-flow events. In global hydrological simulations, such overflow is sometimes inevitable because errors are accumulated via all processes including meteorological forcing, land processes, and human intervention, to produce runoff to be aggregated into river flow; and, as mentioned in Section 1, a variety of actual dam operations at global dam sites cannot be encompassed completely within a simple generic operation rule adopted in a GHM.
In practice, dam operators expend great effort to fine-tune the water level of the dam to within an optimal range under given meteorological and social conditions, to prevent the dam from weakening its regulating capability during heavy rainfall events as storage approaches capacity. Thus, actual river management is too complex to formulate within a generic scheme. For example, Fort Peck Dam is managed to meet local/regional requirements in the framework of the Missouri River Mainstem Reservoir System, which includes other major dams (Supplementary Table S1). Management of the reservoir system was described by the US Army Corps of Engineers (Citation2006). According to the manual, the primary water management functions of Fort Peck Dam are: while reducing flood damage, to capture runoff over the catchment area above the dam and to meter it out at controlled release rates to meet the reservoir system’s purposes; during major downstream flood control regulation, to serve as a secondary storage helping to alleviate large reservoir-level increases at downstream dams; and during low-water years, to provide extra water to meet the system’s need (Article 7–02.2). Winter release from Fort Peck Dam is often maintained at the maximum level possible to enhance winter energy generation (Article 7–04.7.1). In emergency situations, water release from the dams is subject to established priorities for evacuation from the system flood (Article 7–04.10.3). The generic dam operation scheme should be further improved (e.g. monthly release volume from the dam). However, despite the complexity of actual flow regulation, the generic dam operation scheme used in this study, which was not calibrated for Fort Peck Dam, reproduced the seasonal and year-to-year dam storage variation ().
Biases in simulated river discharge due to lack of calibration should also be reduced. There has long been a debate over whether river discharge simulated by GHMs should be calibrated due to the difficulties described in Section 1. Hattermann et al. (Citation2017) discussed that calibration helps regional hydrological models to perform well. In contrast, meteorological forcing data themselves contain biases (Supplementary Figs S2 and S3). It is controversial that strong calibration, which forces simulated discharge to match observed discharge, may eliminate these differences in meteorological forcing datasets.
This study shows that multi-forcing hydrological simulations are useful to evaluate the range of potential river discharge under meteorological uncertainties. Multi-forcing simulations also help to detect which run(s) suffered from “numerical overflow” at dam sites by examining the spread in discharge upstream and downstream across the meteorological forcing datasets.
5.2 Nonlinear dam response in hydrological simulations
This study showed that dam regulation in hydrological simulations can magnify variations in simulated results due to multiple meteorological forcing input data. This may result in large differences in downstream peak flow. Dam overflow events produced a nonlinear response to reservoir inflow. Small differences in meteorological conditions can produce large differences in peak-flow probability downstream of a dam. As stated in the introduction, global hydrological simulations suffer from low geographical coverage of gauge stations. Moreover, climate change impacts under future global warming scenarios rely heavily on hydrological simulations; future high-flow risk analyses are a typical outcome from these simulations. Peak-flow discharge, like the metric Q5, is a fundamental flood control statistic for river administration. The metric is susceptible to the filtering effect, which may lead to inappropriate flood management measures.
Dams contribute to a reduction in riverine risks, disaster, and water shortage by stabilizing river flow. Increasing water and electric demands have increased dam construction in mountainous areas away from populated areas (Nilsson et al. Citation2005). As such, dams will regulate more rivers in the future (Lempérière Citation2013). However, river discharge and dam regulation data are not easily attainable on a global scale. Global hydrological simulations that integrate dam schemes are critical for the assessment of riverine environments. The properties of high-flow events are closely linked not only to hydrology but also to riverine environments and ecosystems (Gordon et al. Citation2004). High-flow events produce sediment transport downstream, alter or sustain the morphology of rivers, and nurture ecosystems living in the floodplain. Only 10 years have passed since the initial integration of dams in GHMs. To improve simulation accuracy, more reliable hydrological schemes should be integrated from an in-depth examination of the model output (e.g. Masaki et al. Citation2017) and forcing data in comparison with observation.
6 Conclusions
We analysed dam behaviours in global river discharge simulations carried out under the ISIMIP2a framework by comparing simulation runs with and without dams. The modelled dams implemented in global hydrological models acted as a selective filter in the river network. The dams reduced natural hydrological fluctuations in most time periods, as is widely known. When the dam’s storage approaches full, the dam reduces fluctuation but with less efficiency, resulting in pulse-like flow releases (pulsing effect). The occurrence of pulsing effects is associated with numerical overflow.
In the multi-forcing intercomparison, the generic dam algorithm generally reduced differences in simulated river discharge between meteorological forcing datasets. However, and notably during wet years, the pulsing effect enhanced differences in simulated river discharge between meteorological forcing datasets. That is, dams masked differences in river discharge across different meteorological forcing simulations during most of the simulation period, but occasionally accentuated differences and produced large uncertainties in simulated river discharge downstream of dams. Differences in cumulative biases in inflow among meteorological forcing datasets led to differences in dam storage, further resulting in differences in regulation efficiencies mitigating high inflow among meteorological forcing datasets. It should be noted that dams always damp temporal fluctuations of river flow in terms of the absolute volume of water; the damping ratio varies only according to the water storage.
Our results also showed that the pulsing effect at upstream dam sites influenced river discharge simulations downstream, especially during high-flow events. Attention should be paid to this effect during the analysis of simulated river discharge below major dams. Multi-forcing simulations help to assess uncertainties stemming from the combination of meteorological data and a dam operation algorithm in river discharge simulations.
HSJ_Masaki_Suppl.pdf
Download PDF (2.5 MB)Acknowledgements
This work was conducted within the framework of the Inter-Sectoral Impact Model Intercomparison Project (ISIMIP), Phase 2a. River discharge observation data were provided from the Global Runoff Data Center (GRDC) and from the United States Geological Survey (USGS) through the web interface of the National Water Information System (http://nwis.waterdata.usgs.gov/nwis). Dam operation data were provided by the US Army Corps of Engineers, Northwest Division. We acknowledge the Associate Editor and Co-editor for their comments, which helped us improve the manuscript. We also thank two anonymous reviewers.
Disclosure statement
No potential conflict of interest was reported by the authors.
Supplementary material
Supplementary data for this article can be accessed here.
Additional information
Funding
Related Research Data
References
- Biemans, H., et al., 2011. Impacts of reservoirs on river discharge and irrigation water supply during the 20th century. Water Resources Research, 47, W03509. doi:10.1029/2009WR008929
- Bindoff, N.L., et al., 2013. Detection and attribution of climate change: from global to regional. In: T.F. Stocker, et al., eds. Climate change 2013: the physical science basis. Cambridge: Cambridge University Press.
- Compo, G.P., et al., 2011. The twentieth century reanalysis project. Quarterly Journal of the Royal Meteorological Society, 137, 1–28. doi:10.1002/qj.776
- Dankers, R., et al., 2014. First look at changes in flood hazard in the Inter-Sectoral Impact Model Intercomparison Project ensemble. Proceedings of the National Academy of Sciences USA, 111, 3257–3261. doi:10.1073/pnas.1302078110
- Dee, D.P., et al., 2011. The ERA-Interim reanalysis: configuration and performance of the data assimilation system. Quarterly Journal of the Royal Meteorological Society, 137, 553–597. doi:10.1002/qj.828
- Dirmeyer, P.A., et al., 2006. GSWP-2: multimodel analysis and implications for our perception of the land surface. Bulletin of the American Meteorological Society, 87, 1381–1397. doi:10.1175/BAMS-87-10-1381
- Döll, P., Fiedler, K., and Zhang, J., 2009. Global-scale analysis of river flow alterations due to water withdrawals and reservoirs. Hydrology and Earth System Sciences, 13, 2413–2432. doi:10.5194/hess-13-2413-2009
- Goldewijk, K.K., et al., 2011. The HYDE 3.1 spatially explicit database of human-induced global land-use change over the past 12,000 years. Global Ecology and Biogeography, 20, 73–86. doi:10.1111/j.1466-8238.2010.00587.x
- Gordon, N.D., et al. 2004. Stream hydrology: an introduction for ecologists, 2nd ed. Chichester, UK: John Wiley & Sons Ltd.
- Haddeland, I., et al., 2011. Multimodel estimate of the global terrestrial water balance: setup and first results. Journal of Hydrometeorology, 12, 869–884. doi:10.1175/2011JHM1324.1
- Haddeland, I., Skaugen, T., and Lettenmaier, D.P., 2006. Anthropogenic impacts on continental surface water fluxes. Geophysical Research Letters, 33, L08406. doi:10.1029/2006GL026047
- Hagemann, S., Loew, A., and Andersson, A., 2013. Combined evaluation of MPI-ESM land surface water and energy fluxes. Journal of Advances in Modeling Earth Systems, 5, 259–286.
- Hanasaki, N., et al., 2008a. An integrated model for the assessment of global water resources – part 1: Model description and input meteorological forcing. Hydrology and Earth System Sciences, 12, 1007–1025. doi:10.5194/hess-12-1007-2008
- Hanasaki, N., et al., 2008b. An integrated model for the assessment of global water resources – part 2: applications and assessments. Hydrology and Earth System Sciences, 12, 1027–1037. doi:10.5194/hess-12-1027-2008
- Hanasaki, N., Kanae, S., and Oki, T., 2006. A reservoir operation scheme for global river routing models. Journal of Hydrology, 327, 22–41. doi:10.1016/j.jhydrol.2005.11.011
- Hattermann, F.F., et al., 2017. Cross-scale intercomparison of climate change impacts simulated by regional and global hydrological models in eleven large river basins. Climatic Change, 141, 561–576. doi:10.1007/s10584-016-1829-4
- Hirabayashi, Y., et al., 2013. Global flood risk under climate change. Nature Climate Change, 3, 816–821. doi:10.1038/nclimate1911
- The Inter-Sectoral Impact Model Intercomparison Project, 2015. ISIMIP2a Simulation protocol., Available from: https://www.isimip.org/protocol/ [Accessed 29 May 2017].
- Kalnay, E., et al., 1996. The NCEP/NCAR 40-year reanalysis project. Bulletin of the American Meteorological Society, 77, 437–471. doi:10.1175/1520-0477(1996)077<0437:TNYRP>2.0.CO;2
- Kim, H., 2014. Available from: http://hydro.iis.u-tokyo.ac.jp/GSWP3/index.html [Accessed 29 May 2017].
- Lehner, B., et al., 2011a. High-resolution mapping of the world’s reservoirs and dams for sustainable river-flow management. Frontiers in Ecology and the Environment, 9, 494–502. doi:10.1890/100125
- Lehner, B., et al., 2011b. Global Reservoir and Dam (GRanD) database, Technical documentation Version 1.1. Available from: http://www.gwsp.org/fileadmin/downloads/GRanD_Technical_Documentation_v1_1.pdf [Accessed 21 May 2015].
- Lempérière, F., 2013. Achieving a sustainable development target. Available from: http://www.hydrocoop.org/the-role-of-dams-in-the-xxi-century [Accessed 29 May 2017].
- Masaki, Y., et al., 2014. Global-scale analysis on future changes in flow regimes using Gini and Lorenz asymmetry coefficients. Water Resources Research, 50, 4054–4078. doi:10.1002/2013WR014266
- Masaki, Y., et al., 2017. Intercomparison of global river discharge simulations focusing on dam operation – multiple models analysis in two case-study river basins, Missouri-Mississippi and Green-Colorado. Environmental Research Letters, 12, 055002. doi:10.1088/1748-9326/aa57a8
- Mitchell, T.D. and Jones, P.D., 2005. An improved method of constructing a database of monthly climate observations and associated high-resolution grids. International Journal of Climatology, 25, 693–712. doi: 10.1002/joc.1181
- Müller Schmied, H., et al., 2016. Variations of global and continental water balance components as impacted by climate forcing uncertainty and human water use. Hydrology and Earth System Sciences, 20, 2877–2898. doi:10.5194/hess-20-2877-2016
- New, M., Hulme, M., and Jones, P., 1999. Representing twentieth-century space-time climate variability. Part I: development of a 1961–90 mean monthly terrestrial climatology. Journal of Climate, 12, 829–856. doi:10.1175/1520-0442(1999)012<0829:RTCSTC>2.0.CO;2
- Nilsson, C., et al., 2005. Fragmentation and flow regulation of the world’s large river systems. Science, 308, 405–408. doi:10.1126/science.1107887
- Oki, T. and Kanae, S., 2006. Global hydrological cycles and world water resources. Science, 313, 1068–1072. doi:10.1126/science.1128845
- Oki, T., Nishimura, T., and Dirmeyer, P., 1999. Assessment of annual runoff from land surface models using Total Runoff Integrating Pathways (TRIP). Journal of the Meteorological Society of Japan, 77, 235–255. doi:10.2151/jmsj1965.77.1B_235
- Portmann, F.T., Siebert, S., and Döll, P., 2010. MIRCA2000–global monthly irrigated and rainfed crop areas around the year 2000: a new high-resolution data set for agricultural and hydrological modeling. Global Biogeochemical Cycles, 24, GB1011. doi:10.1029/2008GB003435
- Schewe, J., et al., 2014. Multimodel assessment of water scarcity under climate change. Proceedings of the National Academy of Sciences USA, 111, 3245–3250. doi:10.1073/pnas.1222460110
- Schneider, U., et al., 2014. GPCC’s new land surface precipitation climatology based on quality-controlled in situ data and its role in quantifying the global water cycle. Theoretical and Applied Climatology, 115, 15–40. doi:10.1007/s00704-013-0860-x
- Sheffield, J., Goteti, G., and Wood, E.F., 2006. Development of a 50-year high-resolution global dataset of meteorological forcings for land surface modeling. Journal of Climate, 19, 3088–3111. doi:10.1175/JCLI3790.1
- Uppala, S.M., et al., 2005. The ERA-40 re-analysis. Quarterly Journal of the Royal Meteorological Society, 131, 2961–3012. doi:10.1256/qj.04.176
- US Army Corps of Engineers, 2006. Missouri river mainstem reservoirs system master water control manual (Revision 1). Omaha: Northern Division of the United States Army Corps of Engineers.
- Voisin, N., et al., 2013. On an improved sub-regional water resources management representation for integration into earth system models. Hydrology and Earth System Sciences, 17, 3605–3622. doi:10.5194/hess-17-3605-2013
- Wada, Y., et al., 2013. Multimodel projections and uncertainties of irrigation water demand under climate change. Geophysical Research Letters, 40, 4626–4632. doi:10.1002/grl.50686
- Wada, Y., et al., 2016. Modeling global water use for the 21st century: the Water Futures and Solutions (WFaS) initiative and its approaches. Geoscientific Model Development, 9, 175–222. doi:10.5194/gmd-9-175-2016
- Wada, Y., van Beek, L.P.H., and Bierkens, M.F.P., 2011. Modelling global water stress of the recent past: on the relative importance of trends in water demand and climate variability. Hydrology and Earth System Sciences, 15, 3785–3808. doi:10.5194/hess-15-3785-2011
- Warszawski, L., et al., 2014. The Inter-Sectoral Impact Model Intercomparison Project (ISIMIP): project framework. Proceedings of the National Academy of Sciences USA, 111, 3228–3232. doi:10.1073/pnas.1312330110
- Weedon, G.P., et al., 2010. The WATCH forcing data 1958–2001: a meteorological forcing dataset for land surface- and hydrological models. WATCH Technical Report 22.
- Weedon, G.P., et al., 2014. The WFDEI meteorological forcing data set: WATCH forcing data methodology applied to ERA-Interim reanalysis data. Water Resources Research, 50, 7505–7514. doi:10.1002/2014WR015638
- Yasutomi, N., Hamada, A., and Yatagai, A., 2011. Development of a long-term daily gridded temperature dataset and its application to rain/snow discrimination of daily precipitation. Global Environmental Research, 15, 165–172.
- Yoshikawa, S., et al., 2014. An assessment of global net irrigation water requirements from various water supply sources to sustain irrigation: rivers and reservoirs (1960–2050). Hydrology and Earth System Sciences, 18, 4289–4310. doi:10.5194/hess-18-4289-2014