
ABSTRACT
Recently, data statements have been required in hydrological manuscripts. Authors are usually confused by different data management policies. Thus, a frequent response is to write down “data available upon request from the corresponding author”. Such a simplified response may lead to dormancy or permanent loss of data. We present an example of data management from a published hydrological modelling study. We started from figures with complete scientific stories in the publication and traced backwards to find relevant source data through workflows (linking). In this manner, the source data can be identified (archiving) and preserved (hosting). Such simple practices of data linking, archiving and hosting can rescue data and require only limited effort by the authors. We suggest that this data rescue process(es) should become routine in the scientific publication process. The data rescued with workflows can significantly improve the research transparency and reusability, which leads to a fairer and more open culture in hydrology.
Editor A. Castellarin Guest Editor C. Cudennec
1 Introduction
Data are the core foundation of scientific publication. In hydrology, many datasets are collected from field observations, lab experiments, and numerical simulations to support scientific hypotheses. The development of data storage and processing significantly facilitates hydrological research (Horsburgh et al. Citation2016, Essawy et al. Citation2018).
In the early decades of the 20th century, punch cards were used in data storage and processing, and scientists sought papers and other resources in libraries (). Entering the 21st century, the publication of research papers has adapted to the digital age with increasing quantities of data being preserved as digital storage products, allowing research results to be globally distributed and shared (e.g. Morsy et al. Citation2017). As agreement on sharing research results and research data products has expanded (Blume et al. Citation2017), many journals now provide guidance on how to prepare datasets in manuscripts (Duerr et al. Citation2011, Hanson and Hilst Citation2014). At the same time, research organizations provide data repositories to host data and support data citations (e.g. CUAHSI,Footnote1 Dryad,Footnote2 Centre for Ecology & Hydrology, UKFootnote3). Since data alone are important research products, funders are increasingly mandating open access to research data (Obama Citation2013, Douglass et al. Citation2014, NSF Citation2015, USGS Citation2016). However, these diverse data policies flood researchers’ limited attention with time-consuming learning curves. Usually, the authors are required to read through the instructions. In addition, the funding agency may require certain data policy. Sometimes, the research institute has suggestions on research data accessibility (e.g. https://data.uwyo.edu, http://guides.libraries.psu.edu/rdm). As a result, many authors often select the simplest data statement: “data available upon request from the corresponding author” to avoid tedious data documentation processes. To some extent, such a statement can lead to dormancy or total loss of the datasets in publication. Heidorn (Citation2008) used the term “dark data” to refer to the scientific data with poor utility due to ineffective indexing and inappropriate storage.
Figure 1. Hydrological data and publication in the past, present (current) and future.
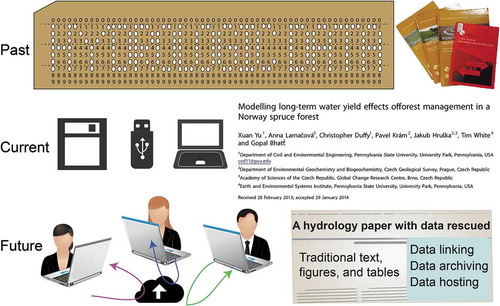
Dark data can be the result of poor accessibility. For example, journals often do not maintain datasets associated with a published paper, while authors cite sources of datasets and backup other data in personal computers. If the source links are broken, the readers cannot access the data and must find substitutes through contacting the corresponding author or agency. However, such requests rely on an appropriate response time based on the authors’ availability. A recent study demonstrated that less than half of authors are willing to share data upon request (Krawczyk and Reuben Citation2012). An online survey showed that only 48% of academic scientists consider themselves to be responsible for approving access to the data they collect (Douglass et al. Citation2014).
Dark data can also be the result of missing data workflow, which may cause misunderstanding and misinterpretation of data. In traditional publication, text, tables, and figures have limits regarding data storage and provenance (Gil et al. Citation2014). During the research process, many data workflows were used to achieve data products, but only the final data were presented as text, tables, figures, or supplemental material after publication. The description of analyses in traditional papers can hardly capture entire data products, which can inhibit the value of data collected in publications (Fleischer and Jannaschk Citation2011, Gil et al. Citation2016).
The recent discussions of big data and emerging efforts associated with the shaping of “data science” have focused on improving transparency and reproducibility of research products. For example, one of the major tasks of the US National Science Foundation’s on-going EarthCube project is to rescue and liberate dark data (Gil et al. Citation2014). Peckham (Citation2014) developed a cross-domain variable naming convention framework to improve the compatibility of diverse Earth system models. The climate model community started to standardize datasets across all models and document forcing data (Durack et al. Citation2018). Most of these solutions focused on relatively big datasets and complex modelling systems, but there are many data processing pipelines in each project which are not routinely documented and shared. Ferguson et al. (Citation2014) showed that many small datasets (i.e. granular datasets collected by individual scientists in the course of day-to-day research) are of great value in collaborative neuroscience. These small data can efficiently answer targeted queries and foster the growth of new approaches of data analytics (Kitchin and Lauriault Citation2015). Gil et al. (Citation2016) proposed best practices for geoscience authors to make data, software, and methods openly accessible, citable, and well documented. Yu et al. (Citation2016) showed these best practices could significantly illuminate dark data by pairing data with each paper. Therefore, one of the most urgent tasks is to demonstrate examples of when and when not, where and where not, what and what not, how and how not should data be rescued in the course of preparing manuscript for publication.
This study demonstrates the methods of data rescue so that authors understand how to embed reusable data in their manuscripts. With this aim, we revisited figures in a previously published study, and then traced backwards to source data. We used computational workflows to link the analysis procedures from datasets to figures with scientific knowledge. All the source data were organized in categories. Each category of dataset was then posted on an appropriate data repository. These data rescue processes can be succinctly cited in manuscripts for publication as a routine. Our study has implications to popularize a fairer and more open research culture in hydrology.
2 Background and data summary
Yu et al. (Citation2015) presented a modelling study on the hydrological impact of an intensive forest management practice. The study was accomplished at Lysina in the 29.3-ha headwater catchment located at 50°03′N, 12°40′E in the western part of the Czech Republic. The modelling tool used was the Penn State Integrated Hydrologic Model (PIHM), a coupled surface-subsurface hydrological model (available online at http://www.pihm.psu.edu/). The simulation was conducted from 2006 to 2011. Historic forest management data were rescued from forest age/growth maps. The modelling results revealed both long-term and seasonal impacts of vegetation management.
The data generated in the study have many other potential applications for multi-disciplinary researchers beyond supporting the hypotheses in the paper including: (1) developing age-dependent ecosystem parameters; (2) learning hydrological modelling on coupled surface and subsurface processes; (3) understanding snow accumulation and melting processes; and (4) forecasting hydrological response on forest cover change.
3 Data rescue
We started from key figures in Yu et al. (Citation2015) and other important scientific results, and then traced backwards to find the source data. The source data were grouped and uploaded as five datasets: geospatial, meteorological, forest management, leaf area index (LAI)–age relationship and hydrological modelling data. Through this approach, each set of data was rescued through three steps: data linking (i.e. workflow backwards tracing), data archiving and data hosting.
3.1 Data linking
Data linking shows the entire processing workflow using backwards tracing from final visualization products (e.g. plots, animations and interactive graphical user interface) to source data. We used ArcGIS online, Matlab and Hypertext Markup Language to realize different types of data linking (). The ArcGIS online file and the html file were tested by all the co-authors. Readers without Matlab installed can generate their own code in other languages. When other commercial software is used, the authors may document how the software was obtained (Gil et al. Citation2014). All of the workflow started from figures with important scientific results and self-explanatory scientific stories to the source data. Such complete workflow presentation enabled the provenance of data and guaranteed the understanding of scientific meaning of data. Details of the data workflow are presented in .
Table 1. Data linking sources, codes, and figures.
Figure 2. Workflow of each dataset. The workflow is presented backwards so that readers can easily find the datasets relevant to their interested scientific knowledge presented in figures.
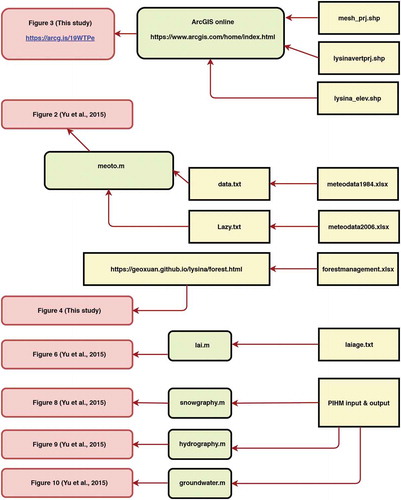
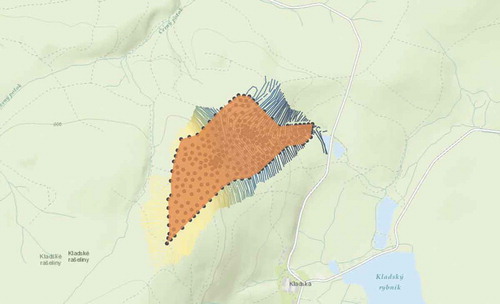
Geospatial data were assembled in ArcGIS online and are shown in . The dataset consists of three shapefile layers: mesh_prj, lysinavertprj and lysina_elev. The mesh_prj layer was the domain decomposition results of PIHMgis (Bhatt et al. Citation2014). PIHM simulated hydrological state variables on each triangle of the model domain and fluxes between each pair of neighbours. The lysinavertprj layer is the vertices of the mesh, which can provide further information for spatial analysis. The lysina_elev layer is the elevation contour around the domain.
Figure 3. Geospatial data hosted by ArcGIS online. We selected ArcGIS online as host because it provides both visualization and source data.
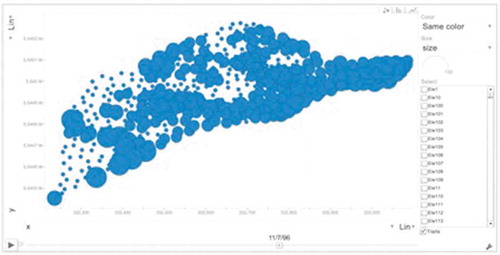
Forest management resulted in the age distribution of the trees changing with years. The data were presented as a webpage, as shown in . The source data included a spreadsheet of forest age and an HTML file to create interactive animation of age variation ().
Figure 4. Spatial-temporal visualization of tree age change due to forest management. This is only a snapshot of the interactive visualization. For dynamic visualization animate, please open the html file in a web browser, which give readers straightforward understanding on forest management.
Meteorological data were plotted in Figure 2 of Yu et al. (Citation2015). The backwards tracing methods suggested that two periods of time series data were used to plot the figure. The data were saved as plain txt files as the inputs of a Matlab code (meoto.m). The code was used to generate subplots of Figure 2 of Yu et al. (Citation2015). Figure 6 of Yu et al. (Citation2015) was the LAI–age relationship. The source data were stored in laiage.txt, and then plotted by lai.m (). Figures 8–10 of Yu et al. (Citation2015) presented the hydrological modelling results. The source data were linked to post-processing codes: snowgraphy.m, hydrography.m, and groundwater.m ().
3.2 Data archiving
The source data traced from data linking were archived to make them accessible. We grouped them into five datasets ().
Table 2. Data archives and properties.
3.2.1 Geospatial data
Geospatial data included the location of the study, and the geometry and topography of the model domain. We used ESRI shapefiles to store the spatial information.
3.2.2 Meteorological data
Meteorological data were originally provided as spreadsheets in different formats. In the PIHM modelling, the data were converted to a special format (Bhatt et al. Citation2014) for input to PIHM. Here we archived the spreadsheets as meteorological data, and the special format files in hydrological modelling data.
3.2.3 Forest management data
Forest management data included the distribution of stand ages of Norway spruce in 1984, 1994 and 2004. The age change due to management was projected on each model domain. An animation through time of tree age was created to visualize forest management.
3.2.4 LAI–age data
The LAI–age relationship data were collected from the literature, and the regression equation was developed by Yu et al. (Citation2015). The plotting code was archived so that readers can conveniently create their own figures using more data from other sources.
3.2.5 Hydrological modelling data
The hydrological modelling results were plotted against observations and analysed to develop a water budget. All the model inputs and outputs were collected along with the model source code to avoid confusion on PIHM versions.
3.3 Data hosting
We selected different places to host the above archived data in this study based on the discipline and format (). The geospatial data were uploaded to ArcGIS Online. The meteorological data and hydrological modelling data were uploaded to HydroShare. Forest management data and LAI–age data were uploaded to figshare. All the data have a DOI or URL (), which can be accessed by the readers. Please note that we maintained diversity in the data hosting repositories, so that our example is not biased. We would like to let readers understand that differences may arise due to computers/operating systems/browsers/restrictions of each repository. Readers will find the most convenient places to host their data.
Table 3. Data hosting and repositories.
4 Discussion
4.1 Importance of data rescue
Data can be lost for many reasons, including:
(a) The author name and affiliation information become out of date; for example, in this paper the first author (Xuan Yu) has moved to a new job and the corresponding author (Christopher Duffy) has retired.
(2) The computational environmental will be updated. In this case, previous simulations (Yu et al. Citation2015) were performed on Lion-X Clusters (Penn State Citation2015) at The Pennsylvania State University’s Institute for CyberScience (ICS). In 2017, ICS conducted a major upgrade of the HPC environment, and Lion-X Clusters was retired.
(3) Source links of input data expire. The models and data were posted at http://www.pihm.psu.edu/applications/lysina.html after the project was complete but many of the links have since broken.
(4) PIHM code and its dependencies have improved and the version has upgraded. PIHM version 2.2 and earlier ones are hosted at http://www.pihm.psu.edu/pihm_downloads.html, while more recent development of PIHM is maintained on Github (https://github.com/PSUmodeling, https://github.com/pihmadmin). Thus, simulation results may change with different versions of the model.
4.2 Feasibility of data rescue in manuscripts
The time cost demonstrated that data rescue in a manuscript is affordable. The processes of data rescue cost roughly one-week of work time; the time investment should be much smaller if instead accomplished before manuscript submission. Such limited time cost is one of the major attracting factors of the data rescue method compared to other data management requirements.
The feasibility of data rescue in a manuscript is also increased since we do not require standard detailed metadata and allow flexible data storage and format. The data without detailed metadata can be understood by the data linking processes from figures. The data processing workflow can automatically link data with different types of formats to self-explanatory figures. Therefore, we allow data of diverse formats and sources. We are expecting that increasing options will be discovered later from future published examples of papers with data rescue.
4.3 Advantages of backwards tracking
Backwards tracking increases data transparency and usability. Figures are usually the most attractive research results of a paper. The reader looks through figures first and then captions to understand the key information. The remainder of the paper including data and methods is read only if the figure is interesting to the reader. The backwards tracking workflow complies with the readers’ interests. Since they already understand the scientific meaning of the figures, the readers can easily find the part of source data related to the most interesting figures. The meanings (e.g. units, types, statistics) of the source data can also be traced through the workflows by the readers, which result in better data transparency and usability. Many existing data management plans (e.g. NSF Citation2015, USGS, Citation2016) usually started from source data and then metadata, which may be time-consuming and confusing for the readers. Vivid scientific stories in publication can attract more readers than tedious plain data and metadata.
Backwards tracking is also efficient in focusing on data processing steps selectively without understanding the whole processes. For example, both PIHM input and output files are listed in . The reader does not have to understand all the formats. If the reader is interested in improving performance on streamflow prediction, the discharge data can be obtained and understood by rerun hydrography.m only.
4.4 Extra utility of data rescue in manuscripts
Data rescue before manuscript submission may accelerate the peer review processes. The editors of several hydrological journals decided to improve the peer review process toward enhanced transparency (Koutsoyiannis et al. Citation2016). Quinn et al. (Citation2018) concluded that open data are critical to ensure publication quantity, speed and multiple authorships.
Our study also suggests that mandating or encouraging data rescue in manuscripts could be a potential solution for dark data. Usually, data are archived when a project is finished or a group member is departing, which can significantly increase the time cost of data management. Data rescue can help the author recall details of the paper and data after a long time.
Data rescue in manuscripts can help to identify authorship of data products. In traditional manuscripts, all co-authors contribute to all the data in the paper. It is hard to decide whom to ask when one needs to inquire. Sometimes, all of the data was compressed in one file for distribution. It is hard for readers to understand the data. In the data rescue processes, each piece of data is cited in the manuscript with authors, dates, and DOIs, which is valuable to distinguish data contribution and easy to understand the meaning of the data. Our method can be an effective solution to identify authors’ contributions before advanced consensuses are achieved (e.g. McNutt et al. Citation2018, Oliver et al. Citation2018)
4.5 Limitations and opportunities
The aim of this work is to improve data reusability in manuscript preparation, which may potentially benefit solutions of the dark data issue. Our starting point is from the authors who want to promote their ideas. They are responsible for making data reusable to support their ideas. A traditional publication style should still be preserved for authors who currently cannot share data. Meanwhile, there are many other important efforts and responsibilities from research institutions, libraries and journal editorial offices, which are more professional in data indexing, data storage and data archiving.
Our study is only one example of potential solution to data rescue, though we noticed that there are no universal criteria to illuminate dark data. Our result may be beneficial for encouraging hydrologists to think on their research products and publication. We are not trying to convince readers that they should follow any of the practices listed above, because their own situation is different from the one outlined here. Nevertheless, the discussion on data management during manuscript preparation could be an important step to a fair and open research culture in hydrology.
Our study demonstrates opportunities for innovative ideas in open hydrology. We think the word “open” also suggests that the way to open data is open according to the background and field of the authors. Our method is intended to help interdisciplinary co-authors, who can contribute part of the dataset based on their own customs. Please note, our linking step is very critical to allow data storage in different format, otherwise it will result in partial or obsolete data. We also give freedom on metadata preparation, though we do not know what the shortcoming may be at this moment. We hope our method will be improved later after dozens of practices. Our final goal is to compare different methods and find the optimal options.
5 Conclusions
We have conducted data rescue from a paper published three years ago. This rescue was achieved not only by data organizing and hosting, but also by linking data to each figure in the source. We found that it could be a routine procedure before manuscript submission, which can save numerous “dark data” in the scientific publication process. Our study provides a straightforward example of how to implement data rescue.
Traditionally, manuscripts are published for sharing ideas and the ultimate goal is to gain readers. Currently, data storage and sharing is as easy as how we share ideas, which inspires our thoughts on how to improve the experience for both reader and users. Therefore, it is important to explore different ways of sharing data and gaining users of the data. We hope increasing numbers of hydrologists will spend affordable time on data management before manuscript submission, rather than write a simple statement “data available upon request from the corresponding author”. As a result, scientific publication serving as a data hub can be used to share ideas, as well as rescue datasets with improved reusability.
Acknowledgements
We thank the anonymous reviewers for their suggestions, and Yolanda Gil for discussions.
Disclosure statement
No potential conflict of interest was reported by the authors.
Additional information
Funding
Notes
References
- Bhatt, G., Kumar, M., and Duffy, C.J., 2014. A tightly coupled GIS and distributed hydrologic modeling framework. Environmental Modelling & Software, 62, 70–84. doi:10.1016/j.envsoft.2014.08.003
- Blume, T., van Meerveld, I., and Weiler, M., 2017. The role of experimental work in hydrological sciences – insights from a community survey. Hydrological Sciences Journal, 62 (3), 334–337. doi:10.1080/02626667.2016.1230675
- Douglass, K., et al., 2014. Managing scientific data as public assets: data sharing practices and policies among full-time government employees. Journal of the Association for Information Science and Technology, 65, 251–262. doi:10.1002/asi.2014.65.issue-2
- Duerr, R.E., et al., 2011. On the utility of identification schemes for digital earth science data: an assessment and recommendations. Earth Science Informatics, 4, 139–160. doi:10.1007/s12145-011-0083-6
- Durack, P.J., et al., 2018. Toward standardized datasets for climate model experimentation [Online]. Eos. URL https://eos.org/project-updates/toward-standardized-data-sets-for-climate-model-experimentation (Accessed 7 Mar 2018). doi:10.1029/2018EO101751
- Essawy, B.T., et al., 2018. Integrating scientific cyberinfrastructures to improve reproducibility in computational hydrology: example for HydroShare and GeoTrust. Environmental Modelling & Software, 105, 217–229. doi:10.1016/j.envsoft.2018.03.025
- Ferguson, A.R., et al., 2014. Big data from small data: data-sharing in the’long tail’of neuroscience. Nature Neuroscience, 17, 1442–1447. doi:10.1038/nn.3838
- Fleischer, D. and Jannaschk, K., 2011. A path to filled archives. Nature Geoscience, 4, 575–576. doi:10.1038/ngeo1248
- Gil, Y., et al., 2014. EarthCube: past, present, and future. EarthCube Project Report EC-2014-3. Arlington, VA: National Science Foundation.
- Gil, Y., et al., 2016. Towards the geoscience paper of the future: best practices for documenting and sharing research from data to software to provenance. Earth and Space Science, 3 (10), 388–415. 2015EA000136. doi:10.1002/2015EA000136
- Hanson, B. and Hilst, R., 2014. AGU’s data policy: history and context. Eos, Transactions American Geophysical Union, 95, 337. doi:10.1002/eost.v95.37
- Heidorn, P.B., 2008. Shedding light on the dark data in the long tail of science. Library Trends, 57, 280–299. doi:10.1353/lib.0.0036
- Horsburgh, J.S., et al., 2016. Hydroshare: sharing diverse environmental data types and models as social objects with application to the hydrology domain. JAWRA Journal of the American Water Resources Association, 52, 873–889. doi:10.1111/1752-1688.12363
- Kitchin, R. and Lauriault, T.P., 2015. Small data in the era of big data. GeoJournal, 80, 463–475. doi:10.1007/s10708-014-9601-7
- Koutsoyiannis, D., et al., 2016. Joint editorial – fostering innovation and improving impact assessment for journal publications in hydrology. Hydrological Sciences Journal, 61 (7), 1170–1173. doi:10.1080/02626667.2016.1162953
- Krawczyk, M. and Reuben, E., 2012. (Un) Available upon request: field experiment on researchers’ willingness to share supplementary materials. Accountability in Research, 19, 175–186. doi:10.1080/08989621.2012.678688
- McNutt, M., et al., 2018. Transparency in authors’ contributions and responsibilities to promote integrity in scientific publication. Proceedings of the National Academy of Sciences, 115 (11), 2557–2560. doi:10.1073/pnas.1715374115
- Morsy, M.M., et al., 2017. Design of a metadata framework for environmental models with an example hydrologic application in HydroShare. Environmental Modelling & Software, 93, 13–28. doi:10.1016/j.envsoft.2017.02.028
- NSF, 2015. Public Access Plan: Today’s Data, Tomorrow’s Discoveries.
- Obama, B., 2013. Executive order – making open and machine readable the new default for government information. Washington DC: The White House.
- Oliver, S.K., et al., 2018. Strategies for effective collaborative manuscript development in interdisciplinary science. Ecosphere, 9, e02206. doi:10.1002/ecs2.2206
- Peckham, S.D., 2014. The CSDMS standard names: cross-domain naming conventions for describing process models, datasets and their associated variables. International Environmental Modelling and Software Society (iEMSs), San Diego, California, USA, 1, 67–74.
- Penn State, 2015. Lion-X Clusters User Guide, University Park, Pennsylvania.
- Quinn, N., et al., 2018. Invigorating hydrological research through journal publications. Hydrological Sciences Journal, 63 (8), 1113–1117. doi:10.1080/02626667.2018.1496632
- USGS (US Geological Survey), 2016. Public Access to Results of Federally Funded Research at the U.S. Geological Survey: Scholarly Publications and Digital Data.
- Yu, X., et al., 2015. Modeling the long term water yield effects of forest management in a Norway spruce forest. Hydrological Sciences Journal, 60 (2), 174–191. doi:10.1080/02626667.2014.897406
- Yu, X., et al., 2016. Open science in practice: learning integrated modeling of coupled surface-subsurface flow processes from scratch. Earth and Space Science, 3, 190–206. doi:10.1002/2015EA000155