
ABSTRACT
Streamflow prediction in ungauged basins is necessary to support water resources management decisions. Herein we refine and evaluate the Streamflow Prediction under Extreme Data-scarcity (SPED) model, a framework designed for streamflow prediction within regions of sparse hydrometeorological observation. With the SPED framework, inclusion of soft data directs optimization to balance runoff efficiency with the selection of hydrologically representative parameters. Here SPED is tested in catchments around the world, including four well-gauged catchments, by mimicking data-scarcity and comparing against data-intensive approaches. By differentiating equifinal models, SPED succeeds where traditional approaches are likely to fail: partially dissimilar reference/target catchments. For instance, in a pair of reference/target catchments with different base flow regimes, SPED outperforms a model calibrated only to maximize efficiency (NSE of 0.54 versus 0.08). SPED performs consistently (NSE range: 0.54–0.74) across the diverse climatological and physiographic settings tested and proves comparable to state-of-the-science methods that use robust data networks.
Editor A. Castellarin Associate editor A. Viglione
1 Introduction
As predictive abilities in catchment science become more advanced, methods are needed to translate new capabilities and technologies into wide application by water resources managers in diverse geographies. Ungauged catchments located in regions characterized by sparse hydrologic networks deserve particular attention from the research community, to ensure that the most rigorous and promising approaches to streamflow prediction may be applied broadly. For instance, 65% of mountainous basins do not meet the World Meteorological Organization (WMO) minimum recommended density of discharge gauging stations necessary for basic water resources management (Perks et al. Citation1996) and there is evidence that the number of long-term stream gauges is in decline worldwide (Lanfear et al. Citation1999, Vörösmarty et al. Citation2001, Shiklomanov et al. Citation2002, Hannah et al. Citation2011). Lack of climatic and hydrologic data, such as long-term daily streamflow data, may lead to deficiencies in water resources management capabilities (see WMO Citation2008), and also presents particular challenges to application of advanced modeling techniques for streamflow prediction, such as regionalization and multi-criteria model calibration.
Prediction of streamflow in ungauged rivers has received significant attention from researchers around the world due to the vast applications in water resources planning and management (e.g., Gibbs et al. Citation2012, Seibert and McDonnell Citation2013, Arsenault and Brissette Citation2016, Kibler and Alipour Citation2017). Long-term, daily streamflow data are advantageous, for instance, in planning development projects, preservation or restoration of aquatic ecosystem function, and allocation of water. Substantial progress has been made in the science of streamflow prediction, for instance through the Prediction in Ungauged Basins (PUB) Decade (2003–2012) of the International Association of Hydrological Sciences. The synthesized runoff prediction framework from this decade of research identifies catchments as complex and diverse systems, wherein varied streamflow generation processes manifest distinct hydrologic response signatures (see Blöschl et al. Citation2013). The role of comparative hydrology is emphasized as a tool to learn about catchment functionality based on similarities, for instance in physical characteristics or runoff signatures, such that hydrologic similarities may be utilized to predict streamflow in ungauged catchments (Wagener et al. Citation2013). Such initiatives are in part a response to the desire that research focus shift towards process understanding and model structural diagnostics (Hrachowitz et al. Citation2013). Based on the principles of comparative hydrology and catchment similarity, numerous flow prediction techniques have been developed and tested around the world (e.g., Post and Jakeman Citation1999, McIntyre et al. Citation2004, Post Citation2009, Parada and Liang Citation2010, Parajka et al. Citation2015). However, barriers to hydrologic modeling within severely data-scarce regions persist (Hughes Citation2016, Koutsouris et al. Citation2017, Tegegne et al. Citation2017), and managers struggle with problems such as equifinality of potential models (Beven Citation1993, Citation2006), uncertainty in information available to constrain parameter values (Alipour and Kibler Citation2018), limited selection of gauged reference catchments and thus potential for hydrologic dissimilarity to ungauged catchments (Peñas et al. Citation2014), and lack of streamflow data for validating predictions (van Emmerik et al. Citation2015).
Many state-of-the-science streamflow prediction techniques are founded upon concepts of regionalization, wherein the regional hydrologic network is utilized to develop relationships between catchment characteristics and/or runoff signatures and hydrologic model parameters (Yadav et al. Citation2007, Zhang et al. Citation2008). For example, McIntyre et al. (Citation2005), Parajka et al. (Citation2007a), Post (Citation2009), Heřmanovský et al. (Citation2017), and Swain and Patra (Citation2017) developed regionalization techniques to estimate streamflows over large spatial areas. In each of these studies, methodologies were developed within regions equipped with robust hydrologic monitoring networks, which produced satisfactory streamflow predictions in the majority of catchments tested. Moreover, studies evaluating the performance of regionalization techniques conclude that spatial proximity to locations of long-term monitoring is a primary predictor of model accuracy (e.g., Vandewiele and Elias Citation1995, Merz and Blöschl Citation2004, Parajka et al. Citation2005, Oudin et al. Citation2008). Thus, reliability of hydrologic prediction based on regionalization is closely associated with the resolution of the available regional observation network (Oudin et al. Citation2008, Parajka et al. Citation2015).
Additionally, the value of multi-criteria calibration and evaluation of models has been highlighted as an avenue for improving process representation in hydrologic modeling (Yapo Citation1996, Yapo et al. Citation1998, Vrugt et al. Citation2003). Yu and Yang (Citation2000), Seibert and McDonnell (Citation2002), Yang et al. (Citation2004), and Kamali and Mousavi (Citation2014), for example have incorporated fuzzy theory or “soft” data (i.e., data associated with high uncertainties such as regional/global data or qualitative knowledge) into multi-objective model calibration. Incorporating a priori (i.e., information acquired or estimated directly from physical/hydrological data and information in a catchment without the need for model calibration) predictions of parameter distributions in multi-objective calibration of hydrological models may be an especially promising direction for improving representation of catchment function within models (Parajka et al. Citation2007b, Merz et al. Citation2009, Citation2011). However, making such a priori estimations would be an additional challenge to streamflow prediction in data-scarce regions. Alipour and Kibler (Citation2018) proposed the Streamflow Prediction under Extreme Data-scarcity (SPED) framework which incorporates a priori estimates of parameter values in the multi-criteria calibration of a hydrological model of choice. Preliminary testing suggested that even highly uncertain soft data available in data-scarce regions can support such a priori parameter estimates. While runoff prediction efficiency of SPED was similar to that of traditional single-objective methods, parameter values selected by SPED aligned more closely with a priori estimates based on soft data. This alignment suggests that the SPED process may allow managers to isolate parameter values that better represent hydrological processes in poorly gauged basins.
To further address the need for incorporating scientific advancements into practical techniques for poorly gauged regions, in this study we conduct a comprehensive evaluation of the SPED framework to more fully explore its merits and limitations. The objectives of the study are thus to: (1) test the streamflow prediction skill of the SPED framework in diverse regions with different hydro-climatological conditions, (2) analyze whether multi-criteria SPED offers improvement in runoff efficiency over models calibrated only to maximize runoff efficiency, and (3) compare the quality of SPED simulations generated under severe data-scarcity to those achieved in prior studies utilizing robust data networks (e.g., availability of gauging stations for hydrometeorological variables, availability of multiple gauged catchments in the region, availability of data required for physically distributed hydrologic modeling) and state-of-the-art prediction methods. The current study makes important contributions to the study of streamflow prediction in ungauged basins by diversifying both the number and geography/hydrology of validation test cases for the SPED framework. By comparing SPED performance with prior models in well-gauged catchments, the limitations of SPED can be well understood. Moreover, the merits of SPED at addressing wicked problems in hydrologic modeling, such as equifinality, catchment dissimilarity, and data uncertainty, are comprehensively explored.
2 Materials and methods
2.1 Synopsis of the SPED framework
The SPED framework proposed by Alipour and Kibler (Citation2018) is not itself a model, but a systematic procedure within which any number of hydrologic models may be embedded. Before application of SPED, the choice of hydrologic model for general suitability in the region of interest should be preliminarily tested by traditional calibration (with the single objective to maximize runoff efficiency) and validation in a local, gauged reference catchment. A reference catchment is a gauged catchment located in relative proximity to the target catchment(s), which has some degree of hydrologic similarity to target catchment(s). The target catchment is an ungauged catchment in which streamflows are to be predicted.
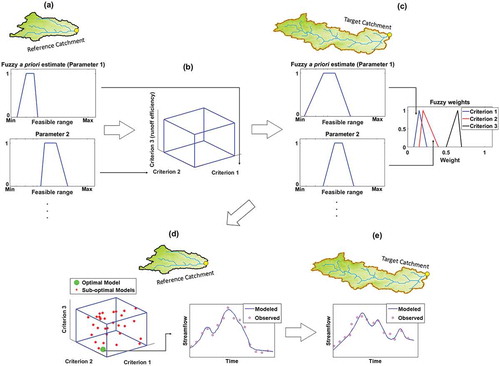
After a model is confirmed to be generally suitable for the region, available physical and hydrologic data are used to create a priori estimates of influential model parameters in the reference catchment (). In the absence of sufficient observed or ground-truthed data, “soft” data, including low-resolution or highly uncertain data, such as remotely sensed data, may be utilized to inform a priori estimates. Uncertainties are incorporated by representing a priori estimates into the model as fuzzy numbers (). A multi-criteria objective function (i.e., Eq. (4)) is parsed to balance both agreements with a priori parameter estimates in the reference catchment (criteria 1 to n) and conformity to observed streamflows (criterion n+ 1) (). Similar to the procedure performed in the reference catchment, a priori values of influential model parameters are estimated in the target catchment () in order to weight the criteria. Criteria are weighted based on their relative importance, level of certainty in a priori parameter estimates, and degree of resonance between a priori estimates in the reference and target catchments (). Subjectivity in weighting may be unavoidable and uncertainties in criteria weights are acknowledged through the use of fuzzy weights (). The model is calibrated to optimize the multi-criteria objective function in the reference catchment using a priori parameter estimates in the reference catchment and the weights assigned to the criteria (). Through this multi-objective process, calibration aims at maximizing runoff efficiency while at the same time providing a true representation of physical and hydrological characteristics of the catchment. Finally, the selected model is transferred to the target catchment(s) for prediction and validation (). Detailed examples of SPED implementation are provided in Section 2.3.
Figure 1. Application of the SPED procedure: (a) parameter values are estimated a priori in the reference catchment; (b) multi-criteria objective function is formed in the reference catchment; (c) parameter values are estimated a priori in the target catchment and criteria are weighted; (d) from multiple potential models (red points) the model with lowest OF value (Eq. (4)) is selected as optimal (green point); (e) the optimal model selected from the reference catchment is transferred to the target catchment(s) for prediction.
2.2 Study catchments
We applied the SPED framework to predict streamflow in six target catchments from four countries (UK, USA, Australia, and China) located on four different continents and with diverse hydro-climatic regimes. The first target catchment, the River Coquet (gauge at Morwick) (, ), with a size of 578 km2 is located in the UK. Annual mean rainfall in the catchment is 850 mm (1961–1990). There is an association between precipitation in the River Coquet basin and low pressure over Britain, and precipitation is characterized by a cyclonic weather type. In River Coquet basin, easterly air streams may cause an onshore flow off the North Sea and consequently generate river streamflow (Lavers Citation2011). Land cover in the catchment is dominated by grasslands while woodland, arable/horticultural, and mountain/heath/bog are the other major land cover types in the catchment. We chose a nearby gauged catchment, River Wansbeck (gauge at Mitford) (, ), with a size of 282 km2 as the reference catchment. The River Wansbeck catchment has a mean annual rainfall of 794 mm (1961–1990) and a similar land cover to River Coquet (UK National River Flow Archive Citation2017). Flows in the River Coquet (, ), have previously been modeled at Morwick using regionalization techniques in a study by McIntyre et al. (Citation2004).
Table 1. Summary of reference and target catchments.
Figure 2. Study regions and reference/target catchments: (a) UK, (b) USA, (c) Australia, and (d) China.
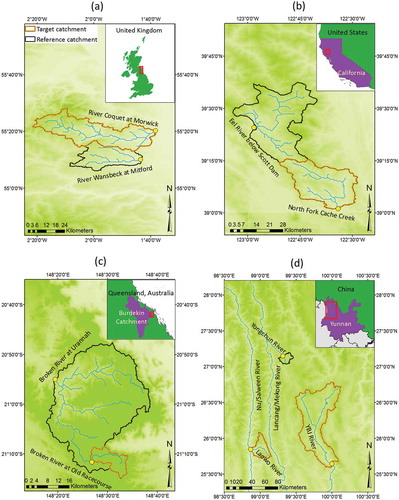
The North Fork Cache Creek watershed in California, USA (, ) with a size of 510 km2 is the second target catchment. Winter cyclonic storms create most of the precipitation in the catchment. Surface runoff corresponds with rainfall events which normally begin in November and occur frequently through mid-April. Very dry conditions accompanied by very low streamflow prevail for the rest of the year. Mean annual precipitation of the study area for the period of analysis is 880 mm (Parada and Liang Citation2010). Woodlands followed by wooded grasslands/shrublands are the major land cover types in the catchment (DeFries and Hansen Citation2010). We chose one gauged catchment, Eel River (below Scott Dam) (, ) with a size of 751 km2 as the reference catchment. Woodlands are the single major land cover in the catchment (DeFries and Hansen 2010). North Fork Cache Creek has previously been modeled by Parada and Liang (Citation2010).
Two locations within Broken River were selected as interchangeable reference and target catchments in the dry-tropical rangeland environment of Burdekin catchment (129 660 km2) in Queensland, Australia. At Old Racecourse (, ) the catchment area is 68 km2 and further downstream at Urannah (, ) the catchment area is 1033 km2. Burdekin catchment is characterized by a semi-arid climate in which the coldest monthly temperatures average above 0°C. Such climatic regime is not suitable for agriculture and is home to low population densities. The catchment routinely experiences large variabilities in its annual, mean monthly, as well as daily streamflow. Mean annual rainfall in the Burdekin catchment is 650 mm (Australian Bureau of Meteorology Citation2017). Wooded grassland/shrubland dominates the land cover of catchment areas contributing to Urannah, while woodland is the major land cover at Old Racecourse (DeFries and Hansen 2010). Burdekin catchment was previously modeled through the regionalization study by Post (Citation2009), including both Broken River at Old Racecourse and Broken River at Urannah, and prediction results were generated for both catchments. Because it was possible to compare prior modeled predictions for both catchments to results from SPED, both are modeled herein as interchangeable reference/target catchments. This was not possible in the other study locations.
Finally, two target catchments, the Yang Bijiang (YBJ) River catchment (, ) in the Upper Mekong River basin and the Laowo River catchment (, ) in the Upper Salween River basin in China were selected to analyze SPED performance in a truly poorly gauged region. Yongchun River (, ), a gauged tributary to the Upper Mekong River, was selected as the reference catchment for both Chinese rivers. The regional climate is monsoonal, although precipitation and temperature vary considerably with local topography, which is mountainous and highly varied. In the rivers, high flows correspond with rainfall, which is characterized by two seasonal pulses (between February and May, and between June and October). Annual rainfall in the Upper Mekong basin can range from 600 mm in the Tibetan Plateau to 1700 mm in the mountains of Yunnan (Mekong River Commission Citation2018). In the Upper Salween basin, the annual precipitation ranges from 400 to 2000 mm and averages at 900 mm (Zhou et al. Citation2017). Land cover in the Upper Salween River and Upper Mekong Rivers basins is similar, with forests and other types of vegetation predominating, followed by a substantially smaller portion of croplands (DeFries and Hansen 2010).
2.3 Application of SPED in test catchments
We perform preliminary validation within reference catchments to confirm the suitability of the hydrologic model of choice (HyMOD, Moore Citation1985, Citation1999, Wang et al. Citation2009) in each region of study. Following Alipour and Kibler (Citation2018), preliminary testing consists of traditional single-objective model calibration and validation against data observed within gauged reference catchments. Thus, calibration is performed to maximize runoff efficiency:
where NSE is the Nash–Sutcliffe runoff efficiency, is observed streamflow in time step t,
is modeled streamflow in time step t, and
is the mean value of observed streamflows in time T.
The hydrological model of choice, HyMOD, is a lumped conceptual model that predicts flow based on simulated probability distributions of soil moisture across a catchment (Wang et al. Citation2009). The distribution of soil moisture capacity across the catchment is represented using a cumulative distribution function (CDF):
where is soil moisture capacity,
is the maximum soil moisture capacity of the catchment and
is a shape factor that defines the degree of spatial variability in soil moisture capacity across the catchment. Other parameters of HyMOD (besides
and
) include
(inverse of residence time in quick reservoirs),
(inverse of residence time in a slow reservoir) and
(a fraction coefficient for distribution of water between slow and quick reservoirs). Interested readers are referred to Wang et al. (Citation2009) and Moore (Citation1985, Citation1999) for a more comprehensive description of HyMOD. We use a modified formulation of the 5-parameter HyMOD model, including addition of a minimum soil moisture capacity parameter,
, which may be greater than zero, to the HyMOD CDF of soil moisture capacity (c) (see Jayawardena and Zhou Citation2000, Post Citation2009, Wang Citation2018, for similar modifications to soil moisture capacity modeling). The new soil moisture capacity CDF is formulated as:
Parameters ,
, and
define the capacity of soil for storing water. For instance, a high value for
indicates that during dry periods, even a large rainfall event may not result in initiation of saturation excess overland flow and consequently increased river flows. A high value for
indicates more stable base flows, fewer days with zero flow, and higher constancy of flow. For
, a parameter describing the shape of the soil moisture CDF, a value between zero and one indicates a soil moisture capacity CDF that is convex, while values greater than one indicate a concave CDF.
The new formulation of HyMOD in this study was coded into MATLAB (Mathworks Citation2016) in a configuration that can process 62 500 different combinations of model parameters within 10 min on a typical processor (Intel Core i7-5500U at 2.40 GHz). In each reference catchment, we first calibrated HyMOD to maximize NSE by running 62 500 different parameter combinations through the branch-and-bound method described by Alipour and Kibler (Citation2018) and validated with data from a different time period.
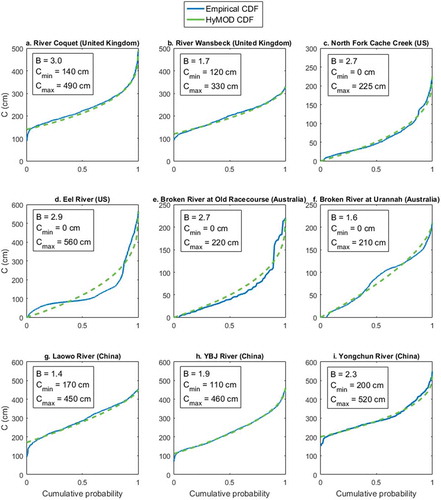
After confirming the suitability of the model in each region, the SPED process was applied in each target-reference catchment pair. To mimic circumstances within severely data-scarce regions, we utilize regional-scale gridded databases to estimate precipitation and temperature in each study location (). The approach of Thornthwaite (Citation1948) is used to estimate potential evapotranspiration (PET) from temperature data. Daylight length is estimated using the model of Forsythe et al. (Citation1995), which uses latitude and day of the year for its estimations. Global data on total available water capacity (WISE30sec dataset, Batjes Citation2015) and depth to bedrock (SoilGrids250m dataset, Hengl et al. Citation2017) were combined to estimate spatial variability in soil moisture capacity (cm) in each reference/target catchment at a resolution of about 0.06 km2. From this spatial dataset, an empirical CDF of soil moisture capacity was constructed for each catchment (), to which we fitted the HyMOD soil moisture capacity CDF (Eq. 3). A priori parameter values of ,
, and
were thus estimated for each catchment using only globally available data, as the best HyMOD CDF fit to the catchment’s own empirical CDF (). Given the substantial uncertainties associated with global-scale coverage of soil properties, we consider these data as “soft” data and estimate a priori parameter values in the form of trapezoidal fuzzy numbers. Soil moisture capacity distributions estimated by such highly uncertain data may contain errors. In some regions, for example, the empirical CDF may exhibit a threshold behavior, such as near-vertical increase in the value of
as the CDF approaches the upper end of the distribution,
. Such behavior is consistent with likely presence of anomalous data contained in the highly uncertain soil databases. Application of quality assurance procedures to identify and disregard spurious data are recommended. We recommend that when the ratio of the top 5% of the distribution to the full distributional range exceeds a value of around 0.4, the 95th percentile value of the distribution should be selected as
.
Figure 3. Soil moisture capacity (c) and parameter values estimated a priori from soft data (,
, and
values are for fitted HyMOD CDFs to the empirical CDFs).
A priori values for parameters ,
and
were incorporated into a four-part multi-criteria objective function (Eq. (4), similar to the three-part objective function developed by Alipour and Kibler Citation2018), used to calibrate the model in each reference catchment. The multi-criteria objective function simultaneously maximizes runoff efficiency (minimizes 1 – NSE) while minimizing the difference between a priori and calibrated estimates for each parameter. Since at this time we were unable to provide a priori estimates for the other HyMOD parameters (
,
and
), they were incorporated into the objective function only by their contribution to maximizing runoff efficiency. The four criteria (maximized NSE, calibrated values of
,
and
that are similar to a priori estimates) were weighted based upon their relative importance, level of certainty in a priori parameter estimates, and degree of similarity between a priori estimates in the reference and target catchments ()). For instance, if the a priori estimate for parameter
(or
, or
) in a reference catchment was similar (dissimilar) to that in the corresponding target catchment, a higher (lower) weight was assigned to the criterion associated with that parameter. By comparing of empirical CDFs in paired reference-target catchments, degree of catchment similarity with respect to influential parameters can be discerned. If reference and target catchments were quite similar (dissimilar) with respect to a given parameter, we were able to signify (de-signify) the importance of calibrating this parameter close to its a priori value in the reference catchment through weighting. Since subjectivity in weighting may be unavoidable and the a priori estimates were associated with high uncertainties, we used triangular fuzzy weights to partially account for uncertainty in criteria weighting.
The feasible ranges of (typically in the range 5–8000 mm),
(typically in the range 0–1500 mm), and
(typically 0–6) were tailored to each study area based on ranges suggested by a priori parameter estimates in each region. To normalize objectives associated with a priori estimates of parameter values, we divided the difference between the a priori estimate and calibrated value of a parameter with half the feasible range of that parameter (Eq. (4)). If the resulting value was greater than 1, we assigned a value of 1 to that objective (without application of its weight):
where is the estimated trapezoidal fuzzy value of parameter i,
is the estimated value for parameter i by model calibration,
and
are the upper and lower feasible limits for parameter i,
is the fuzzy weight assigned to criterion i,
is the weight assigned to criterion n + 1, and “defuzz” denotes the defuzzification process through the centroid method (Sugeno Citation1985). Through this process, calibrated values that diverge sharply from a priori estimates are excluded and the optimization process is directed towards values that more closely match a priori parameter estimates, while balancing high runoff efficiency.
The multi-criteria objective function (Eq. (4)) was optimized in each reference catchment by analyzing 62 500 different parameter combinations, using the same branch-and-bound method as applied in single-objective calibration. The value of the optimization objective function (OF value) is normally between 0 and 1 (OF can be greater than 1), where zero indicates streamflow predictions which perfectly mirror observed values as well as calibrated parameter values which perfectly mirror a priori estimates. The parameter values estimated through multi-objective calibration in each reference catchment are transferred to target catchment(s) for streamflow prediction.
2.4 Assessment of SPED predictions
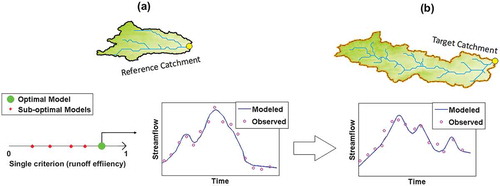
We evaluate the predictive skill of SPED in the six target catchments, as compared to the performance of models selected by traditional single-objective calibration. We perform single-objective calibration, to maximize runoff efficiency, in reference catchments and transfer models for prediction in all target catchments (). SPED performance is evaluated relative to that of the single-objective model through comparisons of model prediction accuracy and model parameter residuals (Eq. (5)) for influential parameters (,
and
). To evaluate accuracy of model predictions, we compare NSE for daily streamflow and quantitative flow metrics indicating flow magnitude (3-day minimum and maximum, total runoff volume), and frequency and duration of low flows (average number of days below Q75 of observed flow) and high flows (average number of days above Q25 of observed flow) (Richter et al. Citation1997).
Figure 4. Application of single-objective calibration to runoff efficiency: (a) from multiple potential models (red points) the model with greatest NSE is selected as optimal (green point); and (b) the optimal model selected from the reference catchment is transferred to the target catchment(s) for prediction.
Parameter residuals indicate how well the empirical CDF for soil moisture capacity in a catchment is represented by different modeling approaches. We note here that empirical CDFs are created using data associated with high uncertainties, and thus are perhaps themselves imperfect representations of true catchment condition. However, in areas of the world lacking more complete data, such soft data may still improve understanding of true catchment condition. Thus, inclusion of soft data in modeling has been recommended over rote calibration to only maximize runoff efficiency (e.g., Seibert and McDonnell Citation2002). Parameter residuals for comparison between models are calculated as follows:
where is the parameter residual,
is the centroid of a priori parameter values estimated with soft data, and
is the calibrated parameter value.
Finally, we compare the runoff efficiencies of SPED simulations in the UK, USA, and Australia, which are generated under simulated severe data-scarcity, to those achieved in prior studies utilizing robust data networks and state-of-the-art prediction methods. The transformation of data-rich regions into synthetically data-scarce regions was accomplished by assuming the availability of only one gauged reference catchment and by using lower-quality (regional/global scale) data to estimate precipitation and temperature (). By contrast, prior studies had utilized the full suite of information available in these well-gauged regions (e.g. multiple gauged reference catchments and high-quality observed climatic data). In each catchment, we modeled the same time periods presented in prior studies.
3 Results
3.1 Prediction performance of SPED
With respect to runoff efficiency, streamflow predictions generated by the SPED framework in six geographically diverse target catchments are acceptable (NSE range: 0.54–0.74, ). Since the single-objective model is calibrated to only maximize runoff efficiency in the reference catchments, calibration performance of the single-objective model with respect to NSE is expectedly always greater than that of SPED (NSE range: 0.61–0.82 versus 0.48–0.79, ). However, prediction performance of the two models are comparable and even sometimes substantially higher by SPED (). Performance of SPED and the single-objective model is comparable in River Coquet for the period October 1989–September 1994 (both NSE of 0.63, , ). Comparison of flows simulated by the single-objective model and SPED against observed data (, ) indicates that the single-objective model better represents low flow magnitudes (29% error for 3-day minimum) than SPED (–52%). While both models do not estimate extreme high flows very well, these events are slightly better modeled by the single-objective model (). Moderate and high flows, on the other hand, are more accurately predicted by SPED (–14% error for total runoff volume) than the single-objective model (–22%). While both models perform comparably in estimating high flow duration, low flow duration is overestimated by the single-objective model (229% error versus – 14% for SPED).
Table 2. Prediction performance of SPED and the single-objective model with respect to runoff efficiency and parameter residuals.
Table 3. Calibration performance of SPED and the single-objective model with respect to runoff efficiency.
Table 4. Observed flow metric values versus modeled values by the single-objective approach and SPED in target catchments. For SOM* and SPED the first value under each river is the absolute value and the second value is percent change with respect to the observed value; *Single-Objective Model).
Figure 5. Flow duration curves (FDCs) and example validation hydrographs for portions of each prediction period in (a) River Coquet at Morwick, (b) North Fork Cache Creek, (c) Broken River at Old Racecourse, (d) Broken River at Urannah, (e) Laowo River, and (f) YBJ River. Runoff efficiencies displayed are relative to the entire prediction periods.
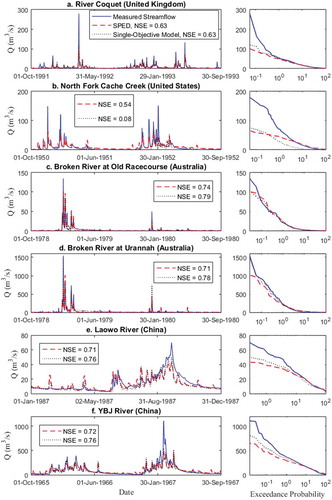
In North Fork Cache Creek (), for the validation period, January 1950–August 1955, SPED substantially outperforms the single-objective model (NSE of 0.54 versus 0.08, total runoff volume residual of 3.30 × 10⁸ m3 versus – 7.68 × 10⁸ m3, and ). Notably, the single-objective model predicts only 26% of the observed runoff volume. While both models struggle to estimate magnitudes of extreme high flows (), moderate to high flows are better predicted by SPED (–55% error versus – 87%, for 3-day maximum). Three-day minimum flows are better represented by the single-objective approach (), however the single-objective model overestimates the duration of low flows (78% error) while SPED overestimates low flows such that duration below Q75 is predicted to be zero days. The case is however opposite for high flow duration, where SPED overestimates high flow duration (75% error) and the single-objective model estimates a duration lower than observed (–44% error).
For the 10-year period of September 1975–August 1985, SPED and the single-objective model perform comparably in Broken River both at Old Racecourse (NSE of 0.74 versus 0.79, , ) and at Urannah (NSE of 0.71 versus 0.78, , ). At Old Racecourse, most flow metrics and the flow duration curves (FDCs) are modeled comparably by SPED and the single-objective approach ( and ). At Urannah, comparison of flows simulated by the single-objective model and SPED against observed data (, ) indicate a better performance by SPED in modeling high flows and total runoff volume (3% error for 3-day maximum and 54% error for total runoff volume) than the single-objective model (27% and 72%). The single-objective model however performs considerably better in modeling extreme high flows () as well as low flows (695% error for 3-day minimum) than SPED (2670%).
In the Laowo River for the period January 1987–December 1987 (NSE of 0.71 versus 0.76, , ) and the YBJ River for the 20-year test period (1962–1973, 1975/76, 1978–1980, 1984/85 and 1987) (NSE of 0.72 versus 0.76, , ), there is little difference in performance of SPED and single-objective models. In the Laowo River, where only one year of observed data is available, FDCs indicate a better performance by SPED with respect to the majority of flow sizes (bottom 90%), while the very largest flows are better modeled by the single-objective model (). In the YBJ River, the single-objective model better represents low flow magnitudes (9% error for 3-day minimum flow) and durations (37% error for low flow duration) than SPED (96% and 77%, respectively). Performance of the models is similar with respect to 3-day maximum flow (–21% error for SPED versus −10% for the single-objective model), total runoff volume (12% error for SPED versus 1% for the single-objective model) and high flow duration (–46% error for SPED versus – 50% for the single-objective model). Similar to Laowo, the very largest flows (top 10%) in YBJ are better modeled by the single-objective model ().
3.2 Parameter estimation performance
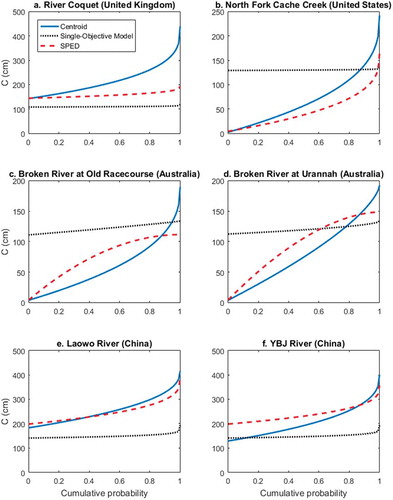
As SPED is designed to select parameter sets which are similar to a priori estimates while the single-objective model only aims at maximizing runoff efficiency, soil moisture capacity CDFs modeled by SPED exhibit closer resonation with empirical CDFs than the CDFs modeled by the single-objective approach in all six target catchments (). However, in some of the catchments, in particular River Coquet (), the CDF modeled by SPED still displays significant difference from the empirical CDF. All three parameters ,
and
are modeled with lower residuals by SPED than the single-objective approach in the River Coquet (residuals of 0.33 versus – 2.83 for
, 2465 versus 3206 mm for
and – 14 versus 347 mm for
, ), North Fork Cache Creek (residuals of – 0.2 versus – 1.47, 788 versus 1084 mm and – 17 versus – 1267 mm, respectively, ) and Laowo River (residuals of – 0.66 versus – 3.65, 302 versus 2227 mm and – 154 versus 420 mm, respectively, ). In the Broken River at Urannah, SPED performs better in modeling
(residual of 435 mm versus 583 mm) and
(residual of – 3 mm versus – 1086 mm), but
(residual of 0.90 versus – 0.31) is better modeled by the single objective approach. Similarly, in the YBJ River two parameters exhibit lower residuals when modeled by SPED (–0.4 versus – 3.39 for
and 441 versus 2070 mm for
, while for
residuals were – 696 versus – 123 mm, ). In the Broken River at Old Racecourse, despite that the single-objective modeling yields lower residuals than SPED for the two parameters of
(1.98 versus 1.37, ) and
(779 versus 557 mm, ), SPED does a much better job in modeling
(–3 versus – 1072 mm) so that its CDF is closer to the empirical CDF than the single-objective model. Overall, OF values summarizing performance in terms of both runoff efficiency and soil moisture capacity modeling are lower (with zero as the ideal value) for SPED than the single-objective modeling in all six target catchment ().
3.3 SPED performance compared to predictions using robust data networks
The SPED framework performs reasonably close to and sometimes even exceeds the performance of prediction approaches based on more robust data networks in all study locations. In the River Coquet, SPED performs similarly to the best regionalization case tested by McIntyre et al. (Citation2004) with respect to runoff efficiency, with the same NSE of 0.63 (). For the case of North Fork Cache Creek in California, the proposed approach by Parada and Liang (Citation2010) performs marginally better than SPED with respect to overall runoff efficiency (NSE of 0.66 versus 0.54, ). However, SPED performs significantly better than the regionalization approach of Post (Citation2009) in predicting streamflow for the 10-year period September 1975–August 1985 for both Broken River at Old Racecourse (NSE of 0.74 versus 0.43, ) and Broken River at Urannah (NSE of 0.71 versus 0.22, ).
Table 5. Runoff efficiency of streamflow predictions generated by SPED using a synthetically sparse data network and by previous studies using the full data network.
4 Discussion
Streamflow predictions generated using the SPED framework and (artificially or truly) sparse observed data networks are satisfactory in terms of runoff efficiency across a diverse geography of six target catchments (NSE range: 0.54–0.74, ). SPED exhibits a high degree of flexibility and performs consistently and acceptably within diverse hydro-climatological regions. Furthermore, the quality of streamflows predicted by SPED is consistent, whether applied in a truly poorly gauged region of southwestern China (Laowo and YBJ catchments), or within well-gauged regions with a synthetically sparse dataset (, ). Regional-scale gridded precipitation and temperature data used in some of the synthetically data-poor regions were of higher resolution and quality (e.g. precipitation data in Australia has 0.05° resolution) than may be available in many regions worldwide. However, data of the quality and resolution applied to model the truly poorly gauged catchments in China may now be found at a global scale. That streamflows are predicted with reasonable accuracy (NSE of 0.71–0.72) in the truly poorly gauged basins, using only low-quality available data, indicates that SPED may be applicable even in the world’s most data-poor regions.
4.1 SPED may alleviate problems of equifinality as compared to single-objective calibration
With respect to runoff efficiency, SPED performed similarly to models calibrated to the single objective of maximizing NSE (). The slightly greater efficiency achieved by single-objective models reflects that the model calibration process was unconstrained, with a single objective of attaining the greater runoff efficiency. By comparison, the multi-criteria SPED calibration process balanced runoff efficiency with the selection of a representative parameter set. The trade-offs in runoff efficiency were, for the most part negligible. But, in comparison with the single-objective approach, values of influential model parameters selected by SPED were almost always more similar to parameter values estimated a priori by analysis of catchment data (). We note that there are few instances where residuals of individual parameters are lower in the single-objective model (e.g. YBJ, Broken River at Urannah and Old Racecourse). However, even in these cases, soil moisture capacity CDFs modeled by SPED more closely resemble empirical CDFs compared to those modeled by single-objective models (). This behavior is not surprising, given that the multi-criteria objective function engine of SPED is designed to do just this; select parameter sets which are similar to a priori estimates. This design allows SPED to rank equifinal models – models with similar NSE but different parameter sets and to assign preference to models that represent a best approximation of catchment conditions from available data. For instance, the relatively low parameter residuals achieved for SPED parameter sets () indicate that SPED has substantially improved the representation of subsurface processes in study catchments (). However, the corresponding NSE values are similar to those attained by models selected solely based on the ability to replicate observed streamflows. This indicates that little compromise to runoff efficiency is needed to achieve the observed improvement to process representation.
Figure 6. Soil moisture capacity CDFs, as modeled by the single-objective model and SPED, compared to those derived through analysis of soft data in target catchments.
That runoff efficiencies of SPED and single-objective models are similar, even as parameters estimated by the two models often indicate different hydrologic behaviors, reflects the classic and persistent problem of equifinality in calibration of hydrological models. Uncertainty related to equifinality is particularly troublesome for prediction in ungauged basins, given lack of validation capacity in truly ungauged catchments. In such catchments, the transfer of parameters calibrated in donor catchments is often done “in the blind”, with limited capacity for validation. Increased assurance that selected parameters represent true hydrologic behavior is a benefit to a practitioner who must make decisions based on their confidence in the model. For instance, this problem is exemplified in North Fork Cache Creek in California. It is interesting to note that runoff efficiency achieved during calibration of the single-objective model in the donor catchment (in this case, Eel River below Scott Dam, NSE of 0.62, ) exceeds that achieved through SPED (NSE of 0.48, ). However, when the single-objective model is transferred for prediction in North Fork Cache Creek, the selected model utterly fails to estimate observed streamflows (NSE of 0.08). On the other hand, SPED predictions in North Fork Cache Creek are more robust, estimating streamflows with acceptable accuracy (NSE of 0.54). This example indicates that, by representing soil moisture distributions based on empirical CDFs, SPED is more robust and consistent in performance than the single-objective model, even when the efficiency of predictions is the only factor that matters to a decision-maker.
4.2 SPED performance is comparable to prediction using robust data networks
In the UK, McIntyre et al. (Citation2004) tested whether Bayesian model averaging is preferable to regression for regionalization of hydrological models. The performance of SPED in River Coquet is similar to the best regionalization case presented by McIntyre et al. (Citation2004), both with NSE of 0.63 (). McIntyre et al. (Citation2004) achieved this performance level by selecting the optimum parameter sets given by the two most similar catchments (in terms of catchment descriptors such as catchment area, standardized annual average rainfall, and base flow index), which were chosen from a network of 30 gauged catchments across the UK. Additionally, high-resolution observed daily rainfall data were applied to force the models. SPED, on the other hand, was calibrated for prediction in the River Coquet using only one gauged reference catchment and lower-quality regional precipitation data for predictions.
In the USA, Parada and Liang (Citation2010) applied the physically distributed VIC-3L model to predict streamflow in North Fork Cache Creek in California. While runoff efficiency of SPED predictions in North Fork Cache Creek is acceptable (NSE of 0.54), Parada and Liang’s approach predicts streamflow with slightly greater efficiency (NSE of 0.66). Parada and Liang (Citation2010) ran the default VIC-3L model using daily gridded meteorological data (precipitation, wind speed, and minimum and maximum daily temperature), as well as soil and vegetation parameters at a resolution of 0.125°. They also used observed streamflow data from two gauged reference catchments. The SPED predictions reported herein, on the other hand, were generated using a lumped conceptual hydrologic model (HyMOD), which is much less data-intensive than VIC-3L model, precipitation, temperature and subsurface information at much lower resolution and streamflow data from only one reference catchment.
In Australia, Post (Citation2009) regionalized the IHACRES rainfall–runoff model for prediction in several locations within the Burdekin catchment. In the Broken River, regionalization proved a more efficient prediction technique as compared to local calibration/simulation at the Old Racecourse gauge, while the opposite was true for the Urannah gauge. We report substantially higher runoff efficiencies based on the application of SPED (, NSE of 0.74 at Old Racecourse and 0.71 at Urannah) in comparison with Post’s approach (, NSE of 0.43 at Old Racecourse and 0.22 at Urannah). Post (Citation2009) reports results of a simplified regionalization technique, requiring only daily rainfall, mean wet season rainfall, stream length and percent cropping/percent forest. However, such data are required for a large number of reference catchments to develop regionalization relationships. Quality of available precipitation and land cover data may thus heavily influence the performance of the approach in data-poor regions. Using regional rainfall and temperature data, streamflow data from one reference catchment and globally available subsurface data with high uncertainties, the SPED framework was able to generate more accurate predictions in both catchments.
In summary, SPED performs comparably or exceeds runoff efficiency performance in three of the four catchments for which previous studies predict streamflow using the full, more robust data networks. In the remaining catchment (North Fork Cache Creek in California), runoff efficiencies are reasonably close (), suggesting little degradation in model performance despite the lower quantity and quality of data used. While the prior studies utilized robust data networks, which enabled more sophisticated modeling, including regionalization, SPED performed comparably or better while using data from fewer reference catchments and data associated with greater potential uncertainties (e.g., low-resolution coverages for subsurface characterization, precipitation, and temperature). However, some models used in prior studies, such as the regionalization technique by Post (Citation2009), are considerably simpler than the modeling approach used in this paper and can be applied to a large number of catchments efficiently. Thus, indeed, part of the noted improvement in some of the study catchments can be attributed to the modeling approach applied herein (choosing one nearby gauged reference catchment), as well as the hydrologic model used (HyMOD) rather than the SPED framework itself. For instance, runoff efficiencies achieved for the single-objective model in some catchments are similar to or exceed those reported in previous modeling studies (e.g., in the Australian catchments and River Coquet, and ). While maintaining this advantage, the SPED framework adds further performance consistency and realistic parameter estimation to the modeling process. Consequently, SPED performs reasonably close to the Parada and Liang (Citation2010) modeling approach in North Fork Cache Creek, where the single-objective model fails to predict streamflow acceptably. Such comparable or improved performance of streamflow prediction using SPED is particularly meaningful given the volume of data-poor places in the world where water managers struggle to apply data-rich technologies.
4.3 Scientific contribution of SPED to hydrologic process understanding in poorly gauged regions
The ability to systematically differentiate equifinal parameter sets to select models that accurately represent estimated catchment conditions is perhaps the most important contribution of SPED to hydrologic process understanding within poorly gauged regions. While understanding catchment condition through the use of soft data is associated with uncertainty, broadly available soft datasets can be incorporated into modeling by water managers around the world to ground traditional hydrologic model calibration within realistic parameter sets. The SPED approach is a mechanism for using such data while acknowledging the inherent uncertainties. Alipour and Kibler (Citation2018) presented preliminary analyses suggesting that the incorporation of preliminary process understanding through inclusion of soft global-scale data led to more accurate model parameterization, without sacrificing runoff efficiency in two catchments of southwestern China. In this study, it is demonstrated that the SPED framework is sufficiently flexible to perform consistently in different climatological conditions and physiographic settings (NSE range: 0.54–0.74, ). Comparable performance with previous flow prediction studies that require robust data also indicates the merits of the SPED framework. Since the number of study catchments is limited, we however need to be careful about making general conclusions about the associations between modeling results and climatic and physiographic characteristics of the study regions.
A closer look at the modeled hydrographs and FDCs () sheds some light into why differentiating equifinal models can be so important in modeling. In five of the six target catchments, the single-objective model more accurately models extreme high flows, while moderate to low flows are consistently modeled either comparably or better by SPED (). This performance difference can be explained by examining differences in soil moisture capacity CDFs generated by the two models (). The difference between and
in CDFs modeled by the single-objective model is small (relative to SPED CDFs) in all six target catchments (). Under this condition, when a catchment reaches
, from there it can quickly attain
. Reaching
means that the entire catchment is saturated and additional rainfall becomes surface runoff, quickly contributing to streamflow. The single-objective model thus often predicts somewhat binary behavior, whereby the catchment is either “on” or “off”, producing flashy streamflows. By contrast, the greater difference between
and
modeled by SPED indicates a more balanced catchment behavior, where different parts of the catchments become gradually saturated, approximating expansion of variable source areas. Thus, SPED CDFs prove to be more efficient in modeling moderate flow magnitudes ().
The influence of model parameterization to process representation can further be illustrated by North Fork Cache Creek ( and ) where SPED remains skillful (NSE of 0.54) while traditional model calibration fails (NSE of 0.08). The single-objective model here estimates a value for close to
, while the empirical (and thus SPED) CDFs indicate a
value close to zero (). A high value for
indicates that small events often cannot attain sufficient soil moisture in any part of the catchment to generate streamflow. Streamflows will be substantial only after long/intense rainfall events. This clearly does not resemble the hydrograph behavior in the catchment (). Consequently, the hydrograph modeled by the single-objective approach fails to represent low and medium flows (except near zero flows) and only captures some of the highest flows in the catchment (). Please note that a sufficiently long spin-up period was assigned for modeling in all catchments and about two-thirds of the single-objective predicted streamflow data between October 1950 and December 1951 presented in are non-zero values. Thus, poor performance of the single-objective model cannot be associated with lack of a spin-up period for filling up the soil reservoir. The SPED parameterization, on the other hand, is able to correctly represent the impact of smaller rainfall events and the fluctuations they cause in the streamflow () by estimating more representative soil moisture capacity in the catchment (). That extreme high flows are better modeled by the single-objective model indicates that processes controlling the generation of peak flows are perhaps not sufficiently represented by the 6-parameter HyMOD model. While this model deficiency is obscured in the single-objective model by strict calibration to observed flows, this does not necessarily indicate that the single-objective model is able to better model these processes.
Further analysis of results in North Fork Cache Creek clarifies why the two models deviate substantially in estimating soil moisture capacity CDF and exemplifies another aspect of contribution to hydrologic process understanding that is made possible through application of the SPED framework. A key challenge of flow prediction in ungauged basins is reliance on data from hydrologically similar gauged catchments, which is scarce in regions with poor observed flow networks. Poor prediction skill results when the reference and target catchments are dissimilar. Results from North Fork Cache Creek indicate that the SPED framework is robust to some level of catchment dissimilarity. Analysis of streamflow hydrographs in North Fork Cache Creek (target catchment) and Eel River (reference catchment) indicate divergent hydrologic behaviors (), though the two catchments are adjacent (). Eel River has a stable base flow regime (base flow index of 0.16) and flow almost never drops below 0.1 mm/day. On the other hand, baseflow in North Fork Cache Creek is very low (base flow index of 0.003) and total river flow is frequently below 0.1 mm/day. Because traditional single-objective calibration is tuned to estimate parameters solely based on the best fit between calibrated and observed streamflows in the reference catchment (Eel River), the resultant single-objective model aims at fitting a curve that has a stable base flow regime and simultaneously accounts for seasonal high flow events. For instance, a soil moisture capacity CDF with high threshold for initiation of saturation excess (high , ) is selected. This allows for greater soil storage, which translates into stable base flows. High flows occur in the case of large events that fill the high storage capacity of the soil. While this CDF well serves the task of maximizing calibration runoff efficiency (NSE of 0.62), global soil data indicate that it may not correspond with reality very well. There could be several other parameterizations that produce comparable runoff efficiencies for the calibration (equifinality), but managers have no way of differentiating them. Due to the only partial similarity between Eel River and North Fork Cache Creek, just a few of these parameterizations should work well in North Fork Cache Creek as well. By incorporating soft data in calibration, the SPED procedure selects parameters that better resonate with global soil data, even though this comes with a lower calibration efficiency (NSE of 0.48). When the two models are transferred to North Fork Cache Creek for prediction, the single-objective model fails to predict streamflow (NSE of 0.08), while SPED still takes advantage of the partial similarity between the two catchments and keeps a satisfactory prediction skill (NSE of 0.54). This example illustrates that through incorporation of soft data, rather than relying only on rote calibration, SPED also contributes to hydrologic process understanding within poorly gauged regions by eliminating parameter sets that could only be identified as poorly-performing if the reference and target catchments were significantly dissimilar with respect to some catchment processes.
Figure 7. Observed hydrographs in North Fork Cache Creek and Eel River (USA).

4.4 SPED limitations and directions for future research
Questions may arise about the high-performance level of the single-objective approach in the target catchments, in particular in the Australian catchments. As in North Fork Cache Creek, the soil moisture CDFs selected by the single-objective model do not match well the catchment conditions (). The single-objective model reproduces streamflow accurately despite the poor representation of soil moisture capacity because the target and reference Australian catchments are hydrologically similar (). A model that estimates streamflow with high efficiency in the reference catchment is likely to also generate high-efficiency predictions in a hydrologically similar target catchment, even if the model does not represent true catchment processes. This should be particularly true when calibration and prediction periods correspond. Similarly, though the SPED procedure is able to partially represent true catchment processes to distinguish equifinal models, the high weight applied to matching NSE in calibration still leads to mismatch in calibrated and estimated parameter values from soft data. Until the uncertainties of global soil data are highly reduced, there may be no other way than giving the highest weight to NSE and relying heavily on hydrograph matching for calibration.
The SPED framework has been tested using only one hydrologic model (HyMOD). Future research and performance testing of SPED using other hydrological models could further clarify the limitations/merits of the framework. Application of SPED requires specific attention to each target catchment, for example to assemble a priori catchment information. In comparison with regionalization techniques, such as those described by Post (Citation2009) and McIntyre et al. (Citation2004), for application within large geographical areas consisting of several ungauged catchments, catchment-by-catchment application of SPED seems tedious. Another caveat to SPED performance is exemplified by the described anomalies in the soil moisture capacity empirical CDF and difficulty in matching modeled and empirical data. Despite substantial improvements in the estimation of model parameters, there still are cases where parts of the modeled CDF significantly deviate from the empirical CDF (e.g., River Coquet, ), reflecting the challenge of using highly uncertain data. A bimodal calibration and prediction approach and/or a better conceptualization of soil moisture capacity and hydrologic behavior (i.e., a better hydrologic model) can lead to further improvements in this regard. However, models selected using a procedure such as SPED will reflect the quality of available data. The SPED procedure is capable of overcoming equifinality challenges only to the extent that data uncertainties allow representation of true catchment condition. As the ability to accurately describe catchment and atmospheric conditions improves, for instance through advances in remote sensing, applications for modeling with frameworks such as SPED also improve accordingly.
5 Conclusions
Herein the SPED framework was tested in diverse hydro-climatic regions. Accuracy of multi-criteria SPED predictions were tested against single-objective models and also compared to results of previous modeling studies in four synthetically poorly gauged catchments. SPED performance was also compared to single-objective models in two catchments located in a truly poorly gauged region of southwestern China, demonstrating its potential for wide applicability in data poor regions. Preliminary process understanding by more representative modeling of catchment soil moisture capacity and associated processes helps SPED better decipher equifinal models. This enhances SPED performance where traditional flow prediction models are likely to fail: handling partial dissimilarity between reference and target catchments. In North Fork Cache Creek in California where partial dissimilarity with Eel River (reference catchment) in precipitation pattern and physiographic setting leads to different base flow regimes, SPED outperforms the single-objective model (NSE of 0.54 versus 0.08). In other study regions where reference and target catchments are similar in climatological conditions and physiographic settings, SPED and single-objective models perform comparably in predicting streamflow (NSE range: 0.63–0.74 versus 0.63–0.79). SPED performance is robust and consistent across the diverse climatological conditions and physiographic settings of the test (NSE range: 0.54–0.74 in all six target catchments). Additionally, model parameters selected by SPED may offer superior representation of soil moisture capacity in all study catchments, as compared to empirical distributions. This is reflected in the multi-criteria OF value range of the models selected by SPED (0.22–0.39, ) compared to the single-objective models (0.52–1.32, ). Finally, SPED prediction skill within synthetically poorly gauged regions with minimum hydrometeorological observation is comparable to or exceeds that achieved by previous state-of-the-science methods applied within the same (well-gauged) regions when the entire data with highest available quality are used (NSE range: 0.54–0.74 versus 0.22–0.66). Thus, SPED represents an important contribution to the science of flow prediction in regions of sparse hydrologic observation, by addressing flow prediction pitfalls such as equifinality, catchment dissimilarity and difficulty utilizing uncertain data.
Acknowledgments
We acknowledge data from the UK National River Flow Archive. We acknowledge the E-OBS dataset from the EU-FP6 project ENSEMBLES (http://ensembles-eu.metoffice.com) and the data providers in the ECA&D project (http://www.ecad.eu). We acknowledge the use of Copernicus data and information funded by the European Union - EU-DEM layers for creation of . We acknowledge the use of HydroSHEDS data available online at http://hydrosheds.cr.usgs.gov. We acknowledge CPC US Unified Precipitation data and GHCN Gridded V2 data provided by the NOAA/OAR/ESRL PSD, Boulder, Colorado, USA, from https://www.esrl.noaa.gov/psd/. We acknowledge the use of data from ArcGIS website (HydroSHEDS (RIV)) (Citation2017), Geoscience Australia (Citation2010), Lehner et al. (Citation2006, Citation2008), Morris and Flavin (Citation1990, Citation1994); US Census Bureau website (Citation2018) and US Geological Survey website (Watershed Boundary Dataset) (Citation2017b) in creating . We are thankful to the China Hydrology Data Project (Henck et al. Citation2010) for digitizing observed data and making them available for research. We would like to thank Dr Dingbao Wang for his advice related to the improvement of HyMOD. Finally, we would like to thank Dr David Post, the other two anonymous reviewers as well as the Associate Editor, Dr Alberto Viglione, for providing insightful and invaluable comments which substantially improved the quality of this paper.
Disclosure statement
No potential conflict of interest was reported by the authors.
References
- Alipour, M.H. and Kibler, K.M., 2018. A framework for streamflow prediction in the world’s most severely data-limited regions: test of applicability and performance in a poorly-gauged region of China. Journal of Hydrology, 557, 41–54.
- ArcGIS website, 2017. HydroSHEDS (RIV) - Europe river network (stream lines) at 30s resolution (Data basin dataset), 2010. Available from: https://databasin.org/datasets/17c21f42e65545589e000c339734f857 [Accessed 2 November 2017].
- Arsenault, R. and Brissette, F., 2016. Multi-model averaging for continuous streamflow prediction in ungauged basins. Hydrological Sciences Journal, 61 (13), 2443–2454. doi:10.1080/02626667.2015.1117088
- Australian Bureau of Meteorology website, 2017. Precipitation data owner: Queensland - Department of Natural Resources and Mines (downloaded from TERN AusCover website (2017)). Available from: http://data.auscover.org.au/xwiki/bin/view/Product+pages/Product+User+Page+Melbourne+2 [Accessed 26 November 2017].
- Batjes, N.H., 2015. World soil property estimates for broad-scale modelling (WISE30sec, Ver. 1.0). Report 2015/01, ISRIC—World Soil Information. Wageningen. Available from: http://www.isric.org/data/data-download [Accessed 10 November 2016].
- Beven, K., 1993. Prophecy, reality and uncertainty in distributed hydrological modelling. Advances in Water Resources, 16 (1), 41–51. doi:10.1016/0309-1708(93)90028-E
- Beven, K., 2006. A manifesto for the equifinality thesis. Journal of Hydrology, 320 (1–2), 18–36. doi:10.1016/j.jhydrol.2005.07.007
- Blöschl, G., et al., eds., 2013. Runoff prediction in ungauged basins: synthesis across processes, places and scales. Cambridge: Cambridge University Press.
- Chinese Ministry of Hydrology, 1970. Hydrologic yearbook: Yunnan-Tibet International Rivers District, District 9 Region 2 1965, [in Chinese]. Beijing, China: Ministry of Hydrology.
- Chinese Ministry of Hydrology, 1971. Hydrologic yearbook: Yunnan-Tibet International Rivers District, District 9 Region 2 1966, [in Chinese]. Beijing, China: Ministry of Hydrology.
- Chinese Ministry of Hydrology, 1974. Hydrologic yearbook: Yunnan-Tibet International Rivers District, District 9 Region 2 1972, [in Chinese]. Beijing, China: Ministry of Hydrology.
- Chinese Ministry of Hydrology, 1977. Hydrologic yearbook: Yunnan-Tibet International Rivers District, District 9 Region 2 1978, [in Chinese]. Beijing, China: Ministry of Hydrology.
- Chinese Ministry of Hydrology, 1982. Hydrologic yearbook: Yunnan-Tibet International Rivers District, District 9 Region 2 1979, [in Chinese]. Beijing, China: Ministry of Hydrology.
- DeFries, R.S. and Hansen, M., 2010. ISLSCP II University of Maryland global land cover classifications, 1992-1993. In: F. G. Hall, et al., eds. ISLSCP initiative II collection. Data set. Oak Ridge, Tennessee: Oak Ridge National Laboratory Distributed Active Archive Center. Available from: http://daac.ornl.gov/] doi:10.3334/ORNLDAAC/969
- Fan, Y. and van Den Dool, H., 2008. A global monthly land surface air temperature analysis for 1948-present. Journal of Geophysical Research: Atmospheres, 113 (D1). doi:10.1029/2007JD008470
- Forsythe, W.C., et al., 1995. A model comparison for daylength as a function of latitude and day of year. Ecological Modelling, 80 (1), 87–95. doi:10.1016/0304-3800(94)00034-F.
- Geoscience Australia, 2010. Geoscience Australia, 3 second SRTM Digital Elevation Model (DEM) v01. Bioregional Assessment Source Dataset. Available from: http://data.bioregionalassessments.gov.au/dataset/12e0731d-96dd-49cc-aa21-ebfd65a3f67a [Accessed 27 November 2017].
- Gibbs, M.S., Maier, H.R., and Dandy, G.C., 2012. A generic framework for regression regionalization in ungauged catchments. Environmental Modelling & Software, 27, 1–14. doi:10.1016/j.envsoft.2011.10.006
- Hannah, D.M., et al., 2011. Large-scale river flow archives: importance, current status and future needs. Hydrological Processes, 25 (7), 1191–1200. doi:10.1002/hyp.7794.
- Haylock, M.R., et al., 2008. A European daily high-resolution gridded dataset of surface temperature and precipitation. Journal of Geophysical Research D: Atmospheres, 113, D20119. doi:10.1029/2008JD10201.
- Henck, A.H., et al., 2010. Monsoon control of effective discharge, Yunnan and Tibet. Geology, 38, 975–978. doi:10.1130/G31444.1.
- Hengl, T., et al., 2017. SoilGrids250m: global gridded soil information based on machine learning. PLoS One, 12 (2), e0169748. doi:10.1371/journal.pone.0169748.
- Heřmanovský, M., et al., 2017. Regionalization of runoff models derived by genetic programming. Journal of Hydrology, 547, 544–556. doi:10.1016/j.jhydrol.2017.02.018.
- Hrachowitz, M., et al., 2013. A decade of Predictions in Ungauged Basins (PUB)—a review. Hydrological Sciences Journal, 58 (6), 1198–1255. doi:10.1080/02626667.2013.803183.
- Hughes, D.A., 2016. Hydrological modelling, process understanding and uncertainty in a southern African context: lessons from the northern hemisphere. Hydrological Processes, 30 (14), 2419–2431. doi:10.1002/hyp.v30.14
- Jayawardena, A.W. and Zhou, M.C., 2000. A modified spatial soil moisture storage capacity distribution curve for the Xinanjiang model. Journal of Hydrology, 227 (1–4), 93–113. doi:10.1016/S0022-1694(99)00173-0
- Kamali, B. and Mousavi, S.J., 2014. Automatic calibration of HEC-HMS model using multi-objective fuzzy optimal models. Civil Engineering Infrastructures Journal, 47 (1), 1–12.
- Kibler, K.M. and Alipour, M.H., 2017. Flow alteration signatures of diversion hydropower: an analysis of 32 rivers in southwestern China. Ecohydrology, 10 (5), e1846. doi:10.1002/eco.v10.5
- Koutsouris, A.J., Seibert, J., and Lyon, S.W., 2017. Utilization of global precipitation datasets in data limited regions: A case study of Kilombero Valley, Tanzania. Atmosphere, 8 (12), 246. doi:10.3390/atmos8120246
- Lanfear, K.J. and Hirsch, R.M., 1999. USGS study reveals a decline in long-record streamgages. Eos, Transactions American Geophysical Union, 80 (50), 605–607. doi:10.1029/99EO00406
- Lavers, D.A., 2011. Seasonal hydrological prediction in Great Britain–an assessment. Doctoral dissertation. University of Birmingham.
- Lehner, B., Verdin, K., and Jarvis, A., 2006. HydroSHEDS technical documentation. World wildlife fund US. Washington, DC. Available from: http://hydrosheds.cr.usgs.gov [Accessed 9 February 2018].
- Lehner, B., Verdin, K., and Jarvis, A., 2008. New global hydrography derived from spaceborne elevation data. Eos, Transactions American Geophysical Union, 89 (10), 93–94. doi:10.1029/2008EO100001
- Mathworks, 2016. MATLAB software. Natick, MA: The MathWorks, Inc.
- McIntyre, N., et al., 2004. Tools and approaches for evaluating uncertainty in streamflow predictions in ungauged UK catchments. Osnabrück, Germany: International Congress on Environmental Modelling and Software.
- McIntyre, N., et al., 2005. Ensemble predictions of runoff in ungauged catchments. Water Resources Research, 41 (12). doi:10.1029/2005WR004289.
- Mekong River Commission website, 2018. Available from: http://www.mrcmekong.org/[Accessed 14 October 2016].
- Merz, R. and Blöschl, G., 2004. Regionalisation of catchment model parameters. Journal of Hydrology, 287 (1–4), 95–123. doi:10.1016/j.jhydrol.2003.09.028
- Merz, R., Parajka, J., and Blöschl, G., 2009. Scale effects in conceptual hydrological modeling. Water Resources Research, 45 (9). doi:10.1029/2009WR007872
- Merz, R., Parajka, J., and Blöschl, G., 2011. Time stability of catchment model parameters: implications for climate impact analyses. Water Resources Research, 47 (2). doi:10.1029/2010WR009505
- Moore, R.J., 1985. The probability-distributed principle and runoff production at point and basin scales. Hydrological Sciences Journal, 30 (2), 273–297. doi:10.1080/02626668509490989
- Moore, R.J., 1999. Real-time flood forecasting systems: perspectives and prospects. In: R. Casale and C. Margottini, eds. Floods and landslides: integrated risk assessment. Springer Berlin Heidelberg, 147–189.
- Morris, D.G. and Flavin, R.W., 1990. A digital terrain model for hydrology. In: Proc 4th International Symposium on Spatial Data Handling, Vol. 1, 23–27 July Zurich, 250–262.
- Morris, D.G. and Flavin, R.W., 1994. Sub-set of UK 50 m by 50 m hydrological digital terrain model grids. Wallingford: NERC, Institute of Hydrology.
- NOAA/OAR/ESRL PSD website, 2017. Boulder, Colorado, USA. Available from: https://www.esrl.noaa.gov/psd/[Accessed 27 December 2017].
- Oudin, L., et al., 2008. Spatial proximity, physical similarity, regression and ungaged catchments: A comparison of regionalization approaches based on 913 French catchments. Water Resources Research, 44 (3). doi:10.1029/2007WR006240.
- Parada, L.M. and Liang, X., 2010. A novel approach to infer streamflow signals for ungauged basins. Advances in Water Resources, 33 (4), 372–386. doi:10.1016/j.advwatres.2010.01.003
- Parajka, J., et al., 2015. The role of station density for predicting daily runoff by top-kriging interpolation in Austria. Journal of Hydrology and Hydromechanics, 63 (3), 228–234. doi:10.1515/johh-2015-0024.
- Parajka, J., Blöschl, G., and Merz, R., 2007a. Regional calibration of catchment models: potential for ungauged catchments. Water Resources Research, 43 (6). doi:10.1029/2006WR005271
- Parajka, J., Merz, R., and Blöschl, G., 2005. A comparison of regionalisation methods for catchment model parameters. Hydrology and Earth System Sciences Discussions, 9 (3), 157–171. doi:10.5194/hess-9-157-2005
- Parajka, J., Merz, R., and Blöschl, G., 2007b. Uncertainty and multiple objective calibration in regional water balance modelling: case study in 320 Austrian catchments. Hydrological Processes, 21 (4), 435–446. doi:10.1002/(ISSN)1099-1085
- Peñas, F.J., et al., 2014. The influence of methodological procedures on hydrological classification performance. Hydrology and Earth System Sciences, 18, 3393–3409. doi:10.5194/hess-18-3393-2014.
- Perks, A., Winkler, T., and Stewart, B., 1996. The adequacy of hydrological networks: A global assessment, Rep. WMO-740, World Meteorological Organization, Geneva, Switzerland.
- Post, D.A., 2009. Regionalizing rainfall–runoff model parameters to predict the daily streamflow of ungauged catchments in the dry tropics. Hydrology Research, 40 (5), 433–444. doi:10.2166/nh.2009.036
- Post, D.A. and Jakeman, A.J., 1999. Predicting the daily streamflow of ungauged catchments in SE Australia by regionalising the parameters of a lumped conceptual rainfall-runoff model. Ecological Modelling, 123 (2–3), 91–104. doi:10.1016/S0304-3800(99)00125-8
- Richter, B.D., et al., 1997. How much water does a river need? Freshwater Biology, 37, 231–249. doi:10.1046/j.1365-2427.1997.00153.x.
- Seibert, J. and McDonnell, J.J., 2002. On the dialog between experimentalist and modeler in catchment hydrology: use of soft data for multicriteria model calibration. Water Resources Research, 38 (11). doi:10.1029/2001WR000978
- Seibert, J. and McDonnell, J.J., 2013. Gauging the ungauged basin: relative value of soft and hard data. Journal of Hydrologic Engineering, 20 (1), p. A4014004.
- Shiklomanov, A.I., Lammers, R.B., and Vörösmarty, C.J., 2002. Widespread decline in hydrological monitoring threatens pan‐Arctic research. Eos, Transactions American Geophysical Union, 83 (2), 13–17. doi:10.1029/2002EO000007
- Sugeno, M., 1985. An introductory survey of fuzzy control. Information Sciences, 36 (1–2), 59–83. doi:10.1016/0020-0255(85)90026-X
- Swain, J.B. and Patra, K.C., 2017. Streamflow estimation in ungauged catchments using regionalization techniques. Journal of Hydrology, 554, 420–433. doi:10.1016/j.jhydrol.2017.08.054
- Tegegne, G., Park, D.K., and Kim, Y.O., 2017. Comparison of hydrological models for the assessment of water resources in a data-scarce region, the Upper Blue Nile River Basin. Journal of Hydrology: Regional Studies, 14, 49–66.
- Thornthwaite, C.W., 1948. An approach toward a rational classification of climate. Geographical Review, 38 (1), 55–94. doi:10.2307/210739
- UK National River Flow Archive website, 2017. Available from: https://nrfa.ceh.ac.uk [Accessed 3 November 2017].
- US Census Bureau website, 2018. Cartographic boundary shapefiles - states. Available from: https://www.census.gov/geo/maps-data/data/cbf/cbf_state.html [Accessed 9 February 2018].
- USGS website, 2017a. USGS water data for the nation. Available from: https://www.usgs.gov [Accessed 27 December 2017].
- USGS website, 2017b. Watershed Boundary Dataset (WBD). Watershed boundary dataset for California. Available from: http://datagateway.nrcs.usda.gov [Accessed 27 December 2017].
- van Emmerik, T., et al., 2015. Predicting the ungauged basin: model validation and realism assessment. Frontiers in Earth Science, 3 (62). doi:10.3389/feart.2015.00062.
- Vandewiele, G.L. and Elias, A., 1995. Monthly water balance of ungauged catchments obtained by geographical regionalization. Journal of Hydrology, 170 (1–4), 277–291. doi:10.1016/0022-1694(95)02681-E
- Vörösmarty, C., et al., 2001. Global water data: A newly endangered species. Eos, Transactions American Geophysical Union, 82 (5), 54–58. doi:10.1029/01EO00031.
- Vrugt, J.A., et al., 2003. Effective and efficient algorithm for multiobjective optimization of hydrologic models. Water Resources Research, 39 (8). doi:10.1029/2002WR001746.
- Wagener, T., et al., 2013. A synthesis framework for runoff prediction in ungauged basins. chapt, 2, pp.11–28.
- Wang, D., 2018. A new probability density function for spatial distribution of soil water storage capacity leads to the SCS curve number method. Hydrology and Earth System Sciences, 22 (12), 6567–6578. doi:10.5194/hess-22-6567-2018
- Wang, D., Chen, Y., and Cai, X., 2009. State and parameter estimation of hydrologic models using the constrained ensemble Kalman filter. Water Resources Research, 45 (11). doi:10.1029/2008WR007401
- World Meteorological Organization, 2008. Guide to hydrological practices volume I, hydrology – from measurement to hydrological information. 6th ed. WMO-No. 168.
- Yadav, M., Wagener, T., and Gupta, H., 2007. Regionalization of constraints on expected watershed response behavior for improved predictions in ungauged basins. Advances in Water Resources, 30 (8), 1756–1774. doi:10.1016/j.advwatres.2007.01.005
- Yang, T.C., et al., 2004. Application of fuzzy multiobjective function on storm-event rainfall-runoff model calibration. Journal of Hydrologic Engineering, 9 (5), 440–445. doi:10.1061/(ASCE)1084-0699(2004)9:5(440).
- Yapo, P.O., 1996. A multiobjective global optimization algorithm with application to calibration of hydrologic models. PhD dissertation. University of Arizona, Tucson.
- Yapo, P.O., Gupta, H.V., and Sorooshian, S., 1998. Multi-objective global optimization for hydrologic models. Journal of Hydrology, 204 (1–4), 83–97. doi:10.1016/S0022-1694(97)00107-8
- Yasutomi, N., Hamada, A., and Yatagai, A., 2011. Development of a long-term daily gridded temperature dataset and its application to rain/snow discrimination of daily precipitation. Global Environmental Research, 15 (2), 165–172.
- Yatagai, A., et al., 2012. APHRODITE: constructing a long-term daily gridded precipitation dataset for Asia based on a dense network of rain gauges. Bulletin of the American Meteorological Society, 93 (9), 1401–1415. doi:10.1175/BAMS-D-11-00122.1.
- Yu, P.S. and Yang, T.C., 2000. Fuzzy multi-objective function for rainfall-runoff model calibration. Journal of Hydrology, 238 (1–2), 1–14. doi:10.1016/S0022-1694(00)00317-6
- Zhang, Z., et al., 2008. Reducing uncertainty in predictions in ungauged basins by combining hydrologic indices regionalization and multiobjective optimization. Water Resources Research, 44 (12). doi:10.1029/2008WR006833.
- Zhou, X., et al., 2017. Remapping annual precipitation in mountainous areas based on vegetation patterns: a case study in the Nu River basin. Hydrology and Earth System Sciences, 21 (2), 999–1015. doi:10.5194/hess-21-999-2017.