
 ?Mathematical formulae have been encoded as MathML and are displayed in this HTML version using MathJax in order to improve their display. Uncheck the box to turn MathJax off. This feature requires Javascript. Click on a formula to zoom.
ABSTRACT
Two-way interactions and feedback between hydrological and social processes in settled floodplains determine the complex human–flood system and change vulnerability over time. To focus on the dynamic role of individual and governmental decision making on flood-risk management, we developed and implemented a coupled agent-based and hydraulic modelling framework. Within this framework, household agents are located in a floodplain protected by a levee system. Individual behaviour is based on Protection Motivation Theory and includes the options to (1) not react to flood risk; (2) implement individual flood protection measures; or (3) file a complaint to the government. The government decides about reinforcing the levee system, compromising between a cost-benefit analysis and filed complaints from households. We found that individual decision making can significantly influence flood risk. In addition, the coupled agent-based and hydraulic modelling framework approach captures commonly observed socio-hydrological dynamics, namely levee and adaptation effects. It provides an explanatory tool for assessing spatial and temporal dynamics of flood risk in a socio-hydrological system.
Editor S. Archfield Guest editor S. Pande
1 Introduction
Floods are one of the costliest natural hazards worldwide, affecting millions of people every year (CRED and UNISDR Citation2015). As indicated by world-wide statistics, flood damages are continuously increasing (Schanze et al. Citation2007, CRED and UNISDR Citation2015). This trend is likely to continue in the future due to several factors, such as expected increases in heavy precipitation due to climate change (IPCC Citation2012, UNDRR Citation2015); increased settlements and economic assets in floodplains; reduced surface roughness and infiltration (leading to reduced retention) due to land-use changes. The concept of “understanding disaster risk” has been identified as a first action priority in the Sendai Framework for Disaster Risk Reduction (UNDRR Citation2015). Quantitative flood-risk assessment is a valuable tool to address this call and can be a decision-making criterion for prioritizing adaptation strategies (Aerts, et al. Citation2018). Often, flood risk is quantified as the product of a hazard and its consequences, where consequences are defined by exposure or values at risk and vulnerability (Kron Citation2005, EC Citation2007, IPCC Citation2012). While advanced methods for estimating future developments in flood hazard and exposure are rapidly progressing (e.g. Pappenberger et al. Citation2012, Sampson et al. Citation2015, Dottori et al. Citation2016), vulnerability is often considered constant (Muis et al. Citation2015, Haer et al. Citation2016, Aerts et al. Citation2018), which does not reflect the dynamic interaction between humans and floods (Haer et al. Citation2017, Abebe et al. Citation2018). Community policies, governmental decisions and the initiative of individuals, such as implementation of mitigation structural measures (Dubbelboer et al. Citation2017), land-use change and urbanization (Ciullo et al. Citation2017), or purchasing of insurance (Dubbelboer et al. Citation2017, Tonn and Guikema Citation2017), can affect flood vulnerability and exposure over time, which can, in turn, change the frequency and magnitude of flooding. Therefore, to properly understand the temporal and spatial dynamics of risk, human decision making needs to be incorporated in a flood-risk assessment framework.
Recently, the co-evolution of the natural and water subsystems through two-way interactions and feedback has been recognized as crucial for the prediction of long-term water cycle dynamics (Sivapalan et al. Citation2012). Socio-hydrological modelling of flood risk with system dynamics has provided some insights into floodplain processes and risk development over time. For example, Di Baldassarre et al. (Citation2013) conceptualized a coupled human–flood system with a system dynamics approach to investigate the interplay between floods and society, and typical emergent patterns (levee and adaptation effects) have been identified (Di Baldassarre et al. Citation2015).
More specifically, in the context of river floods, structural protection measures play a vital role in flood management strategies. Traditionally, a common structural measure put in place by local governments to fight flooding is levees. By building and heightening levees along the river, flood frequency can be reduced and, thereby, flood hazard lowered (Collenteur et al. Citation2015). However, structural measures have limitations and unintended consequences, such as detrimental ecological changes (Gergel et al. Citation2002), increased population growth in floodplains (Brody et al. Citation2009), or higher downstream water levels (Di Baldassarre et al. Citation2009) that are often neglected. After levee construction, there remains a residual risk that the levee crest is overtopped, or failure occurs for geotechnical reasons (Wolff Citation1997, Pinter et al. Citation2016). Often, the presence of structural flood protection measures evokes a false sense of security (Scolobig et al. Citation2012) in the community, stimulating new developments in the floodplains (Brody et al. Citation2009, Mazzoleni et al. Citation2014) and, thus, changing exposure and vulnerability over time. Husby et al. (Citation2014) provide empirical evidence for this effect by investigating the short- and long-term impacts of a severe flood event in 1953 in The Netherlands on the population dynamics. They found that population growth in the affected communities decreased shortly after the disaster, but increased in the long run in response to the implementation of disaster prevention measures. Thus, paradoxically, residual flood risk can rise as a consequence of structural flood protection measures: this dynamic emerging from human–water interaction, based on community decision making, is known as the “levee effect” (White Citation1945, Baan and Klijn Citation2004, Di Baldassarre et al. Citation2015).
Large engineering solutions, such as levee systems or retention basins, are, however, not the only way of reducing flood risk. Nonstructural and individual flood mitigation measures can successively reduce flood losses (Egli Citation2002, Barendrecht et al. Citation2019). For example, in Mozambique a resettlement programme, combined with measures aiming at reducing vulnerability to floods (including strategies for disaster preparedness, risk management and response capacities) was implemented after severe flooding in 2000 and was able to decrease the damages of the flood event with similar intensity that occurred in 2007 (IPCC Citation2012). Another case is the city of Dresden in Germany, where after a long period without floods, three consecutive floods occurred: a high-intensity event in 2002, a smaller flood in 2006 and, finally, another severe flood in 2013 (Thieken et al. Citation2016). Damages in 2013 were significantly lower than in 2002, presumably due to higher risk awareness and the adoption of private, individual, precautionary measures such as water barriers and adapted interior fitting (Barendrecht et al. Citation2019). This dynamic is referred to as the “adaptation effect”; further examples are summarized by Di Baldassarre et al. (Citation2015).
Recognizing, analysing and quantifying these dynamics emerging from community or individual behaviour can be vital for policymakers and environmental planners when decisions about flood management strategies are to be made.
However, these human–water dynamics in floodplains have been explored either through evidence-based approaches (Ferdous et al. Citation2019a, Citation2019b), or through system dynamics approaches, which do not explicitly take into account the role of individuals, which recently has been acknowledged as of high importance in human–flood interactions (Di Baldassarre et al. Citation2013, Citation2015, Ciullo et al. Citation2017). In fact, risk perception has been shown to be highly heterogeneous among individuals and linked to individual experience of disasters (Dow and Cutter Citation1998). Risk perception influences preparedness levels and the willingness to install mitigation measures which, in turn, determine potential damage. Coupled human and natural systems reveal characteristics of complex systems (An Citation2012, Crooks et al. Citation2018). Complex systems encompass heterogeneous subsystems or agents whose multiple interactions give rise to complex system behaviour (Bar-Yam Citation1997, An Citation2012). Imperfect heterogeneous actors and their individual decisions, activities and interactions can be represented in an agent-based model (ABM) (Wainwright and Mulligan Citation2013). In fact, agent-based modelling has been extensively used to gain a deeper understanding of complexity (An Citation2012) and has been acknowledged to build upon complexity research as a theoretical basis (Sobiech Citation2012). Thus, an ABM seems suitable to model human decision making in quantitative flood-risk assessment.
Agent-based models have been recently applied to flood-risk assessment, analysing mainly different aspects of human behaviour, the effects of flood insurance and risk communication on the development of flood risk over time. In particular, Filatova (Citation2015) set up the so-called RHEA (Risks and Hedonics in Empirical Agent-based land market) model to simulate an urban housing market combining agent behaviour based on an economic theory with empirical data. Haer et al. (Citation2016) adopted protection motivation theory (PMT) to assess the effectiveness of different flood-risk communication strategies. Haer et al. (Citation2017) compared three different behavioural frameworks for the decision making of household agents on investing in loss-reducing measures, namely expected utility theory, prospect theory and prospect theory with adaptation of behaviours through Bayesian updating. Haer et al. (Citation2019) quantified the safe development paradox (levee effect) in Europe with an agent-based approach and further discussed policy implications. Dubbelboer et al. (Citation2017) examined the implementation of flood protection measures and the role of flood insurance with an ABM for the London borough of Camden, in order to develop a new insurance scheme. Tonn and Guikema (Citation2017) investigated different mitigation strategies at community and individual levels using statistical flood-level data. Abebe et al. (Citation2018, Citation2019) developed a new framework for integrating a hydraulic model into an ABM to represent individual and institutional decision making during flooding.
The purpose of this study is to contribute to understanding temporal changes in community flood-risk assessment by investigating the combined use of individual and community protection measures, the effects of levee failure due to overtopping on the decision-making process and the influence of individual risk perception on institutional/governmental decision-making.
A coupled agent-based and hydraulic (ABMH) modelling framework is developed and implemented to fully capture the role of individual and governmental decision making on flood-risk management. In particular, the following research questions were posed:
How do changes in vulnerability of individuals influence community flood-risk dynamics?
How do different parameters shape model outcomes and how significant is the role of individual decision making for flood-risk development?
The ABM component of the framework is used to evaluate individual and governmental decision making at each model time step. The coupled flood model assesses water level in each cell of the domain, which is used to assess community flood risk in terms of annual damage, only when the levee protecting the community breaches due to overtopping. Different water-level scenarios were simulated over 50 years for a synthetic case study based on topographical data from the floodplain of the city of Boretto, along the Po River, in northern Italy.
The first research question aims to test the validity of the model. For this, the coupled ABMH model is applied to the case study and observed system responses are compared to observed floodplain dynamics (levee and adaptation effects) in a qualitative way. This legitimizes the application of the model for answering the second research question. By changing several parameters and observing the model response, the role of individual decision making in flood-risk dynamics is explored in more detail.
The developed model does not attempt to be predictive but aims to explore flood-risk dynamics as an explanatory tool.
2 Methodology
presents a flowchart of the coupled ABMH modelling framework. At each time step, four main processes are implemented: urbanization, flood modelling, individual decision making and governmental decision making. Urbanization is taking place in the floodplain, over the analysed simulation window, regardless of the occurrence of a levee breach and consequent flooding. The flood modelling process estimates for each annual time step whether the current water level is higher than the levee height. If so, the levee breaches due to overtopping and flooding of the area is evaluated by means of the 2D hydraulic model LISFLOOD-FP (Bates et al. Citation2013); maximum water levels in the flooded cells are used to assess flood damage. Based on flood damage, agents in the ABM model take decisions whether to intervene or not. Structural measures are put in place if it is decided to intervene and a new urbanization process starts.
Figure 1. Flowchart of the coupled ABMH modelling framework.
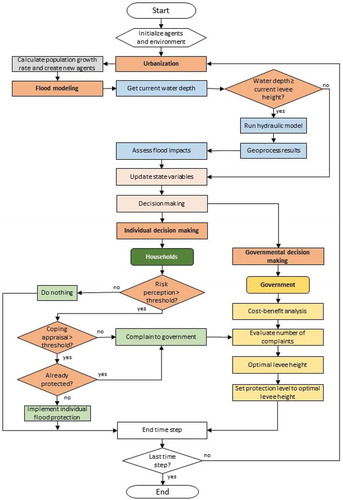
Two types of agents are simulated: individual households and a government. Individual behaviour is based on PMT, while the governmental decision regarding the implementation of technical community-level flood protection is a compromise between a cost–benefit analysis (CBA) and the total number of filed complaints from the households.
The ABM model design follows the overview, design concepts, details (ODD) protocol proposed by Grimm et al. (Citation2006, Citation2010), but a full description in line with the protocol would exceed the scope of this paper. The ABM is implemented in Repast,Footnote1 originally designed at the University of Chicago’s Social Science Research Department, and further developed in over 18 years (North et al. Citation2007).
Details on each of the four framework processes are presented below.
2.1 Urbanization
The first step of the proposed approach is the urbanization of the floodplain area: settlement of agents (households) that move in pre-defined urban areas within the floodplain. The urban growth rate is estimated as a function of average risk perception of the existing household agents, according to EquationEquation (1)(1)
(1) . At low average risk perception, more people are attracted to move into the floodplain and more agents are generated, while high risk perceptions of existing households discourage new citizens to move into the floodplain area. This approach was also previously applied in a socio-hydrological system dynamics model (e.g. Barendrecht et al. Citation2019).
where r(P) is the population growth rate as a function of risk perception P; rmax is the maximum population growth rate; and rmin is the minimum population growth rate. Maximum and minimum population growth rate are input parameters that can be used to tune the model.
If new households are moving in, new agents are assigned to the next closest free house from the urban centre, which is defined prior to the simulation. Households are further assumed to stay at that particular location for the entire remaining simulation time, which is based on the assumption that citizens are not willing to move away from floodplain areas even after a flood event (Baan and Klijn Citation2004, Thieken et al. Citation2007).
2.2 Flood modelling
Flooding can occur when maximum annual river discharge generates water levels that exceed the height of the levee system protecting the floodplain area. If the water level in any time step is equal to or higher than the current levee height, flood modelling is executed. Flood modelling comprises four steps: hydraulic modelling, geoprocessing of model results, assessment of flood impacts and update of state variables.
2.2.1 Hydraulic modelling
The two-dimensional hydraulic model LISFLOOD-FP (version 5.9.5) developed by the University of Bristol, UK (Bates et al. Citation2013) is used to represent flood wave propagation in the floodplain. LISFLOOD-FP uses a storage cell concept applied over a raster grid (Bates et al. Citation2013), which is simpler and requires less computational and development costs than other hydraulic models based on finite differences and element approaches (Horritt and Bates Citation2001b). Results of the raster-based model have been shown to provide similar results to finite difference discretization of diffusive wave propagation (Horritt and Bates Citation2001a).
The main input into the LISFLOOD-FP model is the inflow to the floodplain generated due to levee breach caused by overtopping. Such inflow is numerically represented as the water source in a specific grid cell. The flow is directed towards the floodplain and occurs over the whole 90-m width of the grid cell. The maximum inflow is assumed to occur initially when the levee fails because failure is most likely at the peak of the flood wave. The maximum inflow into the floodplain is calculated with the broad-crest weir formula, as suggested by an experimental study carried out by Chu et al. (Citation2009), who found that inflow to an inundation area due to levee breach can be represented as a broad-crested weir flow. For simplicity, a linear hydrograph from the maximum annual inflow value to zero is adopted, assuming a duration of 40 h, regardless of the maximum inflow scenario (Mazzoleni et al. Citation2014). The value is based on findings by Maione. et al. (Citation2003) for the Po River, Italy.
A digital elevation model (DEM) of the floodplain area is the other major input into the LISFLOOD 2D hydraulic model. A 90-m DEM from the Shuttle Radar Topography Mission (SRTM) data was chosen in this study. Finding an appropriate resolution is a trade-off between model efficiency, accuracy and short simulation times. This is supported by the findings of Horritt and Bates (Citation2001b), who have shown that best performance of the raster-based floodplain model is reached at a resolution of 100 m, after which further refinement does not contribute to better results. The model domain was cropped in the raster DEM around a sufficiently large area to avoid any backwater effect generated by the water leaving the model domain.
Channel flow is not modelled: since agents are located in the floodplain (where flood damage occurs), the hydraulic modelling component of the ABMH focuses only on flood propagation in the floodplain. For this reason, no backwater effect from floodplain to river channel through the breach is considered. Such an assumption was ensured by integrating the levee into the raster file with a sufficient height so that no water flows back from the inflow point in the floodplain back into the riverbed.
2.2.2 Geoprocessing of model results
The relatively coarse grid size chosen for the DEM allows for high efficiency and short simulation times. However, using a 90-m DEM does not guarantee accuracy, especially in urban areas where many household agents may share the same grid cell. In this way, heterogeneity among agents is reduced and the main advantage of using the agent-based model – incorporating individuality – cannot be fully exploited. Horritt and Bates (Citation2001b) showed that model performance can be improved by projecting simulated water levels onto a DEM of higher resolution. Following this approach, the results obtained using the 90-m DEM in the flood model are projected onto a 30-m DEM.
Maximum water-level values calculated on the coarser resolution DEM are corrected with the difference in elevation between the 90- and 30-m raster datasets, which is here called zb (zb = zDEM30 – zDEM90), according to:
where wd is the final water depth; wdDEM90 is the predicted water depth calculated on the coarse resolution DEM; and zb is the difference in elevation of the raster datasets.
2.2.3 Assessment of flood impacts
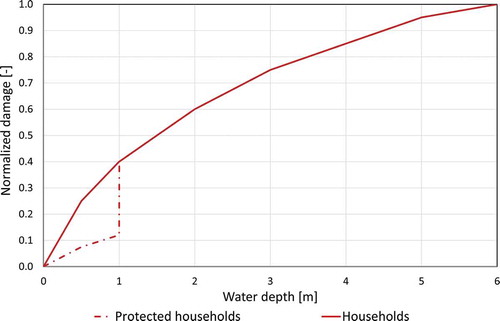
Water depth is often assumed to be the main factor contributing to flood damage (Merz et al. Citation2010), which has been confirmed by empirical findings (e.g. Thieken et al. Citation2007). In reality, other parameters, such as flow velocity, flood duration, water contamination, or time of occurrence, contribute to flood damage. Unfortunately, a comprehensive approach for including those factors in flood damage estimation is still lacking (Merz et al. Citation2010). However, as demonstrated by Kreibich et al. (Citation2009), water depth is one of the parameters with a strong influence on many types of flood damage (e.g. structural damage of residential buildings). For this reason, flood impact, at each household location, is calculated using the maximum water level during the latest flood event as input in depth–damage functions. These functions characterize the flood damage that would result from a certain water depth per asset or land-use class (Huizinga et al. Citation2017) and are commonly applied in quantitative flood-risk assessments (see, for example, Molinari et al. Citation2016, Jenkins et al. Citation2017, Haer et al. Citation2019). Huizinga et al. (Citation2017) developed a globally consistent database of depth–damage functions containing normalized depth–damage curves for each continent for several land-use types. The values range from zero (no damage) to one (maximum damage) and are scaled with a maximum damage value available on a national scale. For this study, the normalized curves for Europe for residential buildings were used (Household curve in ).
Figure 2. Depth–damage function for protected and non-protected households.
2.2.4 Update of state variables
The state of a household agent is defined by several static and dynamic variables. For example, the location and the elevation of an agent’s house are unique properties that determine flood damage. Also, flood awareness, perception of flood risk and perception of the possibilities to cope with that risk are intrinsic characteristics of an agent. These three attributes are mainly responsible for the household agent’s risk behaviour and are modelled in the state variables flood damage, risk perception and coping appraisal, respectively. More details about the background and meaning of these variables can be found in Section 2.3.
Flood damage is a measure of the agent’s experience with flooding and is given by the value of the depth–damage function introduced by Huizinga et al. (Citation2017), evaluated using the maximum water depth from the 2D hydraulic model at each yearly time step.
Risk perception captures how an individual perceives the probability and potential damage of a threatening event. According to empirical studies, risk awareness rises significantly after experiencing a threatening event (Kunreuther et al. Citation1985, Baan and Klijn Citation2004, Bubeck et al. Citation2012), especially if the experienced negative consequences were large (Scolobig et al. Citation2012). Yet, memory decays over time and risk awareness returns to an equilibrium similar to that before the event (Kunreuther et al. Citation1985, Bubeck et al. Citation2012, Collenteur et al. Citation2015). These dynamics are represented in the ABM by a sudden risk perception increase after flooding driven by experienced damage and a steady memory decay throughout all time steps. Risk perception is updated according to EquationEquation (3)(3)
(3) , which is based on the work of Anastasio et al. (Citation2012). The authors use insights from neuroscience, psychology, anthropology and history to investigate memory consolidation, i.e. the transformation of immediate information to stable long-term memories. Their findings suggest that the memory decreases rapidly immediately after an experience and reaches a more stable level after approximately 10 years. As this result is not explicitly linked to flood risk, the influence of the memory decay rate
was further investigated in the sensitivity analysis. A similar approach has previously been used by Di Baldassarre et al. (Citation2013).
where is the change in risk perception
over time;
a discontinuous function defined by EquationEquation (4)
(4)
(4) ;
is the shock due to flood experience equal to relative damage drel = d/dmax; and
a decay rate.
Coping appraisal describes how individuals perceive their own ability to cope with a threat. This state variable is not changed during the simulation but remains constant at an initially chosen value because it is assumed to be an inherent property of each agent that characterizes the individual household rather than a time-dependent variable.
2.3 Individual decision making
As a response to a flooding event due to levee breach, household agents can react in one of three ways:
Not react
Implement individual flood protection measures
File a complaint to the government about flood risk
Below, we provide a description of the individual decision-making framework implemented in the ABM.
2.3.1 Theoretical and empirical basis of decision making
Which of the three options a household decides to pursue is based on Protection Motivation Theory (PMT) introduced by Rogers (Citation1975, Citation1983). According to PMT, individuals undergo two appraisal processes: threat appraisal (also referred to as “risk perception”, see Grothmann and Reusswig Citation2006), and coping appraisal (Rogers Citation1983). The first describes how people appraise the severity and likelihood of a threatening event, in this case, flooding, while the second describes how they evaluate their own ability to cope with it (Rogers Citation1975, Citation1983). People undergo these two cognitive processes consecutively and alter their decision-making attitudes accordingly.
Empirical studies focused on identifying factors contributing to the implementation of individual flood protection measures by households in flood-prone areas substantiate this theory. A common finding is that flood experience is a main driver for high risk awareness (Thieken et al. Citation2007, Bubeck et al. Citation2012, Scolobig et al. Citation2012). However, this does not necessarily result in precautionary actions (Scolobig et al. Citation2012, Bubeck et al. Citation2013). Some studies have found evidence that coping appraisal can explain significant parts of the variance in protective behaviour (Grothmann and Reusswig Citation2006, Bubeck et al. Citation2013). Non-protective responses to high risk perceptions, such as denial, wishful thinking or fatalism, have been observed when coping appraisals are low (Grothmann and Reusswig Citation2006). Socio-economic factors, such as age, gender or income, on the other hand, have been shown to be rather insignificant contributors for measure implementation (Thieken et al. Citation2007, Bubeck et al. Citation2012, Citation2013).
2.3.2 Implementation in the ABMH
In the context of ABM, Haer et al. (Citation2016) adopted PMT to assess the effectiveness of different flood-risk communication strategies. In our study, PMT is used in the ABM to represent household behaviour incorporating risk perception and coping appraisal. As a first cognitive process, a household agent considers its risk perception. If risk perception is below the individual risk perception threshold, the household does not take any action with regard to flood risk (see ).
In a second cognitive process, if risk perception is high, the individual will evaluate its own ability to protect itself from the flood hazard. If also coping appraisal is high (above the individual coping appraisal threshold), the agent will implement individual flood protection (see ).
Following the example of Haer et al. (Citation2017), in this study individual loss-reducing measures taken by households are water barriers that can lower flood damage by 70%, up to a water depth of 1 m (Kreibich et al. Citation2011) (see ). At higher water depths, these barriers are overtopped and normal damage occurs (Kreibich et al. Citation2011). The risk perception of household agents is assumed to decrease by 50% after implementation of individual flood protection measures. The influence of individual protection measure implementation on risk perception has been discussed hypothetically (Siegrist Citation2013) but has not yet been tested empirically (Begg et al. Citation2017). Although a decrease in risk perception after protection measure implementation has been observed qualitatively by Bubeck et al. (Citation2013), a quantitative value is not available in the literature.
Finally, if an agent´s risk perception is high but coping appraisal is below the individual coping appraisal threshold, reliance on public flood protection has been found to be negatively correlated to individual protective behaviour (Grothmann and Reusswig Citation2006) and complaining to the government to implement flood protection measures is considered a non-protective response to high flood awareness. In addition, also individuals with high risk perception and coping appraisal that have already implemented measures will complain to the government (see ). The number of complaints filed by households is taken into account when the government decides on heightening the existing levee.
2.4 Governmental decision making
The government agent decides whether to react to a flood event by implementing structural measures, i.e. heightening of the existing levee system to protect its community (the household agents). As mentioned by Baan and Klijn (Citation2004), the perspective of governments and experts on flood risk is different than that of the public. In fact, while citizens perceive risk in a more subjective and emotional way (the cultural rationale), authorities have a more technical view (technical rationale). Following this general concept, in our ABMH framework, the government agent uses CBA, a common tool from economics, for assessing the optimal levee height at each time step. However, since governments are dependent on community support and can thus be influenced by the opinion of citizens, complaints filed from household agents affected by flooding are taken into account in the decision-making process.
With the CBA (see EquationEquation (5)(5)
(5) ), the government seeks to minimize total costs (TC), that arise through expected annual flood damage (EAD) and annual construction costs (ACC). This approach is similar to the CBA implemented in Hui et al. (Citation2016), who used game theory to assess optimal risk-based levee designs.
The ACC is calculated according to:
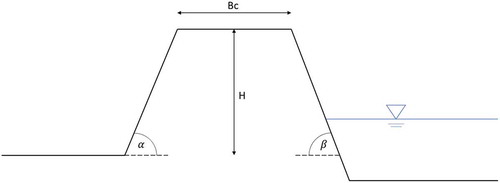
where cadm is an administrative cost multiplier; c is soil the material cost; V is the volume of the required dam material; r is an interest rate; and k is the considered time horizon in years. With a geometry depicted as in over a length L, height H, crest width Bc, land-side slope α and river-side slope β, the volume of the levee is given by:
Figure 3. Schematization of the levee geometry.
The expected annual damage (EAD) is generally calculated as the integral of the critical discharge to infinity over the product of damage caused by a certain flood intensity D(Q) times the probability distribution of flood discharge
, as shown in EquationEquation (8)
(8)
(8) . However, information about the actual probability density function
is not available to the government.
For this reason, instead of using EquationEquation (8)(8)
(8) for calculating expected annual damage, the government agent uses the empirical probability Pemp that can be calculated from experienced flood events. Empirical probability is the relative frequency of occurrences of an event and is given by f, the number of occurrences of that event, divided by k, the number of years considered, i.e. Pemp = f/k. The “empirical” EAD is calculated as the product of the average damage due to a certain flood event and empirical probability of that event summed up over all flood events that would lead to levee failure at a certain levee height (see EquationEquation (9)
(9)
(9) ):
The result of the CBA is an optimal levee height for which the total costs are minimal. Yet, the government does not directly implement this protection level, but first evaluates the public opinion. If less than 20% of household agents complain to the government asking for structural intervention, this optimal levee height (result of the CBA) is decreased by 0.5 m. This means that either the levee is not heightened, although this would be economically optimal, or the levee height increase is less than economically optimal. In contrast, if more than 80% of the agents complain, the optimal levee height is increased by 0.5 m. In the range between 20% and 80% of household complaining, the levee is set equal to the optimal value estimated by the CBA. Finally, the updated protection level is put into practice.
2.5 Assumptions and uncertainties
Using an ABM for flood risk assessment implies making assumptions regarding hydraulic modelling as well as behavioural rules and thresholds for individual and governmental decisions. Uncertainties arise from standard hydraulic modelling techniques (e.g. the assumption of a homogeneous roughness coefficient for the whole floodplain and the idealized inflow hydrograph) and the chosen risk modelling approach. For example, we considered only overtopping as a main cause of levee failure, while in reality, the levee system may be subject to other failure modes as piping (Mazzoleni et al. Citation2015). By using depth–damage functions to estimate flood damage we disregard the influence of other parameters like flow velocity, flood duration, water contamination or time of occurrence (Merz et al. Citation2010). Economic uncertainties arise not only in the evaluation of flood damage for households but also in the CBA (e.g. considering constant administrative and material costs, disregarding market fluctuations and long-term trends). Moreover, modelling human decision making requires a high number of assumptions. Agent decisions are based on existing theoretical and empirical studies (not calibrated and validated due to a lack of data), thus decision rules might be subject to false assumptions or bias threatening the external validity of the model.
3 Application
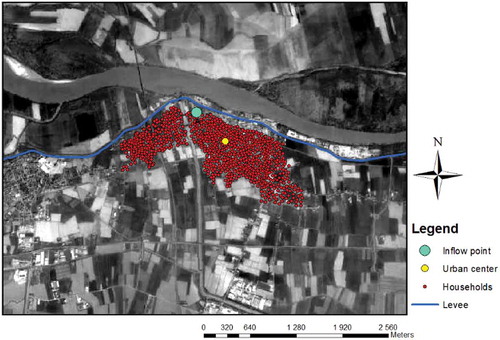
The general ABMH modelling framework was then applied to a synthetic case study in order to investigate the dynamic interactions in the complex human-flood system. Hydrological, topographical and demographical data were based on a stretch of the Po River, in northern Italy. More specifically, raster data of the right floodplain around the city of Boretto were used. A map of the case study set-up is provided in , including 1000 possible household locations, the urban centre and inflow point in case of levee breach. The case study does not try to replicate reality but explores different scenarios of structural flood protection development and urbanization in Boretto. In fact, as this work considers a synthetic case study, all administrative and material costs are chosen arbitrarily.
Figure 4. Map of the synthetic case study set-up with the location of the inflow point, levee system, urban centre and households.
Moreover, a time series of 50 years of synthetic annual maximum water-level scenarios was generated and used as model input to provide different scenarios of a set of randomly ordered flood events of different intensity. The time series in water levels is given in ) (blue bars). The number of occurrences of a certain flood event decreases with increasing intensity.
Figure 5. Results of example run with base scenario parameters.
Initial conditions are a levee height of 3 m, which can be raised by 0.5-m intervals to 6 m. In the hydraulic model, dry conditions are assumed prior to every flood simulation. The homogeneous value of the Manning coefficient equal to 0.09 (Mazzoleni et al. Citation2014) was assigned to all grid cells of the model domain.
Important parameters of the coupled ABMH modelling framework are summarized in .
Table 1. Relevant model parameters.
A benchmark scenario (, bold font) was simulated to compare the influence of stochasticity and seven model parameters (, normal font).
4 Results and discussion
4.1 Capturing emerging patterns between floods and society
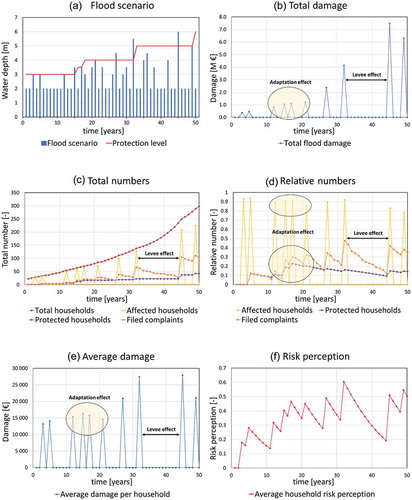
The results of this study show that changes of community and individual vulnerability over time affect community flood risk: the coupled ABMH modelling framework captures commonly observed flood dynamics, namely levee and adaptation effect (Di Baldassarre et al. Citation2013). These patterns emerge from individual and governmental decision making about flood protection measure implementation. Flood experience and damage – caused by levee breaches due to overtopping – are the main drivers of these decisions. Results from one example model run are summarized in six panels in , for the benchmark scenario (see ). ) shows the hydrograph of the input flood scenario together with the corresponding protection level resulting after each simulation; the total damage of each flood event is reported in ); ) includes the total number of households, the number of flood affected households, the number of households who implemented individual protection measures and the number of complaints filed from households to the government; ) plots the same values in relative terms, with respect to the total number of households; ) shows the average damage per house; and ) reports the average household risk perception.
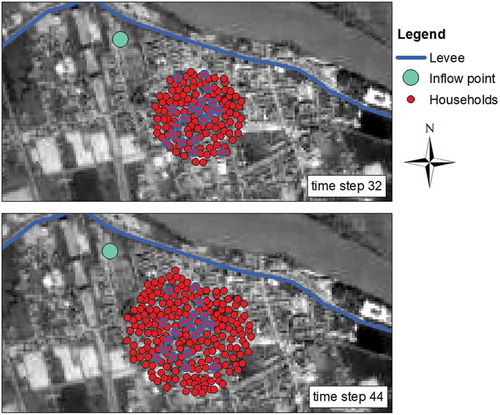
The levee effect can be witnessed between the two flood events in years 32 and 45 (). A levee of 5 m height prevents flooding for 13 years. During these years, flood-risk perception decreases from an average of 0.6 to below 0.2, as shown in ), and population growth accelerates leading to an 80% increase in population from 138 households in time step 32 to 250 households in time step 45 ((c)). The relative number of protected households decreases from 16% to 9%, because new agents have not experienced flooding and do not consider investments in flood protection () and (d)). shows the population in time steps 32 and 44, after the latest and before the new flood. It can be observed that none of the new households is protected. As a consequence, the total damage of 7.5 M € during the flood in time step 45 is by 80% higher than the damage of the most severe flood event before (4.1 M € in time step 32) ()). Yet, it must be noted, that this difference can partly also be explained by the higher intensity of the second flood.
Figure 6. Agent locations in time steps 32 and 44. Protected households are marked by a thicker (blue) outline.
The adaptation effect can be observed between time steps 12 and 21, where four flood events of low intensity occur shortly after each other. Reoccurring floods in time steps 12, 15 and 17 cause flood damage, and as a result, risk perception rises ()). Individuals are now more aware and respond with implementing more individual protection measures () and (d)). Between time steps 12, 15 and 17 the percentage of protected households rises from 15% to 23%. The percentage of affected households decreases from 91% in time step 17 to 86% in time step 21. Average damage per household (HH) decreases from 16 300 €/HH in time step 15 to 15 700 €/HH in time step 17 where both events are of the same flood intensity and decreases further to 14 500 €/HH in time step 21, even though flood intensity has increased. This shows that learning from flood experience has the potential to decrease future flood damage. However, since the total number of households continuously rises, a reduction of total damage cannot be observed. Also, it needs to be noted that the average damage per household highly depends on their locations and can vary between time steps independently of the proportion of implemented measures. The smaller the sample size, the more sensitive is the value to outliers like new agents settling into a highly affected area. Similarly, the efficiency of individual measures is highly location specific, because the implemented mobile flood barriers are only effective up to a water depth of 1 m. Thus, if households in areas with lower elevation employ those measures, and the water level overtops the barriers, the damage is the same as if they had not implemented any measures. During the example run, 33% and 28% of the individual flood protection measures were overtopped in time steps 15 and 17, respectively, although the households experienced the same flood intensity. Likewise, the higher the flood intensity, the lower is the adaptation effect, because average water levels are significantly higher and flood barriers become ineffective. In the high-intensity events in time steps 32, 45 and 49, more than half of the implemented measures were overtopped (59%, 65% and 50%, respectively).
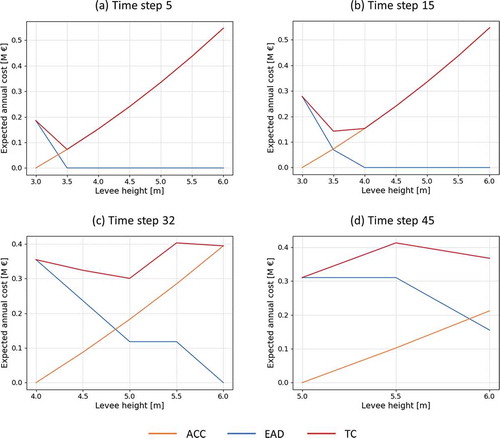
Finally, more details about the governmental decision process for levee heightening can be highlighted. shows the CBA performed at time steps 5, 15, 32 and 45. Flooding occurs in all of these time steps; however, the decision to reinforce the levee is taken only at time steps 15 (increase by 0.5 m) and 45 (increase by 1 m) as a consequence of different decision-making processes. ) indicates minimum costs at a levee height of 3.5 m after the flood in time step 15 and ) indicates minimum costs at a levee height of 5 m after the flood in time step 32. In both cases, this optimal levee height is subsequently put into practice. The decision to reinforce the levee system is always based on the optimal levee height from an economic perspective rather than filed complaints from households. From ), it becomes apparent that, for this specific run, the number of household complaints never exceeds the threshold of 80% necessary to trigger government action. On the other hand, households do inhibit an early levee heightening. As the percentage of households complaining is below 20% until time step 15, the levee height is not increased despite the economic considerations. ) shows the CBA in time step 5 as an example. Two flood events of 3 m water depth each have already occurred, and the CBA shows that the total cost is minimal for a levee height of 3.5 m. Nevertheless, the levee height is ultimately not increased due to the relatively low complaint rate of 12% (see )), indicating no public interest in technical flood protection measures. For completeness, ) shows time step 45 as an example where increasing the levee height is economically not beneficial. With a complaint rate of 42%, the citizens don’t show increased interest, and the levee system remains at the current height of 5 m.
Figure 7. Cost–benefit analyses at four specific time steps during the simulation window. EAD: the expected annual flood damage, ACC: the annual construction cost, and TC: the total cost.
4.2 Results of the sensitivity analysis
The coupled ABMH modelling framework was further exposed to a sensitivity analysis to better understand the role of individual decision making as well as to test the model for stability and find sensitive parameters. The results are summarized in and visualized in and .
Table 2. Results of sensitivity analysis and relative contribution of model parameters.
Figure 8. Changes in mean and standard deviation for an increasing number of runs.
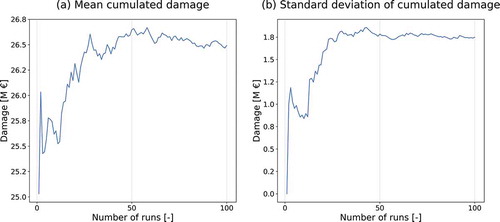
Figure 9. Comparison of the influence of different parameters. Values applied for parameter changes are listed in .
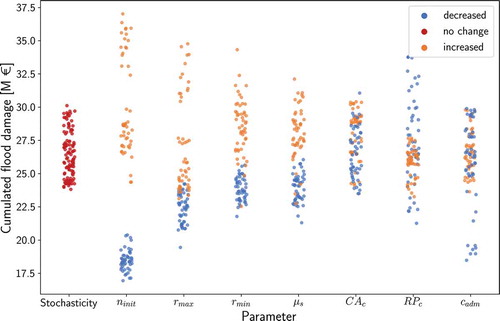
At first, the influence of stochasticity on model outcome was tested by executing 100 model runs with a benchmark setting of parameters (, bold print). Three household parameters in the ABMH are subject to stochasticity: the state variable coping appraisal; the individual risk perception threshold; the individual coping appraisal threshold. All of these parameters are assigned when a household agent is created and they do not change during the simulation. In particular, coping appraisal is set by a random number generator to a value between 0 and 1. Threshold values are used to distinguish between high and low coping appraisal and risk perception. These thresholds determine the likelihood of a household to take a certain decision in each of the two consecutive cognitive processes recognized by PMT. For example, at a coping appraisal threshold of 0.7, a household agent with high risk perception has a 30% chance to implement individual flood protection and a 70% chance to complain to the government. In the stochasticity analysis, the threshold is set as a model input and then further multiplied with a random number between 0.9 and 1.1 to account for heterogeneity among individuals.
Then, the sensitivity analysis was performed and seven model parameters were changed to assess their influence on the estimation of the total cumulative flood damage. summarizes the parameter values that were modified separately, holding all other values constant at the benchmark scenario settings (bold font in ). Changes in mean and standard deviation of cumulated flood damage values were monitored over an increasing number of runs with benchmark settings in the first part of the sensitivity analysis (). Both values tend to a stable plateau after approximately 50 model runs. A number of 50 runs per parameter variation were chosen as a good compromise between computational cost and accuracy.
From it can be observed how stochasticity and the seven model parameters can significantly influence flood damage. The average cumulated damage based on the first 100 model runs with base scenario settings is 26.5 M € with a standard deviation of 1.76 M €. Cumulated flood damage varies between 30.1 M € and 23.8 M €. As randomness mainly influences individual decision making (individual coping appraisal and parameters RPc and CAc), this already indicates the importance of individuals for flood-risk development. In it can also be observed that except for the coping appraisal threshold a variation of parameters induces changes larger than the variability due to randomness.
Three parameters are connected to population size and growth: the initial number of households , the maximum population growth rate
and the minimum population growth rate
. These parameters are responsible for the largest changes in the average cumulative total flood damage values (see ). This can be explained with the way total flood damage is calculated: as the sum of damage to individual households. Thus, the population size directly determines total flood damage. Furthermore, there exists a positive feedback effect between low risk perceptions and high population growth. A larger community experiences larger damages which gives an incentive to the government to raise levees. The presence of higher levees induces a decrease in risk perception and, as population growth is a function of risk perception, an acceleration in the urbanization of the floodplain. Additionally, the new household agents that move into the floodplain have a null risk perception, as they did not experience any flooding yet. Hence, higher growth rates contribute to even lower risk perceptions that, in turn, cause faster population growth. This high sensitivity leads to a risk of unrealistically high population growth in periods where no flooding occurs. Higher values of
,
and
also increase the standard deviation of model outcomes significantly due to severe flood events after periods with overestimated population growth. This shows how critical model parameter selection is and suggests that for applications of the ABHM to a real case study,
should be based on data and either a sensitivity analysis or, where data are available, a proper calibration and validation process should be conducted for
and
.
Parameters influencing individual decision making are the memory decay rate , the coping appraisal threshold
, and the risk perception threshold
. As one might expect, a larger memory decay rate leads to increased damage. The main reason for this is that population growth accelerates when flood risk fades away in the collective memory. In fact, the influence of
and
is very similar (). Increased average damage can also be observed for a lower risk perception threshold
(+3.5% for
= 0.3). The main influence of
is, however, not a change in average but a change in the standard deviation of model outcomes. While households homogenously tend to do nothing if risk perception is perceived as low (increased threshold), a lower risk perception threshold can be responsible for more individual action, enhancing the influence of heterogeneity among agents. Here, a decreased risk perception threshold leads to a larger variety of outcomes and increases standard deviation by 88% (). Changes in coping appraisal threshold
are within the range of random variations which indicates limited influence of the parameter. That average cumulated damage does not change when the parameter is decreased, supports this finding. Yet, it can be observed that average cumulated flood damage increases by 5.9% at a higher coping appraisal threshold (
= 0.9).
Finally, the administrative cost multiplier represents the influence of levee construction costs. This parameter causes only very small changes in average cumulated damage (–2.8% for a value decrease and +0.6% for a value increase, see ). However, it is interesting that in several model runs a decreased value of
leads to significantly lower damage (). This is because in these cases the government heightened the levee in time step 45 so that the flood in 49 would not hit the community. As this flood event occurs last it mostly has catastrophic effects and avoiding it can decrease total damage significantly. This demonstrates the potential benefit of large engineering flood protection measures. Considering the growing population, however, the risk is not equally low as damage.
In summary, the model is very sensitive to parameters connected to population size and growth, because flood damage is calculated as the sum of damage to individual agents and due to a positive feedback effect between low risk perceptions and increased urbanization (see , parameters ,
and
). Also, parameters connected to individual decision making have the potential to significantly alter model outcomes (see , stochasticity as well as parameters
and
). We demonstrated that different individual flood protection strategies (implementing flood barriers or setting trust in large-scale technical flood protection) have a large influence on flood-risk dynamics. In the model, the impact of stochasticity is large. This shows that heterogeneities between individuals are important for flood-risk development. More knowledge about the motivation of people to invest in individual flood protection measures is needed for a better estimation of the efficiency of different flood management strategies. Our coupled ABMH modelling framework can be a helpful tool for quantifying the uncertainties resulting from individual decision making and exploring different future scenarios.
5 Conclusions
In this study, a new flood-risk simulation approach was developed coupling agent-based with hydraulic modelling. The agent-based model was specifically designed to account for both household decision-making processes on implementing individual flood protection measures (flood barriers) and the governmental decision-making process on reinforcing a levee system to protect the households living in the floodplain area. The ABM was coupled with the LISFLOOD-FP 2D hydraulic model used to estimate flood extent in the urbanized floodplain area every time that the water level in the river exceeds the levee height and a breach occurs due to overtopping. The proposed method was then applied to a synthetic case study built on topographical and hydrological data collected in the city of Boretto, in the floodplain of the Po River in Italy.
Our study demonstrated that the coupled ABMH model was capable of capturing floodplain dynamics commonly observed in the literature when structural flood protection measures are implemented, either at household or community level. More specifically, levee and adaptation effects were observed to emerge from changes in community and individual vulnerability. These have prior been modelled with system dynamics (Di Baldassarre et al. Citation2013, Citation2015) and, partly, with an agent-based approach on a continental scale (Haer et al. Citation2019). The advantage of using an ABM is that the role of each individual household in the floodplain is incorporated in the analysis and flood risk is simulated not only over time but also spatially explicit.
We then tested the influence of several parameters on the decision-making process and changes in vulnerability over time. First, the effect of stochasticity was assessed with a fixed set of values; then, one parameter at a time was modified. We found that the model is very sensitive to parameters connected to individual decision making, population size and growth. Moreover, we showed that different individual flood protection strategies have a large influence on flood-risk dynamics. It becomes evident that individual decision making plays a vital role in flood-risk development.
Despite the high number of assumptions, the model does provide a useful explanatory tool for assessing the spatial and temporal dynamics in a socio-hydrological system, which is in line with the initial intention of developing an explanatory rather than predictive model.
The proposed coupled ABMH modelling framework can be applied to analyse different agents and human-flood dynamics, such as the levee war previously explored by Hui et al. (Citation2016) using a game theoretical approach; the harmful effects of upstream flood protection measures to downstream communities, as described through a pure hydraulic model approach in Di Baldassarre et al. (Citation2009) or to explore the effect of climate variability on the observed flood dynamics. Also, the next step will be integrating an economic component to the ABMH, which will allow also investigating the effects of governmental decision making on different shares of the population.
The application of a coupled agent-based and hydraulic model to many of these cases could provide useful insights into spatio-temporal flood-risk patterns and help in solving water conflicts considering different flood management strategies for future flood scenarios.
Disclosure statement
No potential conflict of interest was reported by the authors.
Additional information
Funding
Notes
References
- Abebe, Y.A., et al., 2018. A coupled flood-agent-institution modelling (CLAIM) framework for urban flood risk management. Environmental Modelling and Software, 1 (10), 109317.
- Abebe, Y.A., et al., 2019. Flood risk management in Sint Maarten – a coupled agent-based and flood modelling method. Journal of Environmental Management, 248, 109317. doi:10.1016/j.jenvman.2019.109317
- Aerts, J.C.J.H., et al., 2018. Integrating human behavior dynamics into flood disaster risk assessment. Nature Climate Change, 8 (2), 193–199. doi:10.1038/s41558-018-0085-1
- An, L., 2012. Modelling human decisions in coupled human and natural systems: review of agent-based models. Ecological Modelling, 229 (3), 25–36. doi:10.1016/j.ecolmodel.2011.07.010
- Anastasio, T.J., et al., 2012. Individual and collective memory consolidation – analogous processes on different levels. Camebridge, MA: MIT Press.
- Baan, P.J.A. and Klijn, F., 2004. Flood risk perception and implications for flood risk management in the Netherlands. International Journal of River Basin Management, 2, 113–122. doi:10.1080/15715124.2004.9635226
- Barendrecht, M.H., et al., 2019. The value of empirical data for estimating the parameters of a socio-hydrological flood risk model. Water Resources Research, 55, 1312–1336. doi:10.1029/2018WR024128.
- Bar-Yam, Y., 1997. Dynamics of complex systems. Reading(Massachusetts): Addison-Wesley.
- Bates, P., et al., 2013. Lisflood-FP. User manual. School of Geographical Sciences, University of Bristol. Bristol, UK.
- Begg, C., et al., 2017. Interactions between citizen responsibilization, flood experience and household resilience: insights from the 2013 flood in Germany. International Journal of Water Resources Development, 33 (4), 591–608. doi:10.1080/07900627.2016.1200961
- Brody, S.D., Kang, J.E., and Bernhardt, S., 2009. Identifying factors influencing flood mitigation at the local level in Texas and Florida: the role of organizational capacity. Natural Hazards, 52 (2), 167–184. doi:10.1007/s11069-009-9364-5
- Bubeck, P., et al., 2013. Detailed insights into the influence of flood-coping appraisals on mitigation behavior. Global Environmental Change, 23, 1327–1338. doi:10.1016/j.gloenvcha.2013.05.009
- Bubeck, P., Botzen, W.J.W., and Aerts, J.C.J.H., 2012. A review of risk perceptions and other factors that influence flood mitigation behavior. Risk Analysis, 32 (3), 1481–1495. doi:10.1111/j.1539-6924.2011.01783.x
- Chu, H.J., Yoon, K.S., and Lee, J.K., 2009. Estimation of inflow to inundation area due to levee breach. In: Advances in Water Resources and Hydraulic Engineering. Berlin: Springer, 1022–1025.
- Ciullo, A., et al., 2017. Socio-hydrological modelling of flood-risk dynamics: comparing the resilience of green and technological systems. Hydrological Sciences Journal, 62 (1), 880–891. doi:10.1080/02626667.2016.1273527
- Collenteur, R.A., et al., 2015. The failed-levee effect: do societies learn from flood disasters? Natural Hazards, 76 (1 3), 373–388. doi:10.1007/s11069-014-1496-6
- CRED and UNISDR (Centre for Research on the Epidemiology of Disasters and UN Office for Disaster Risk Reduction), 2015. The human cost of weather-related disasters 1995–2015. Available from: https://www.unisdr.org/2015/docs/climatechange/COP21_WeatherDisastersReport_2015_FINAL.pdf [Accessed 30 March 2020].
- Crooks, A., Heppenstall, A., and Malleson, N., 2018. Agent-based modelling. In: Bo Huang, ed. Comprehensive geographic information systems. s.l.: Elsevier, 218–243.
- Di Baldassarre, G., et al., 2013. Socio-hydrology: conceptualising human-flood interactions. Hydrology and Earth System Sciences, 17 (8), 3295–3303. doi:10.5194/hess-17-3295-2013
- Di Baldassarre, G., et al., 2015. Debates-Perspectives on socio-hydrology: capturing feedbacks between physical and social processes. Water Resources Research, 51 (6), 4770–4781. doi:10.1002/2014WR016416
- Di Baldassarre, G., Brath, A., and Castellarin, A., 2009. Analysis of the effects of levee heightening on flood propagation: example of the River Po, Italy. Hydrological Sciences Journal, 54 (12), 1007–1017. doi:10.1623/hysj.54.6.1007
- Dottori, F., et al., 2016. Development and evaluation of a framework for global flood hazard mapping. Advances in Water Resources, 94, 87–102. doi:10.1016/j.advwatres.2016.05.002
- Dow, K. and Cutter, S.L., 1998. Crying wolf: repeat responses to hurricane evacuation orders. Coastal Management, 26 (1), 237–252. doi:10.1080/08920759809362356
- Dubbelboer, J., et al., 2017. An agent-based model of flood risk and insurance. Journal of Artificial Societies and Social Simulation, 20(1), 6. doi:10.18564/jasss.3135.
- EC (European Commission), 2007. The EU Floods Directive. Directive 2007/60/EC of the European Parliament and of the Council on the assessment and management of flood risk. https://ec.europa.eu/environment/water/flood_risk/ [Accessed 20 April 2020].
- Egli, T., 2002. Non structural flood plain management. 2nd ed. Koblenz, Germany: International Commission for the Protection of the Rhine.
- Ferdous, M.R., et al., 2019a. The levee effect along the Jamuna River in Bangladesh. Water International, 44 (5), 496–519. doi:10.1080/02508060.2019.1619048
- Ferdous, M.R., et al., 2019b. The costs of living with floods in the Jamuna Floodplain in Bangladesh. Water, 11, 1238. doi:10.3390/w11061238
- Filatova, T., 2015. Empirical agent-based land market: integrating adaptive economic behavior in urban land-use models. Computers, Environment and Urban Systems, 54 (11), 397–413. doi:10.1016/j.compenvurbsys.2014.06.007
- Gergel, S.E., Dixon, M.D., and Turner, M.G., 2002. Consequences of human-altered floods: levees, floods, and floodplain forests along the Wisconsin River. Ecological Applications, 12 (6), 1755–1770. doi:10.1890/1051-0761(2002)012[1755:COHAFL]2.0.CO;2
- Grimm, V., et al., 2006. A standard protocol for describing individual-based and agent-based models. Ecological Modelling, 198 (9), 115–126. doi:10.1016/j.ecolmodel.2006.04.023
- Grimm, V., et al., 2010. The ODD protocol: A review and first update. Ecological Modelling, 221 (11), 2760–2768. doi:10.1016/j.ecolmodel.2010.08.019
- Grothmann, T. and Reusswig, F., 2006. People at risk of flooding: why some residents take precautionary action while others do not. Natural Hazards, 38, 101–120. doi:10.1007/s11069-005-8604-6
- Haer, T., et al., 2017. Integrating household risk mitigation behavior in flood risk analysis: an agent-based model approach. Risk Analysis, 37 (11), 1977–1992. doi:10.1111/risa.12740
- Haer, T., et al., 2019. The safe development paradox: an agent-based model for flood risk under climate change in the European Union. Global Environmental Change, 60, 102009.
- Haer, T., Botzen, W.J.W., and Aerts, J.C.J.H., 2016. The effectiveness of flood risk communication strategies and the influence of social networks: insights from an agent-based model. Environmental Science and Policy, 60 (6), 44–52. doi:10.1016/j.envsci.2016.03.006
- Horritt, M.S. and Bates, P.D., 2001a. Predicting floodplain inundation: raster‐based modelling versus the finite‐element approach. Hydrological Processes, 15, 825–842. doi:10.1002/hyp.188
- Horritt, M.S. and Bates, P.D., 2001b. Effects of spatial resolution on a raster based model of flood flow. Journal of Hydrology, 253, 239–249. doi:10.1016/S0022-1694(01)00490-5
- Hui, R., Lund, J.R., and Madani, K., 2016. Game theory and risk‐based leveed river system planning with noncooperation. Water Resources Research, 52, 119–134. doi:10.1002/2015WR017707
- Huizinga, J., Moel, H., and Szewczyk, W., 2017. Global flood depth-damage functions: methodology and the database with guidelines. JRC technical reports. Publications Office of the European Union. doi:10.2760/16510
- Husby, T., et al., 2014. Do floods have permanent effects? evidence from the Netherlands. Journal of Regional Science, 54 (3), 355-377. doi:10.1111/jors.12112
- IPCC (Intergovernmental Panel on Climate Change), 2012. Managing the risks of extreme events and disasters to advance climate change adaptation. Cambridge, UK, and New York, NY, USA: Cambridge University Press.
- Jenkins, K., et al., 2017. Assessing surface water flood risk and management strategies under future climate change: insights from an agent-based model. Science of the Total Environment, 595, 159–168. doi:10.1016/j.scitotenv.2017.03.242
- Kreibich, H., et al., 2009. Is flow velocity a significant parameter in flood damage modelling? Natural Hazards and Earth System Science, 9, 1679–1692. doi:10.5194/nhess-9-1679-2009
- Kreibich, H., Christenberger, S., and Schwarze, R., 2011. Economic motivation of households to undertake private precautionary measures against floods. Natural Hazards and Earth System Sciences, 309–321.
- Kron, W., 2005. Flood risk = hazard • values • vulnerability. Water International, 30, 58–68. doi:10.1080/02508060508691837
- Kunreuther, H., Sanderson, W., and Vetschera, R., 1985. A behavioral model of the adoption of protective activities. Journal of Economic Behavior and Organization, 6, 1–15. doi:10.1016/0167-2681(85)90022-8
- Maione., U., Mignosa, P., and Tomirotti, M., 2003. Regional estimation of synthetic design hydrographs. International Journal of River Basin Management, 1 (2), 151–163. doi:10.1080/15715124.2003.9635202
- Mazzoleni, M., et al., 2014. flooding hazard mapping in floodplain areas affected by piping breaches in the Po River, Italy. Journal of Hydrologic Engineering, 19, 717–731. doi:10.1061/(ASCE)HE.1943-5584.0000840
- Mazzoleni, M., et al., 2015. Innovative probabilistic methodology for evaluating the reliability of discrete levee reaches owing to piping. Journal of Hydrologic Engineering, 20 (5), 04014067. doi:10.1061/(ASCE)HE.1943-5584.0001055
- Merz, B., et al., 2010. Review article ‘Assessment of economic flood damage’. Natural Hazards and Earth System Science, 10 (8), 1697–1724. doi:10.5194/nhess-10-1697-2010
- Molinari, D., et al., 2016. Implementing the European ’Floods directive’: the case of the Po River Basin. Water Resources Management, 30 (5), 1739–1756. doi:10.1007/s11269-016-1248-3
- Muis, S., et al., 2015. Flood risk and adaptation strategies under climate change and urban expansion: A probabilistic analysis using global data. Science of the Total Environment, 538, 445–457. doi:10.1016/j.scitotenv.2015.08.068
- North, M.J., et al., 2007. A declarative model assembly infrastructure for veri cation and validation. In: Takahashi S., Sallach D., Rouchier J. eds. Advancing Social Simulation: The First World Congress. Tokyo: Springer Japan.
- Pappenberger, F., et al., 2012. Deriving global flood hazard maps of fluvial floods through a physical model cascade. Hydrology and Earth System Sciences, 16 (11), 4143–4156. doi:10.5194/hess-16-4143-2012
- Pinter, N., et al., 2016. Modelling residual flood risk behind levees, Upper Mississippi River, USA. Environmental Science and Policy, 58 (4), 131–140. doi:10.1016/j.envsci.2016.01.003
- Rogers, R.W., 1975. A protection motivation theory of fear appeals and attitude change. The Journal of Psychology, 91 (9), 93–114. doi:10.1080/00223980.1975.9915803
- Rogers, R.W., 1983. Cognitive and physiological processes in fear appeals and attitude change: A revised theory of protection motivation. London: The Guilford Press.
- Sampson, C.C., et al., 2015. A high-resolution global flood hazard model. Water Resources Research, 51 (9), 7358–7381. doi:10.1002/2015WR016954
- Schanze, J., Zeman, E., and Marsalek, J., 2007. Flood risk management: hazards, vulnerability and mitigation measures. Dordrecht: Springer.
- Scolobig, A., Marchi, B., and Borga, M., 2012. The missing link between flood risk awareness and preparedness: findings from case studies in an Alpine Region. Natural Hazards, 63, 499–520. doi:10.1007/s11069-012-0161-1
- Siegrist, M., 2013. The necessity for longitudinal studies in risk perception research. Risk Analysis, 33, 50–51. doi:10.1111/j.1539-6924.2012.01941.x
- Sivapalan, M., Savenije, H.H.G., and Blöschl, G., 2012. Socio-hydrology: A new science of people and water. Hydrological Processes, 26 (1), 1270–1276. doi:10.1002/hyp.8426
- Sobiech, C., 2012. Research design. In: Agent-based simulation of vulnerability dynamics. s.l. Berlin, Heidelberg: Springer, 9–29.
- Thieken, A.H., et al., 2007. Coping with floods: preparedness, response and recovery of flood-affected residents in Germany in 2002. Hydrological Sciences Journal, 52, 1016–1037. doi:10.1623/hysj.52.5.1016
- Thieken, A.H., et al., 2016. Review of the flood risk management system in Germany after the major flood in 2013. Ecology and Society, 21 (2). doi:10.5751/ES-08547-210251
- Tonn, G.L. and Guikema, S.D., 2017. An agent-based model of evolving community flood risk. Risk Analysis, 38 (11), 1258–1278. doi:10.1111/risa.12939
- UNDRR (United Nations Office for Disaster Risk Reduction), 2015. Sendai framework for disaster risk reduction 2015–2030. Available from: https://www.undrr.org/implementing-sendai-framework/what-sf [Accessed 30 March 2020].
- Wainwright, J. and Mulligan, M., 2013. Environmental modelling –finding simplicity in complexity. 2nd ed. New York: John Wiley and Sons.
- White, G.F., 1945. Human adjustments to floods. Chicago: The University of Chicago. Department of Geography Research, Paper no. 29.
- Wolff, T.F., 1997. Geotechnical reliability of levees. Davis, CA: US Army Corps of Engineers Hydrologic Engineering Center.