
 ?Mathematical formulae have been encoded as MathML and are displayed in this HTML version using MathJax in order to improve their display. Uncheck the box to turn MathJax off. This feature requires Javascript. Click on a formula to zoom.
ABSTRACT
Using a statistical approach, Scheihing attempts to demonstrate the direct influence of recharge events in the Precordillera and the Andean Piedmont on water table variations in downstream alluvial fans. The author “unquestionably” discards the existence of ephemeral recharge processes in alluvial fans although they are frequently impacted by major floods. However, the author does not consider previous publications about recharge processes in arid alluvial fans, the hydraulic setting of the Pampa del Tamarugal Aquifer (PTA) and anthropogenic pressure changes in the PTA. Because the sustainable management of groundwater resources in drylands depends on a good understanding of hydrogeological processes, we propose a thorough reinterpretation of the short- and long-term PTA water table variations addressed by the author. In this comment, we illustrate the limits of the sole use of a statistical approach for characterizing both recharge processes and factors controlling the water table variations in the Atacama Desert.
Editor A. Fiori Associate editor not assigned
1 Introduction
Footnote*The Pampa del Tamarugal Aquifer (PTA) in Northern Chile ()) is a multilayer aquifer contained in the Miocene and Quaternary alluvial deposits of the Central Depression (), , and )) (Castillo Urrutia Citation1960, Fritz et al. Citation1981, Magaritz et al. Citation1990, JICA Citation1995, Rojas and Dassargues Citation2007, Rojas et al. Citation2010, Viguier et al. Citation2018, Citation2019a). PTA is one of major groundwater resources of Atacama Desert. Over the last three decades, since the late 1980s, groundwater withdrawals have increased by 1890% (~4.2 m3/s in 2018) leading to an overuse of the groundwater resources (Oyarzún and Oyarzún Citation2011, Valdés-Pineda et al. Citation2014, Chávez et al. Citation2016, Santoro et al. Citation2018, Viguier et al. Citation2019b). The increase in regional anthropogenic pressures has led to an increment of conflicts between water resource stakeholders (Santoro et al. Citation2018, Lictevout and Faysse Citation2018). Mean annual precipitation is less than 10 mm/year below 2000 m a.s.l. and reaches 250 mm/year in the Western Cordillera (Houston Citation2006). Precipitation occurs during the austral summer (December–March), with a higher magnitude during La Niña periods of the ENSO (e.g. ) and (); Chaffaut et al. Citation1998, Garreaud and Aceituno Citation2001, Garreaud et al. Citation2003; Houston Citation2006). The PTA is limited to the west in the basin floor by the impervious Coastal Cordillera and to the east in the Andean Piedmont by faults. In the Andean Piedmont, most recharge occurs by perennial stream losses (Viguier et al. Citation2018, Citation2019a) and a small amount by localized rainstorm infiltrations (Fritz et al. Citation1981, Scheihing et al. Citation2017). Groundwater flows up to salt flats located in the basin floor near the Costal Cordillera (). In the basin floor and at springs in the downstream part of the Andean Piedmont (e.g. Pica; ), groundwater is old and related to Pleistocene and Holocene paleo-wet phases (Fritz et al. Citation1981, Magaritz et al. Citation1990, Aravena Citation1995, Nester et al. Citation2007, Pfeiffer et al. Citation2018). In addition, Quaternary alluvial fans in the basin floor () are frequently impacted by high-magnitude floods, which are triggered by low-frequency rainstorms in the Precordillera (return period: approx. 6–12 years; Houston Citation2002, Citation2006). Houston (Citation2002) provides an interesting description of ephemeral recharge processes in alluvial fans.
Figure 1. Study area in the Pampa del Tamarugal Aquifer: (a) the main points of interest addressed in Scheihing (Citation2018). (b) The 2012–2015 groundwater levels, aquifer extent and hydrogeological cross-section, extracted from Viguier et al. (Citation2019a).
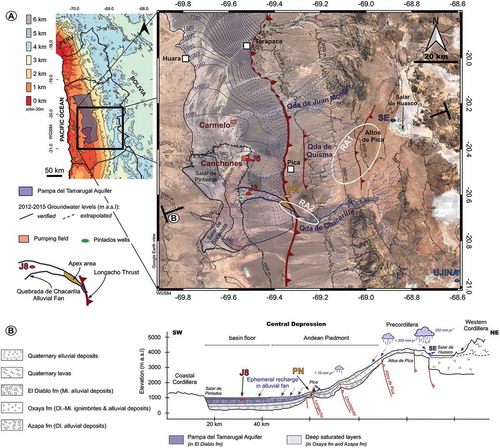
Figure 2. Vertical lithological and hydrogeological information at J6 and J8 observation boreholes, after JICA (Citation1995)
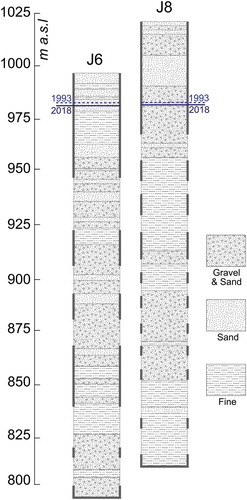
Figure 3. Hydrological and hydrogeological time series. (a) Oceanic Niño Index (http://origin.cpc.ncep.noaa.gov/products/analysis_monitoring/ensostuff/ONI_v5.php). Grey, red and blue curves display, neutral, El Niño and La Niña phases of the ENSO, respectively. (b) Monthly precipitation (mm) at Ujina meteorological station in the Andes (4300 m a.s.l.). Data is available at the DGA website (www.dga.cl). (c) Groundwater level time series (m a.s.l.) at J6 and J8, located at ~500 m and ~17 km from the Canchones Pumping field, respectively (www.dga.cl). Data in 1993 (drilling period) is extracted from JICA (Citation1995). (d) Zoom of 1998–2002 time-period at J8. Ephemeral recharge events related to the 1999, 2000 and 2001 floods in the Quebrada de Chacarilla alluvial fan are reported by blue arrows. Associated values (in mm/year) are inferred from WTF method (Scanlon et al. Citation2002) with a specific yield of 0.08 [-] (Houston Citation2002). (e) Pumping changes at the Canchones (red line) and Carmelo (green line) pumping fields. Carmelo pumping field starts in 1999. Authorized groundwater extraction is fully described in Viguier et al. (Citation2019b), but are also available in Rojas (Citation2005), Rojas and Dassargues (Citation2007), Chávez et al. (Citation2016) and at the DGA data base (www.dga.cl).
![Figure 3. Hydrological and hydrogeological time series. (a) Oceanic Niño Index (http://origin.cpc.ncep.noaa.gov/products/analysis_monitoring/ensostuff/ONI_v5.php). Grey, red and blue curves display, neutral, El Niño and La Niña phases of the ENSO, respectively. (b) Monthly precipitation (mm) at Ujina meteorological station in the Andes (4300 m a.s.l.). Data is available at the DGA website (www.dga.cl). (c) Groundwater level time series (m a.s.l.) at J6 and J8, located at ~500 m and ~17 km from the Canchones Pumping field, respectively (www.dga.cl). Data in 1993 (drilling period) is extracted from JICA (Citation1995). (d) Zoom of 1998–2002 time-period at J8. Ephemeral recharge events related to the 1999, 2000 and 2001 floods in the Quebrada de Chacarilla alluvial fan are reported by blue arrows. Associated values (in mm/year) are inferred from WTF method (Scanlon et al. Citation2002) with a specific yield of 0.08 [-] (Houston Citation2002). (e) Pumping changes at the Canchones (red line) and Carmelo (green line) pumping fields. Carmelo pumping field starts in 1999. Authorized groundwater extraction is fully described in Viguier et al. (Citation2019b), but are also available in Rojas (Citation2005), Rojas and Dassargues (Citation2007), Chávez et al. (Citation2016) and at the DGA data base (www.dga.cl).](/cms/asset/1bd94d80-381a-401c-9eac-cc24a221b246/thsj_a_1764001_f0003_oc.jpg)
By the comparison of precipitation records in the Andes, at Ujina meteorological station (4300 m a.s.l.), with water table time series at J8 (1021 m a.s.l.) and J6 (997 m a.s.l.) in the basin floor (, and ) and ()), Scheihing (Citation2018) attempts to demonstrate the direct influence of recharge events into the Precordillera and the Andean Piedmont on water table variations in downstream alluvial fans. According to that study, the author discards the existence of ephemeral recharge processes in downstream alluvial fans.
In this comment, we provide a reinterpretation of the hydrogeological data considering earlier literature and anthropogenic pressure changes that were not considered by Scheihing (Citation2018). Section 2 addresses the short-term water table variations and the ephemeral recharge processes in the Quebrada de Chacarilla alluvial fan, and Section 3 addresses the long-term water table variations and their relationship with the anthropogenic pressure changes (pumping rates) in the vicinity of observation boreholes J6 and J8.
2 Ephemeral recharge and short-term water table fluctuations in the Quebrada de Chacarilla alluvial fan
Scheihing (Citation2018) discards the existence of recharge processes in the alluvial fan of the Quebrada de Chacarilla (). However, during the last two decades, the apex area in the upstream part of the alluvial fan and the rest of the drainage area were both impacted by major floods in 1999, 2000, 2001 and 2012 during La Niña wet phases (Houston Citation2002, Sepúlveda et al. Citation2014). In the following section (Section 2.1), we discuss several findings from earlier literature that were not considered in Scheihing (Citation2018) and reinterpret (Section 2.2) the water table fluctuations posterior to major floods.
2.1 Ephemeral recharge processes in alluvial fans: unused literature
Even though there are few descriptions or reports for the Quebrada de Chacarilla alluvial fan (Houston Citation2002), there are several examples in the literature describing ephemeral and localized recharge processes in arid alluvial fans (among others, Simmers et al. Citation1997, Scanlon et al. Citation1999, Citation2006, Hogan et al. Citation2004, Massuel et al. Citation2006, Shanafield and Cook Citation2014, Hashemi et al. Citation2015, Pakparvar et al. Citation2017), especially within the coarse and unconsolidated alluvial deposits of gullies located in the drainage and apex areas. In those areas, permeable deposits allow a rapid and deep infiltration of floodwater, which prevents the evaporation and promotes the recharge at depth. In the PTA, Viguier et al. (Citation2018) performed geophysical exploration (TDEM) and highlighted the presence of both leached vadose zones in the apex of alluvial fans (~90 m thick), resulting from deep and rapid infiltration (e.g. Scanlon et al. Citation1999, Massuel et al. Citation2006), and unsaturated wet fronts below the active gullies of drainage areas.
Scheihing (Citation2018) statistically shows a correlation between flood events in the area “RA2”, related to precipitation records at Ujina station in the Andes, and groundwater level fluctuations at J8 (). This correlation allows the author to consider “RA2” as a recharge area of the aquifer. According to an arbitrary delimitation area (circle-delimitation reported in ), the author points to this area as part of the Andean Piedmont and not of the Quebrada de Chacarilla alluvial fan. Consequently, Scheihing (Citation2018) discards any ephemeral recharge processes in the Quebrada de Chacarilla alluvial fan.
But the author does not consider the geomorphological and geological studies specifying that “RA2” includes the apex of the Quebrada de Chacarilla alluvial fan (Houston Citation2002, Jordan et al. Citation2010, Blanco et al. Citation2012, Evenstar et al. Citation2017). For example, Houston (Citation2002) provides a geomorphological analysis of the Quebrada de Chacarilla alluvial fan and describes the location of the apex due to the presence of the Longacho Thrust (). Despite that Scheihing (Citation2018) discards the existence of ephemeral recharge processes in the alluvial fan, the author unintentionally presents statistical results demonstrating the occurrence of ephemeral recharge events in the apex of the Quebrada de Chacarilla alluvial fan. This example underlines the necessity to consider geological and geomorphological information prior to setting up hydrogeological models (Huggenberger and Aigner Citation1999).
In addition, earlier analyses of environmental tracers in groundwater indicate that infiltration of floodwater in the drainage and apex areas of alluvial fans contributes to the aquifer recharge. Indeed, the 14C activity is low (Holocene and late Pleistocene mean ages; Fritz et al. Citation1981, Magaritz et al. Citation1990) in three boreholes of the Quebrada de Chacarilla alluvial fan (at “Pintados wells”; ), but it is higher in the shallowest borehole (46.6 pmc) than in the other two deeper ones (22.3 and 6.1 pmc). In addition, by groundwater sampling between 1976 and 1978, Fritz et al. (Citation1981) showed the presence of tritium in the groundwater of the shallowest borehole (2.1 ± 0.3 TU), whereas all boreholes in the basin floor and distant from alluvial fans were devoid of tritium. Environmental tracer analyses suggest that ephemeral recharge events in alluvial fans lead to a mixing between a low proportion of modern water (recharge) and the rest of the aquifer composed of older groundwater. Viguier et al. (Citation2019a) point out the need to quantify modern and renewable groundwater proportions in the PTA for the development of sustainable exploitation policies. Therefore, based on several multidisciplinary findings from the literature, we consider the probability to be null that ephemeral recharge processes (posterior to a major flood) do not take place in the drainage and apex areas of the Quebrada de Chacarilla alluvial fan.
2.2 Abrupt water table variations posterior to flood events
Scheihing (Citation2018) states that the recharge rates, estimated by Houston (Citation2002) in the Quebrada de Chacarilla alluvial fan “are not reliable” due to the use of the Water Table Fluctuation (WTF) method in a confined aquifer. But the PTA (including the Quebrada de Chacarilla alluvial fan) is a multilayer aquifer that is unconfined in its first horizons (). In addition to lithological information (), earlier publications have revealed this unconfined hydraulic setting. First, the analysis of water stable isotopes by Fritz et al. (Citation1981) showed that groundwater is influenced by fractioning processes when the water table is close to the ground surface. Due to the unconfined hydraulic setting of the aquifer, partial groundwater evaporation leads to the formation of salt flats in the southwestern part of the aquifer (Pfeiffer et al. Citation2018, Lagos et al. Citation2020). In this area, Chávez et al. (Citation2016) estimated that a water table depth greater than 12 m leads to drought stress of Prosopis tamarugo stands. Secondly storage coefficient values, inferred from pumping tests and transient-state groundwater modelling calibrations (JICA Citation1995, Rojas and Dassargues Citation2007, Rojas et al. Citation2010), range from 5 × 10⁻⁷ [-] (i.e. confined hydraulic setting for deep horizons) to 3 × 10⁻¹ [-] (i.e. unconfined hydraulic setting for shallow horizons). Finally, by geophysical soundings (TDEM), Viguier et al. (Citation2018) highlighted a well-defined contrast of resistivity between the unsaturated and saturated horizons of the aquifer. The elevation (m a.s.l.) of this resistivity contrast is equivalent to the groundwater levels (m a.s.l.) in boreholes, which proves the unconfined hydraulic setting in the first horizons of the PTA.
Consequently, the use of the WTF method is reliable for studying ephemeral recharge processes in the drainage and apex areas of the Quebrada de Chacarilla alluvial fan. In the vicinity of J8, the aquifer responds to ephemeral recharge events resulting from the infiltration of floods ()). According to the WTF method (Scanlon et al. Citation2002) and considering 0.08 [-] as a local specific yield value (Houston Citation2002), we estimate that ephemeral recharge rates caused by the 1999–2001 floods range between 51 and 97 mm/year ()). Such recharge rates agree with those estimated in other arid alluvial fans and similar geomorphological areas (i.e. a few tens of mm/year; Scanlon et al. Citation1999, Citation2006). Occasional short-term water fluctuations at J6 could be also related to ephemeral recharge events in the alluvial fans of the Quebrada de Juan Morales to the north and the Quebrada de Quisma to the south ()). But the characterization of short-term water fluctuations at J6 is not easy due to numerous disturbances caused by local pumping. Note that due to the low frequency of water table measurements (monthly timestep), it is difficult to correctly assess the magnitude of the water table variations and consequently the ephemeral recharge rates, especially after the 2012 flood ()). Note also that such uncertainties in the assessment of recharge rates, and accordingly in the quantification of recharged volume, are also related to uncertainties in the assessment of specific yields.
3 Anthropogenic pressure changes: inaccuracies in the interpretation of long-term water table variations
According to Scheihing (Citation2018), the long-term water table rise observed at J8 in the early 2000s ()) would be due to the transmission of a pressure signal originating from floods infiltrating in the area “RA2”, ~20 km further east (), during the 1999–2001 period. Furthermore, the author’s statement is supported by the absence of major precipitation during the 2003–2004 period ()) and also by the fact that another observation borehole (i.e. J6), located outside of an alluvial fan active area, displayed a similar long-term water table variation to that of J8 ()). Scheihing (Citation2018) uses these arguments to state the absence of ephemeral recharge processes in alluvial fans, while assuming that long-term water table variations are exclusively due to a natural hydrogeological origin.
Indeed, changes in anthropogenic pressures were not considered, although information regarding groundwater extractions in the area was published in previous studies (Rojas Citation2005, Rojas and Dassargues Citation2007, Chávez et al. Citation2016) and is available at the National Water Authority database (www.dga.cl). From this database, it is known that groundwater for drinking water supply between 1985 and 1999, was mainly extracted from the Canchones pumping field close to J6 (). The average pumping rate was ~670 L/s and contributed to the water table decline (Chávez et al. Citation2016; ) and ()). In 1999, the pumping field was shifted ~18 km further north, from the Canchones area up to the Carmelo area (), leading to a significant reduction (−93%) of the groundwater extraction at Canchones pumping field (~45 L/s; )). As a result, water table recovery was observed between 1999 and 2004 at J6 and between 2000 and 2004 at J8 ()). Due to a greater distance between J8 and Canchones area (~17 km), than between J6 and Canchones area (~500 m) (), the water table response to pumping reduction is visible around one year later (see below) and with a lower magnitude at J8 than at J6 ()). In the early 2000s, the total authorized groundwater extraction in the PTA increased in the areas of Canchones and Carmelo, but also further south in the areas of the Pintados and Bellavista (salt flats) as well as to the east at Pica () (Chávez et al. Citation2016, Viguier et al. Citation2019b). Between 2004 and 2006, the total authorized groundwater extraction in the PTA increased by 114%, from 1.54 to 3.3 m3/s (Viguier et al. Citation2019b). At the Canchones pumping field, new water rights were assigned (~540 L/s). Consequently, the water table at both observation boreholes (J6 and J8) started to progressively decline again ()).
To test the previous assumption, that pumping interruption at Canchones pumping field caused the water table recovery at J8 in the early 2000s ()), we attempted to reproduce by a simple analytical modelling approach (see details in the Appendix), the pressure signal propagation in an idealized semi-infinite aquifer for the 1999–2005 period (). We considered as influential limit the water table variations at J6 (used as proxy), located ~500 m from the Canchones pumping field (). The distance between J6 and J8 averages ~16.5 km. Modelling enabled us to reliably reproduce the water table recovery at J8 at early times over the 1999–2001 period (ERMS = 0.04 and R2 = 0.97), considering a transmissivity of 5.47 × 10⁻³ m2/s and a storage coefficient of 1.28 × 10⁻³ [-] (). The estimated transmissivity value is like one deduced from the analysis of recovery data after a pumping period at J8 (i.e. 5.43 × 10⁻³ m2/s; JICA Citation1995). The estimated storage coefficient agrees with those obtained in the PTA (JICA Citation1995, Rojas and Dassargues Citation2007, Rojas et al. Citation2010) and suggests that the long-distance propagation of pressure signals in the basin floor mainly occurs through deeper and semiconfined horizons (intercepted by deep boreholes; ). The propagation time of the pressure signal up to J8 is visible (+1 cm) around 6 months later (), which explains the observed delay between the pumping interruption at Canchones pumping field (in 1999) and the beginning of long-term water table recovery at J8. The slight deviation (~7 cm) observed in 2000 () may result from additional water arrivals not considered in this modelling, such as ephemeral recharge events occurring in the Quebrada de Chacarilla alluvial fan at the same period ()). Although this modelling exercise reliably reproduces the early-time water table response at J8, caused by the interruption of pumping operation at Canchones pumping field in 1999, a deviation is observed after 2001 at the intermediate and late times (). This latter illustrates the limit of this simple analytical modelling – focused on the J6–J8 hydraulic relationship – that does not consider other boundary conditions (Razack et al. Citation1980) such as the implementation of other pumping, which would flatten the modelling curve by principle of superposition. Indeed, between 2001 and 2005 the total authorized groundwater extraction increased by 387% (+244 L/s) for mining purposes in the southern part of the PTA in the vicinity of the Quebrada de Chacarilla alluvial fan (Viguier et al. Citation2019b after DGA data base). In the Pica area, pumping increased by 57% (+58 L/s) during the same period. Thus, further modelling should consider all anthropogenic pressure changes in the PTA. Note that while a direct influence of Carmelo pumping field on J6 and J8 water table variations likely does not happen – it operates since 1999 ()) at ~19 km from J6 and ~35 km from J8 ()) – its potential influence (if it exists) is indirectly considered since it would affect first the water table variation at J6 that is used as the influential limit. Note also that the water table time series modelling after 2005 is complex due to an increment of pumping locations throughout the central-southern part of the PTA (Viguier et al. Citation2019b).
Figure 4. Modelling (and related error) of the pressure signal propagation in an idealized semi-infinite aquifer during the 1999–2005 time period, at J8, after the pumping interruption at the Canchones pumping field. J6 is the influential limit and it is used as proxy of the Canchones pumping field water table variations. At early times (1999–2001): ERMS = 0.04 and R2 = 0.97. T = 5.47 × 10⁻³ m2/s; S = 1.28 × 10⁻³ [-]. Observed deviation at intermediate and late times (ERMS = 0.65 and R2 = 0.96) results from the implementation of new withdrawals in the area, from 2001 onwards, which were not considered in this modelling exercise. Full blue line (J8) and dashed black line (J6) are polynomial trending curves (R2: 0.99) used for running the model at a suitable timestep. Further details are available in the manuscript (Section 3) and in the Appendix.
![Figure 4. Modelling (and related error) of the pressure signal propagation in an idealized semi-infinite aquifer during the 1999–2005 time period, at J8, after the pumping interruption at the Canchones pumping field. J6 is the influential limit and it is used as proxy of the Canchones pumping field water table variations. At early times (1999–2001): ERMS = 0.04 and R2 = 0.97. T = 5.47 × 10⁻³ m2/s; S = 1.28 × 10⁻³ [-]. Observed deviation at intermediate and late times (ERMS = 0.65 and R2 = 0.96) results from the implementation of new withdrawals in the area, from 2001 onwards, which were not considered in this modelling exercise. Full blue line (J8) and dashed black line (J6) are polynomial trending curves (R2: 0.99) used for running the model at a suitable timestep. Further details are available in the manuscript (Section 3) and in the Appendix.](/cms/asset/2b8e5eb2-cebe-4c04-be1d-6bfed2395f8a/thsj_a_1764001_f0004_oc.jpg)
Finally, by a simple modelling approach, we validate the role of anthropogenic pressure changes (pumping changes) in the observed long-term water table variations at J8 and J6. This allows us to discard the assumption proposed by Scheihing (Citation2018) that water table variations would be exclusively due to natural hydrological processes.
Scheihing (Citation2018) does not consider the anthropogenic pressure changes over time and, thus, needs complex assumptions to explain the observed water table variations in alluvial fans. Indeed, the author states that water table variations (pressure signals) at J8 originate from two recharge areas: “RA2” area (see above), but also “RA1” that corresponds to the Altos de Pica area in the Precordillera, ~50 km further east (). To support the connection between J8 and “RA1”, Scheihing (Citation2018) considers that “the water table fluctuation at well J8 positively correlates to a signal recorded at well PN”. This latter is located in the Andean Piedmont on the Longacho Thrust () and it is apparently related to precipitation and spring discharge “S1” in the Altos de Pica area. But this relationship could be also explained by successive ephemeral recharge events in the apex area of the Quebrada de Chacarilla alluvial fan (related to floods coming from rainstorms in the Altos de Pica area) and the propagation of pressure signals through the Longacho Thrust up to “PN”. Unfortunately, Scheihing (Citation2018) does not specify which signal is considered for correlating J8 and “PN”. This assumed connectivity between water table variations in alluvial fans (at J8) and direct recharge processes in the Precordillera (“RA1”) is merely based on single recorded signal over an 18-year period, which is poor for proposing a reliable hydrogeological interpretation.
4 Conclusion
In the Atacama Desert, the hydrogeological processes occurring in the Andean Piedmont and to the downstream in alluvial fans are complex and are related to different scales of time and space (e.g. Houston Citation2002, Citation2009, Rojas et al. Citation2010, Jayne et al. Citation2016, Viguier et al. Citation2018, Citation2019a, Marazuela et al. Citation2019, Gamboa et al. Citation2019). Nevertheless, a thorough understanding of these processes is needed for the sustainable management of the groundwater resources in the Atacama Desert (Santoro et al. Citation2018).
For the PTA, marked by an extreme hydroclimatic context and changing anthropogenic pressures (Viguier et al. Citation2019b), the sole use of a statistical approach does not allow any reliable assessment of the hydrogeological processes. While the use of a simple statistical approach is methodologically attractive, it may result in erroneous hydrogeological interpretations (Leduc et al. Citation2006), especially when anthropogenic pressure changes are not considered. Indeed, we show that pumping changes predominantly control the long-term water table variations in the PTA. Contrasting to Scheihing (Citation2018), ephemeral recharge processes in alluvial fans cannot be discarded from hydrogeological conceptual models of the Atacama Desert. Even though further studies are required to thoroughly assess the magnitude and frequency of these processes, they predominantly control the short-term water table variations observed in alluvial fans (apart from localized short pumping) and are very likely to have an impact on the renewal of the groundwater resources (mixing with old groundwater).
Such a failure to take these different factors into account would lead to a misunderstanding of the functioning of the aquifer and negatively impact on the management of the groundwater resources in Northern Chile.
Acknowledgements
Thanks to O. Fernández for the English revision.
Disclosure statement
No potential conflict of interest was reported by the authors.
Additional information
Funding
References
- Aravena, R., 1995. Isotope hydrology and geochemistry of Northern Chile groundwaters. Bulletin de l’Institut Français d’Études Andines, 24 (3), 495–503.
- Blanco, N., et al., 2012. Levantamiento geologico para el fomento de la exploracion de recursos minerales e hidricos de la Cordillera de la Costa, Depresion Central y Precordillera de la Region de Tarapaca (20°-21°) – 7 mapas escala 1: 100.000. (No. IR-12-50). Santiago: SNGM.
- Castillo Urrutia, O., 1960. El agua subterránea en el norte de la Pampa del Tamarugal. (No. 5). Santiago: Instituto de Investigaciones Geológicas.
- Chaffaut, I., et al., 1998. Précipitations d’altitude du Nord-Chili, origine des sources de vapeur et données isotopiques. Bulletin de l’Institut Français d’Études Andines, 27 (3), 367–384.
- Chávez, R.O., et al., 2016. 50 years of water extraction in the Pampa del Tamarugal basin: can Prosopis tamarugo trees survive in the hyper-arid Atacama Desert (Northern Chile)? Journal of Arid Environments, 124, 292–303. doi:10.1016/j.jaridenv.2015.09.007
- deMarsily, G., 1986. Quantitative hydrogeology, groundwater hydrology for engineers. London: Academic Press, Inc. ed.
- Evenstar, L.A., et al., 2017. Geomorphology on geologic timescales: evolution of the late Cenozoic Pacific paleosurface in Northern Chile and Southern Peru. Earth-Science Reviews, 171, 1–27. doi:10.1016/j.earscirev.2017.04.004
- Fritz, P., et al., 1981. Isotope hydrology of groundwaters in the Pampa del Tamarugal, Chile. Journal of Hydrology, 53 (1–2), 161–184. doi:10.1016/0022-1694(81)90043-3
- Gamboa, C., et al., 2019. The origin of solutes in groundwater in a hyper-arid environment: A chemical and multi-isotope approach in the Atacama Desert, Chile. Science of the Total Environment, 690, 329–351. doi:10.1016/j.scitotenv.2019.06.356
- Garreaud, R., Vuille, M., and Clement, A.C., 2003. The climate of the Altiplano: observed current conditions and mechanisms of past changes. Palaeogeography, Palaeoclimatology, Palaeoecology, 194 (1–3), 5–22. doi:10.1016/S0031-0182(03)00269-4
- Garreaud, R.D. and Aceituno, P., 2001. Interannual rainfall variability over the South American Altiplano. Journal of Climate, 14 (12), 2779–2789. doi:10.1175/1520-0442(2001)014<2779:IRVOTS>2.0.CO;2
- Hashemi, H., Berndtsson, R., and Persson, M., 2015. Artificial recharge by floodwater spreading estimated by water balances and groundwater modelling in arid Iran. Hydrological Sciences Journal, 60 (2), 336–350. doi:10.1080/02626667.2014.881485
- Hogan, J.F., Phillips, F.M., and Scanlon, B.R., 2004. Groundwater recharge in a desert environment: the Southwestern United States. Water Science and Application 9. ed. Washington, DC: American Geophysical Union.
- Houston, J., 2002. Groundwater recharge through an alluvial fan in the Atacama Desert, northern Chile: mechanisms, magnitudes and causes. Hydrological Processes, 16 (15), 3019–3035. doi:10.1002/hyp.1086
- Houston, J., 2006. Variability of precipitation in the Atacama Desert: its causes and hydrological impact. International Journal of Climatology, 26 (15), 2181–2198. doi:10.1002/joc.1359
- Houston, J., 2009. A recharge model for high altitude, arid, Andean aquifers. Hydrological Processes, 23 (16), 2383–2393. doi:10.1002/hyp.7350
- Huggenberger, P. and Aigner, T., 1999. Introduction to the special issue on aquifer-sedimentology: problems, perspectives and modern approaches. Sedimentary Geology, 129 (3–4), 179–186. doi:10.1016/S0037-0738(99)00101-3
- Jayne, R.S., et al., 2016. Spatial and temporal constraints on regional-scale groundwater flow in the Pampa del Tamarugal Basin, Atacama Desert, Chile. Hydrogeology Journal, 24 (8), 1921–1937. doi:10.1007/s10040-016-1454-3
- JICA, 1995. The study on the development of water resources in northern Chile, supporting report B: geology and groundwater. Santiago, Chile: JICA, DGA, PCI.
- Jordan, T.E., et al., 2010. Uplift of the Altiplano-Puna plateau: a view from the west. Tectonics, 29 (TC5007), 1–31. doi:10.1029/2010TC002661
- Lagos, M., et al., 2020. Challenges in determining soil moisture and evaporation fluxes using distributed temperature sensing methods. Journal of Environmental Management, 261, 110232. doi:10.1016/j.jenvman.2020.110232
- Leduc, C., et al., 2006. Comment on “Estimating groundwater mixing ratios and their uncertainties using a statistical multi parameter approach” by Rueedi, J., Purtschert, R., Beyerle, U., Alberich, C., Kipfer, R. J. Hydrol., 2005 (305): 1–14. Journal of Hydrology, 318 (1–4), 3–6. doi:10.1016/j.jhydrol.2005.06.018
- Lictevout, E. and Faysse, N., 2018. A doubly invisible aquifer: hydrogeological studies and actors’ strategies in the Pampa del Tamarugal Aquifer, Northern Chile. Water Alternatives, 11 (3), 592–606.
- Magaritz, M., et al., 1990. Source of ground water in the deserts of Northern Chile: evidence of deep circulation of ground water from the Andes. Ground Water, 28 (4), 513–517. doi:10.1111/j.1745-6584.1990.tb01706.x
- Marazuela, M.A., et al., 2019. Hydrodynamics of salt flat basins: the Salar de Atacama example. Science of the Total Environment, 651, 668–683. doi:10.1016/j.scitotenv.2018.09.190
- Massuel, S., et al., 2006. Deep infiltration through a sandy alluvial fan in semiarid Niger inferred from electrical conductivity survey, vadose zone chemistry and hydrological modelling. Catena, 67 (2), 105–118. doi:10.1016/j.catena.2006.02.009
- Nester, P.L., et al., 2007. Perennial stream discharge in the hyperarid Atacama Desert of northern Chile during the latest Pleistocene. Proceedings of the National Academy of Sciences, 104 (50), 19724–19729. doi:10.1073/pnas.0705373104
- Oyarzún, J. and Oyarzún, R., 2011. Sustainable development threats, inter-sector conflicts and environmental policy requirements in the Arid, Mining Rich, Northern Chile territory. Sustainable Development, 19 (4), 263–274. doi:10.1002/sd.441
- Pakparvar, M., et al., 2017. Assessment of groundwater recharge influenced by floodwater spreading: an integrated approach with limited accessible data. Hydrological Sciences Journal, 62 (1), 147–164. doi:10.1080/02626667.2016.1183164
- Pfeiffer, M., et al., 2018. Chronology, stratigraphy and hydrological modelling of extensive wetlands and paleolakes in the hyperarid core of the Atacama Desert during the late quaternary. Quaternary Science Reviews, 197, 224–245. doi:10.1016/j.quascirev.2018.08.001
- Razack, M., et al., 1980. Étude de l’effet de marée océanique sur un aquifère carbonate cotier (Miocène de l’algarve — portugal). Journal of Hydrology, 45 (1–2), 57–69. doi:10.1016/0022-1694(80)90005-0
- Rojas, R., 2005. Groundwater flow model of Pampa del Tamarugal Aquifer–Northern Chile. Leuven, Belgium: Katholieke Universiteit Leuven and Brussels, Belgium: Vrije Universiteit Brussel.
- Rojas, R., et al., 2010. Assessment of conceptual model uncertainty for the regional aquifer Pampa del Tamarugal – North Chile. Hydrology and Earth System Sciences, 14 (2), 171–192. doi:10.5194/hess-14-171-2010
- Rojas, R. and Dassargues, A., 2007. Groundwater flow modelling of the regional aquifer of the Pampa del Tamarugal, northern Chile. Hydrogeology Journal, 15 (3), 537–551. doi:10.1007/s10040-006-0084-6
- Santoro, C.M., et al., 2018. The Tarapacá declaration: “a waterless people is a dead people”. Chungará Arica, 50 (2), 169–174. doi:10.4067/S0717-73562018000200169
- Scanlon, B.R., et al., 2006. Global synthesis of groundwater recharge in semiarid and arid regions. Hydrological Processes, 20 (15), 3335–3370. doi:10.1002/hyp.6335
- Scanlon, B.R., Healy, R.W., and Cook, P.G., 2002. Choosing appropriate techniques for quantifying groundwater recharge. Hydrogeology Journal, 10 (1), 18–39. doi: 10.1007/s10040-0010176-2
- Scanlon, B.R., Langford, R.P., and Goldsmith, R.S., 1999. Relationship between geomorphic settings and unsaturated flow in an arid setting. Water Resources Research, 35 (4), 983–999. doi:10.1029/98WR02769
- Scheihing, K.W., 2018. Evidence of short-term groundwater recharge signal propagation from the Andes to the central Atacama Desert: a singular spectrum analysis approach. Hydrological Sciences Journal, 63 (8), 1255–1261. doi:10.1080/02626667.2018.1495838
- Scheihing, K.W., Moya, C.E., and Tröger, U., 2017. Insights into Andean slope hydrology: reservoir characteristics of the thermal Pica spring system, Pampa del Tamarugal, northern Chile. Hydrogeology Journal, 25 (6), 1833–1852. doi:10.1007/s10040-017-1533-0
- Sepúlveda, S.A., et al., 2014. Catastrophic, rainfall-induced debris flows in Andean villages of Tarapacá, Atacama Desert, northern Chile. Landslides, 11 (3), 481–491. doi:10.1007/s10346-014-0480-2
- Shanafield, M. and Cook, P.G., 2014. Transmission losses, infiltration and groundwater recharge through ephemeral and intermittent streambeds: A review of applied methods. Journal of Hydrology, 511, 518–529. doi:10.1016/j.jhydrol.2014.01.068
- Simmers, I., et al., 1997. Recharge of phreatic aquifers in (semi-)arid areas: IAH International Contributions to Hydrogeology 19. Simmers, Rotterdam: A.A. Balkema. ed. I.
- Thiéry, D., 2012. Code de calcul CATHERINE – principe et mode d’emploi. (No. BRGM/RP-61430-FR). Orléans, France: BRGM.
- Valdés-Pineda, R., et al., 2014. Water governance in Chile: availability, management and climate change. Journal of Hydrology, 519, 2538–2567. doi:10.1016/j.jhydrol.2014.04.016
- Viguier, B., et al., 2018. Multidisciplinary study for the assessment of the geometry, boundaries and preferential recharge zones of an overexploited aquifer in the Atacama Desert (Pampa del Tamarugal, Northern Chile). Journal of South American Earth Sciences, 86, 366–383. doi:10.1016/j.jsames.2018.05.018
- Viguier, B., et al., 2019a. Changes in the conceptual model of the Pampa del Tamarugal Aquifer: implications for Central Depression water resources. Journal of South American Earth Sciences, 94, 102217. doi:10.1016/j.jsames.2019.102217
- Viguier, B., et al., 2019b. Water table variations in the hyperarid Atacama Desert: role of the increasing groundwater extraction in the pampa del tamarugal (Northern Chile). Journal of Arid Environments, 168, 9–16. doi:10.1016/j.jaridenv.2019.05.007
Appendix
For an idealized semi-infinite aquifer, the 1D pressure signal propagation caused by a sudden and uniform hydraulic head variation can be expressed by EquationEquation (A1)(A1)
(A1) (deMarsily Citation1986):
where h is the hydraulic head variation [L] with respect to initial hydraulic head (Ht – Ht=0); x is the distance [L] between the influential limit and the observation point; t is time [T]; h0 is the sudden and uniform hydraulic head variation; erfc is the complementary error function.; and D is the idealized aquifer diffusivity equal to the ratio between the transmissivity T [L2 T–1] and the storage coefficient S [-].
While EquationEquation (A1)(A1)
(A1) is applied to confined aquifers, it can be used for unconfined aquifers if hydraulic head variations are small enough that the saturated thickness is considered constant (deMarsily Citation1986), which works given the involved water table variations () and ) and saturated thickness () in the PTA.
By the principle of superposition, the convolution form of EquationEquation (A1)(A1)
(A1) is (Razack et al. Citation1980, deMarsily Citation1986, Thiéry Citation2012):
EquationEquation (A2)(A2)
(A2) enables one to estimate the pressure signal propagation caused by an influential limit whose hydraulic head value changes over time. Such an analytical solution is useful for estimating the aquifer diffusivity when simultaneous hydraulic head variations are known.
About the J6 and J8 water table time-series, the available information was surveyed at an irregular monthly timestep () and ). Thus, we applied polynomial trending curves (R2 = 0.99) to reconstruct the water table time series at a smaller timestep ().