
 ?Mathematical formulae have been encoded as MathML and are displayed in this HTML version using MathJax in order to improve their display. Uncheck the box to turn MathJax off. This feature requires Javascript. Click on a formula to zoom.
ABSTRACT
Socio-hydrological flood risk models describe the temporal co-evolution of coupled human–flood systems. However, most models oversimplify the flood loss processes and do not consider companies’ substantial contribution to total losses. This work presents a socio-hydrological flood risk model for companies that focuses on changes in vulnerability. In addition, we augment the socio-hydrological model with a process-oriented, sector-specific loss model in order to capture damage processes more realistically. In a case study, we simulate the historical flood risk dynamics of companies in the floodplain of Dresden, Germany, over the course of 120 years. Our analysis suggests that the companies in Dresden increase their exposure more cautiously than private households and decrease their vulnerability more actively through private precaution. The augmentation, consisting of informative predictors, a refined probabilistic model, and the incorporation of additional data, improves the accuracy and reliability of the flood loss estimates and reduces their uncertainty.
Editor S. Archfield
Associate Editor K. Kochanek
1 Introduction
Flood risk is determined by hazard, exposure, and vulnerability, which change and interact over time, resulting in nonlinear risk dynamics such as the adaptation effect (Merz et al. Citation2010a, Citation2015, Di Baldassarre et al. Citation2015). The adaptation effect describes how societies decrease their vulnerability after repeatedly being affected by damaging flood events, eventually diminishing overall losses (Di Baldassarre et al. Citation2015, Kreibich et al. Citation2017). Traditional scenario-based approaches in flood risk assessment can fall short of capturing such risk dynamics as they do not account for feedbacks between the hydrological and socioeconomic domain (Di Baldassarre et al. Citation2013, Barendrecht et al. Citation2017, Srinivasan et al. Citation2017). The negligence of interactions can produce biased estimates of future flood risk and, hence, affect risk management negatively. The interplay between society and floods has been studied with different approaches such as hydro-social theory (Marks Citation2019, Devkota et al. Citation2020, Haeffner and Hellman Citation2020), socio-ecological systems (Ishtiaque et al. Citation2017), coupled human and natural systems (O’Connell and O’Donnell Citation2014, Abebe et al. Citation2019), and socio-hydrology. Socio-hydrology (Sivapalan et al. Citation2012, Citation2014) focuses on quantitative methods and employs a rich collection of modelling techniques (Blair and Buytaert Citation2016, Ross and Chang Citation2020). The objective of socio-hydrological flood risk assessment is a more realistic exploration of the possible pathways that a human–flood system might traverse in the future (Di Baldassarre et al. Citation2015, Merz et al. Citation2015, Barendrecht et al. Citation2017).
Stylized, conceptual models are a prevalent type of socio-hydrological models and describe the interactions between selected state variables through a set of coupled differential equations, each representing a system process (Blair and Buytaert Citation2016). They are commonly lumped and explain the macroscale behaviour of the human–flood system, which promotes the model interpretability. Socio-hydrological models focus on the understanding of the system, and they are better suited for the strategic guidance of long-term decision making than for specific management problems (Sivapalan and Blöschl Citation2015, Barendrecht et al. Citation2017).
Di Baldassarre et al. (Citation2013, Citation2015) introduced a conceptual model that explains how societies and rivers co-evolve within floodplains and is capable of capturing flood risk dynamics such as the adaptation effect. The model has been reproduced and refined widely in subsequent works that explore risk coping cultures (Viglione et al. Citation2014), flood memory (Ridolfi et al. Citation2021, Song et al. Citation2021), flood control and management (Di Baldassarre et al. Citation2017), risk perception (Ridolfi et al. Citation2020), resilience (Ciullo et al. Citation2017, Yu et al. Citation2017), or the relationship between flooding and economic growth (Grames et al. Citation2016). In an effort to develop a fully quantitative parameter estimation procedure for socio-hydrological models, Barendrecht et al. (Citation2019) used empirical data from private households to study the human–flood system in Dresden, Germany. The study of Barendrecht et al. (Citation2019) is a first step towards more rigorous socio-hydrological models that explore specific case studies and could provide useful results for practical decision support. As a consequent next step, the informed inclusion of process-oriented modelling approaches has the potential to improve socio-hydrological flood risk assessment.
First, the mathematical representation of the flood loss processes in socio-hydrological models is oversimplified. For example, the model by Di Baldassarre et al. (Citation2013) and its successor models derive monetary flood loss directly from the maximum flood discharge by parameterizing the topographic characteristics of the floodplain. However, from a loss modelling perspective, estimating flood loss from inundation depth would capture the physical loss processes with more detail, and empirical analyses confirmed the strong explanatory power of inundation depth as a predictor variable (Merz et al. Citation2010b, Hasanzadeh Nafari et al. Citation2016, Wagenaar et al. Citation2017, Vogel et al. Citation2018). In addition, other characteristics of flood loss data such as bimodality (i.e. disproportionally high shares of zero and total building loss) adds to the complexity (Wing et al. Citation2020). Barendrecht et al. (Citation2019) used a prevalent probabilistic beta model for loss estimation, which resulted in the overestimation of minor and the underestimation of major loss events. Dedicated probabilistic models that account for the frequent overdispersion in loss data could improve the accuracy of the estimates and reduce associated uncertainties (Rözer et al. Citation2019). Ignoring these advances in loss modelling biases the loss estimates and consequently the socio-hydrological model as a whole.
Secondly, the heterogeneity within society is a crucial but often neglected process detail in socio-hydrological models. The majority of conceptual models treat societies in the floodplain as homogeneous entities (Viglione et al. Citation2014, Ciullo et al. Citation2017, Ridolfi et al. Citation2020). Yet individual societal groups (i.e. households, companies, institutions, government) follow their own motives, which influence the relevant damage processes or their decisions regarding flood protection (Haer et al. Citation2017, Citation2019, Bubeck et al. Citation2018). Song et al. (Citation2021) investigated collective flood memory with a model that distinguishes between urban and rural societies in China and found differences in the accumulation of flood memory between the two groups. The variables that determine flood vulnerability also differ between private households and companies (Merz et al. Citation2010b) and even across economic sectors (Kreibich et al. Citation2007, Sieg et al. Citation2017). Therefore, flood loss models are either developed for specific sectors (e.g. residential, manufacturing, services) or they include the sector as a predictor in the model (Kreibich et al. Citation2010, Sieg et al. Citation2017, Paprotny et al. Citation2020, Schoppa et al. Citation2020). To date, methods for a sector-specific loss estimation in socio-hydrological modelling are lacking.
Thirdly, previous efforts in model development concentrated on private households (Haer et al. Citation2017, Citation2020, Barendrecht et al. Citation2019). Companies have not been addressed extensively in the socio-hydrological literature before, even though they usually account for large shares of total flood losses (Paprotny et al. Citation2020). Earlier works shed light on specific aspects of company flood risk; for instance, on flood impacts, adaptive behaviour, or recovery (Wedawatta and Ingirige Citation2012, Wedawatta et al. Citation2014, Li and Coates Citation2016, Jehmlich et al. Citation2020). Coates et al. (Citation2014, Citation2019) coupled an agent-based model to a hydrodynamic model to examine the behaviour of individual companies in the aftermath of a flood event. Nevertheless, there are no studies that explore the long-term dynamics of company flood risk, including feedbacks between the determinants of risk. In summary, the explicit consideration of new sectors and inter-sectorial differences could not only improve loss estimation in socio-hydrological models but also uncover variations in the decisions and behaviour within societies.
In this study, we aim to improve the currently available socio-hydrological flood risk models by addressing these shortcomings (i.e. oversimplified loss estimation, lack of heterogeneity, scarcity of models for companies). We integrate a process-oriented, sector-specific regression for loss estimation into a socio-hydrological model. Additionally, we study the risk dynamics of companies by transferring the socio-hydrological flood risk model for the residential sector by Barendrecht et al. (Citation2019) to companies in the city of Dresden, Germany, where recurring flood events induced the society to reduce its vulnerability (i.e. adaptation effect) (Kreibich et al. Citation2005, Thieken et al. Citation2007, Kreibich and Thieken Citation2009, Jehmlich et al. Citation2020). The research questions of this study are:
What is the added value of augmenting the socio-hydrological model with a process-oriented loss estimation and differentiating between economic sectors?
Can the socio-hydrological flood risk model for companies reproduce the observed adaptation effect, and do companies behave differently in respect of flood risk than private households?
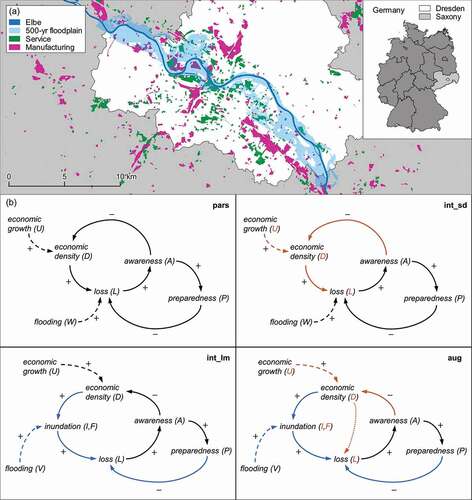
In a modelling experiment, we assess the benefits of the process-oriented loss estimation and the sector differentiation. ) displays the study area, the city of Dresden, Germany, which is located on the banks of the Elbe River.
Figure 1. (a) The 500-year floodplain of Dresden in Saxony, Germany, with manufacturing and service company premises (as in 2009). (b) Causal loop diagrams of the four socio-hydrological candidate models (model abbreviation in the top right of each box). System variables are represented by words and letters, while internal (solid) and exogenous (dashed) processes are indicated by arcs. Variables and processes that are augmented by the process-oriented loss estimation (blue) and the sector differentiation (orange) are highlighted in colour. The dotted orange arc between and
in the “aug” model does not have a sign as it visualizes the weighting of sector-specific losses according to occupied floodplain area (see section 2.3.2).
2 Methods and data
On the basis of the model by Barendrecht et al. (Citation2019) for the residential sector, we developed a socio-hydrological flood risk model for small and medium-sized companies from the manufacturing and service sector. Subsequently, we augmented the new company model by a process-oriented loss estimation and a sector differentiation. In the following, we introduce four model versions with increasing complexity, which we used in the modelling experiment. Afterwards, we present the socio-hydrological model and the two augmentations in detail.
2.1 Model versions
For the systematic examination of the added value of the process-oriented loss estimation and the sector differentiation, we configured four model versions, incrementally adding one augmentation option or both to the company model. We refer to the four model versions as follows:
Parsimonious model (“pars”): the adaptation of the socio-hydrological model by Barendrecht et al. (Citation2019) for companies, which acts as the benchmark. It pools economic sectors and uses a simplistic loss estimation (EquationEquations 1
(1)
Intermediate model with sector differentiation (“int_sd”): distinguishes between economic sectors but uses the simplistic loss estimation.
Intermediate model with process-oriented loss estimation (“int_lm”): includes the process-oriented loss estimation but does not differentiate between economic sectors.
Fully augmented model (“aug”): the most complex model, as it differentiates between economic sectors and features the process-oriented loss estimation.
The four model versions enable the isolated and joint assessment of the effect of the two augmentation options (process-oriented loss estimation and sector differentiation) on the socio-hydrological simulation. ) presents the four candidate models in the form of causal loop diagrams including all model variables, their interrelation, and feedbacks. Additionally, the diagrams highlight which system processes are affected by the respective augmentation option. First, we evaluated the fit of the candidate models to the observed socio-hydrological data – in particular, the accuracy and uncertainty of the loss estimates. Second, we conducted a leave-one-out cross-validation (LOO-CV) experiment to test the predictive capacity of the models for flood loss events out of the training sample. We quantify the predictive capacity of the models with the continuous ranked probability score (Matheson and Winkler Citation1976, Gneiting and Katzfuss Citation2014, Krüger et al. Citation2016, Jordan et al. Citation2019), a proper scoring rule that indicates the distance between a probabilistic forecast and an observation (see Supplementary material, Text S7).
2.2 Socio-hydrological flood risk model for companies
The socio-hydrological model considers the three determinants that affect the flood risk – hazard, vulnerability, and exposure (Kron Citation2005) – and focuses on the adaptive behaviour of the companies. We explain the socio-hydrological system using the example of the parsimonious model (pars) in ).
The flood hazard is represented by an annual maxima series of the discharge of the Elbe at the Dresden gauge. The public structural flood protection in Dresden, such as levees, is encoded as a protection level and expressed in the form of a design discharge
. Since the implementation of public structural flood protection lies within the authority of the federal state and its institutions, we consider the protection level exogenous to the socio-hydrological system. Flooding occurs in the model once the annual maximum discharge
exceeds the current protection level
. We assume that flooding impacts the company buildings in the floodplain, which is quantified by the monetary flood loss
.
After a damaging event, the flood risk awareness of the companies increases. An increase in the awareness leads to higher flood preparedness
. In this context, the term “preparedness” comprises the implementation of private precautionary measures by the companies themselves, such as the flood proofing of buildings. The awareness and preparedness describe the current vulnerability of the companies and rise instantaneously after a flood event. The degree of the increase depends on the total flood loss suffered by companies in Dresden (for awareness) and the resulting increment in the awareness (for preparedness). At times where the flood protection withstands the annual maximum discharge, the awareness and preparedness decay since companies forget about the flood risk and precautionary measures deteriorate.
The exposure dynamics in the floodplain are captured by the economic density , which is the share of the floodplain area that is covered by company premises. On the one hand, the economic density is driven by the economic growth rate
, which is also an exogenous forcing variable. When the economic growth rate is positive, more companies settle in the floodplain. On the other hand, high flood risk awareness motivates companies to move out of the floodplain and settle in safer places. The causal loop of the socio-hydrological system is closed since the economic density and the preparedness feed back into the total loss caused by an event. The area share of companies in the floodplain determines whether and how many companies are exposed to flooding and can actually incur damages. The level of preparedness influences the susceptibility of the companies to flood loss and, hence, the loss magnitude. Consequently, the flood loss and, thus, the flood risk is the product of the economic density (i.e. exposure) and the relative loss
, which depends on the flood discharge
(i.e. hazard) and the preparedness
(i.e. vulnerability). In this context, the relative loss
is the flood loss per unit area (i.e.
).
The socio-hydrological processes are described mathematically by three differential equations, which we split up into five equations for readability:
Model variables (capital letters) vary over time , which we omit in the notation for brevity. The equations contain a set of model parameters (Greek symbols) that control the strength of the variable interactions and their decay rate. The model is spatially lumped so that the parameters and variables describe the average characteristics and state of the companies in Dresden. These characteristics control the companies’ behaviour and, in turn, the entire dynamic of the coupled human–flood system.
provides an overview of all model variables and parameters including descriptions. We chose a non-dimensional model formulation by scaling all socio-hydrological variables (i.e. ,
,
,
,
) from 0 to 1, which reduces the number of free parameters (Viglione et al. Citation2014). As a result, the variables
,
,
,
, and
take a value of 1. Since the awareness, preparedness, and economic density evolve over time according to the three differential equations, they require the definition of initial values
,
, and
. We simulated the evolution of the socio-hydrological system with a time step
of one year, which is a reasonable time scale for the property-level adaptation through private precautionary measures of households or companies (Kreibich et al. Citation2007, Kienzler et al. Citation2015, Bubeck et al. Citation2020). For a more elaborate explanation of the parameter interpretations and the motivation for the individual equations, refer to Barendrecht et al. (Citation2019).
Table 1. Variables and parameters of the socio-hydrological model. The units and
refer to the number of companies in the floodplain and the number of implemented precautionary measures, respectively.
2.3 Model augmentation
2.3.1 Process-oriented loss estimation
The simplistic loss estimation in the parsimonious model infers the flood loss to buildings directly from the river discharge although monetary flood loss is commonly estimated from the inundation depth at the building, e.g. through depth-damage functions (Merz et al. Citation2010b, Gerl et al. Citation2016). Further, the simplistic loss estimation only considers the absolute flood discharge in the loss computation, although the magnitude by which the protection level is exceeded might also influence the loss severity (i.e. the difference between and
). Apart from structural flood protection, the inundation is controlled by the topographic conditions and the location of the companies in the floodplain. In the parsimonious model, this inundation process is not modelled explicitly but rather captured by one parameter, the discharge to loss relationship
. Here, we substituted this simplistic loss estimation with dedicated regression models that describe the inundation and loss processes in the floodplain with more detail. As in the conceptual socio-hydrological model, these regression models are lumped and describe the average inundation and loss of companies in the floodplain. As indicated by the blue arcs in ), we fully integrated these regression models into the overarching conceptual socio-hydrological model as sub-models.
For each event, the inundation regression predicts the share of the total commercial area that is flooded and the mean inundation depth
in these areas. The sub-model uses the event return period
and the economic density
in the floodplain at the time of the flood as predictors. This assumes that the economic density in the floodplain influences where new companies can settle. For instance, companies might have to move closer to the river as safer locations in the floodplain are already occupied. Previous socio-hydrological studies modelled this aspect similarly by simulating the distance of settlements to the river (Di Baldassarre et al. Citation2013, Viglione et al. Citation2014, Ridolfi et al. Citation2021). The inundation and loss regression, which we present in the following Equations (Equation6–9
(9)
(9) ), substitute for EquationEquations (1)
(1)
(1) and (Equation2
(2)
(2) ) from the parsimonious socio-hydrological model. Since the return period, which is derived from the annual maxima series of flood discharge, and the economic density determine the flood loss via the inundation, the feedback loop of the socio-hydrological system is maintained (see )).
Given that the observed share of flooded area in the floodplain can only take values between 0 and 1, we modelled it with a beta distribution (Ferrari and Cribari-Neto Citation2004). The observed inundation depth
is constrained to positive values, which is why we modelled it with a gamma distribution (see e.g. Sieg et al. Citation2019). The two linear regression terms of the inundation model read as follows:
with intercepts , predictor coefficients
, gamma shape parameter
, and beta precision parameter
. The variables
and
are the location parameters of the beta and gamma distribution, respectively. The logarithm and the logit function act as link functions that guarantee plausible parameter values (e.g.
can only take positive values). Subsequently,
and
are used in the loss regression.
The loss regression is based on the Bayesian regression model by Schoppa et al. (Citation2020). Here, we adopted a reduced version of this model considering only the two predictors that exhibited the highest explanatory power with respect to flood loss: inundation depth and preparedness (termed “precaution” in Schoppa et al. Citation2020). With the predicted mean inundation depth from the inundation regression and the preparedness
of the companies from the differential EquationEquation (4)
(4)
(4) , the socio-hydrological model provides two corresponding variables that can be used as predictors in the loss regression. Flood loss is commonly expressed relative to the replacement value of the building (Merz et al. Citation2010b) and, thus, ranges from 0 to 1. Therefore, the loss sub-model assumes that the observed building loss to companies in the floodplain
follows a zero-and-one-inflated beta distribution (
) (Ospina and Ferrari Citation2010), which is supported on the entire interval [0, 1]. This distribution mixes a beta distribution with a Bernoulli distribution and has four distribution parameters, three of which we predicted with linear predictor terms as follows:
where is the location parameter of the beta distribution,
is the zero‐and‐one‐inflation probability (i.e. the probability that the loss is 0 or 1),
is the conditional one-inflation probability (i.e. the probability that the loss is 1 rather than 0), and
is the precision of the beta distribution, which was not predicted. The regression intercepts and predictor coefficients are denoted by
and
. In contrast to the loss estimation in the parsimonious model, this approach differentiates between areas in the floodplain that are flooded and those that are not. The loss of the companies in the floodplain is the product of the share of flooded commercial area
, which we obtain from the inundation regression, and the mean of the zero-and-one-inflated beta distribution, which is the weighted mean of the beta and Bernoulli components of the mixture distribution (term in parentheses):
As the predicted flood loss is expressed in relative terms, the object-level loss model can be used to approximate the aggregated flood loss to all companies in the floodplain. That is, the loss prediction is the absolute building loss of the inundated companies divided by the sum of all company building values in the floodplain. Consequently, the lumped socio-hydrological model treats the companies in the floodplain as one collective, average entity.
2.3.2 Sector differentiation
The second model augmentation accounts for the heterogeneity among the companies. In this way, we consider differences in the vulnerability (e.g. damage processes) and exposure (e.g. economic growth) between economic sectors. We applied a coarse sector split between companies in the industrial and manufacturing sector and the service sector, in accordance with the “NACE Rev. 2” statistical classification of economic activities of the European Union (Eurostat Citation2008). For instance, the manufacturing sector comprises handicraft, construction, and fabrication companies (NACE codes: B–F), while the service sector includes enterprises from commerce, finance, education, or accommodation (NACE codes: G–U). This split was primarily motivated by the thematic resolution of the available data, which did not allow for a more detailed sector differentiation. Moreover, previous findings on sectorial differences in the damage processes of building values suggest that this is a reasonable separation (Sieg et al. Citation2017, Schoppa et al. Citation2020).
We adapted the previously presented sub-models (socio-hydrological, inundation, and loss) so that they capture the differences between the two sectors. As highlighted with orange colour in ), the models that include sector differentiation produce sector-specific estimations of the inundation and flood loss
and allow the economic density
in the floodplain to develop separately for manufacturing and service companies. In the sector-differentiating models (int_sd, aug), the overall flood loss
is the weighted sum of the sector-specific loss estimates, where the weights correspond to the contribution of each sector to the total commercial area (represented by the dotted orange arc in the “aug” model in )). Introducing the sector differentiation required adjustments to the model structure. Firstly, the models are sector specific for the parameters risk-taking attitude, effectiveness of preparedness, and initial economic density (
,
, and
). For example, the risk-taking attitude became a parameter vector
instead of a scalar, with one entry for each sector (i.e. manufacturing and service). Secondly, we added the economic sector as a discrete predictor variable in the inundation and loss regressions (in Equations 6-8), similar to Schoppa et al. (Citation2020). Finally, we reparametrized the probabilistic model to account for the presence of multiple sectors.
Limited detail in the historical data for awareness, preparedness, and loss hindered the creation of a full sector-specific model configuration across all variables. We had to lump the parameters that control the awareness and preparedness so that the simulations were constrained to the same value for these variables. Similarly, the loss regression could not be calibrated with sector-specific loss reports since disaggregated estimates were only available for the Citation2002 flood. However, the economic density and loss estimation allowed for disparity between the sectors, which could propagate through the coupled socio-hydrological system and reveal distinct risk dynamics. The model equations for the sector-differentiating models can be obtained from the Supplementary material (Text S5).
2.4 Bayesian parameter estimation using empirical data
We estimated the parameters of the four socio-hydrological model versions from empirical data by means of Bayesian inference (Gelman et al. Citation2013, McElreath Citation2018, van de Schoot et al. Citation2021). The data that inform the models are composed of hydrological time series, inundation maps, telephone surveys, historical land-use maps, and economic data. provides an overview of the model data. We confined the socio-hydrological system spatially by the area that a flood with a return period of 500 years would inundate (see )). Accordingly, the data describe the average of the model variables within this maximum floodplain area. While data for the forcing variables () are available for the entire study period, observations for the socio-hydrological system variables (
) are only available in certain years. The model simulations estimate the state of these variables in years without data coverage. The introduced model augmentations enhance the amount of data that is available for parameter learning by time-invariant observations. The process-oriented loss estimation is informed by object-level loss data from telephone surveys (n = 597) and inundation data (int_lm: n = 26; aug: n = 56), while the sector differentiation doubles the economic density data (i.e. one set of observations per sector) in comparison to the aggregated approach. Bayesian parameter estimation inherently quantifies uncertainties in the model, parameters, and observations. For the socio-hydrological system variables, we assessed the observational uncertainty based on the dataset size or domain knowledge. The Supplementary material (Texts S2–S4) provides further information on data processing and uncertainty (Hosking Citation1990, Ferrari and Cribari-Neto Citation2004, Maier Citation2014, Delignette-Muller and Dutang Citation2015, Sennhenn-Reulen Citation2018).
Table 2. Data used for parameter estimation. The temporal coverage indicates for which years of the simulation period the respective data are available.
Bayesian inference allows for the incorporation of information from previous experiments into the parameter estimation through priors. Here, we adopted the posterior parameter estimates from the residential model from Barendrecht et al. (Citation2019) as priors for the socio-hydrological parameters in the new company models. In doing so, we assumed that the adaptive behaviour of companies in Dresden is to some degree related to the actions of residential households. To ensure that the adopted, informative priors do not bias the inference, we conducted prior predictive checks (i.e. checking the plausibility of the prior through simulation) and tested different priors. Details on the prior distributions, the prior checking, and the computational implementation of the Bayesian models in the probabilistic software Stan are contained in the Supplementary material (Texts S1 and S6, and Tables S1–S3) (Hoffman and Gelman Citation2014, Bürkner Citation2017, Carpenter et al. Citation2017, Gelman et al. Citation2020).
3 Results and discussion
3.1 Socio-hydrological simulation
3.1.1 Temporal dynamics of flood risk
Using the four candidate models and empirical data, we estimated the model parameters and simulated the co-evolution of the socio-hydrological flood system for companies in Dresden over the period 1900–2019. In the following, we evaluate whether the models reproduce the observed adaptation effect in Dresden successfully. shows the fit of the four candidate models to the socio-hydrological observations. The simulated means of the model variables are shown with 95% credible intervals against the observations. The candidate models with the sector differentiation predict the development of the economic density separately for the manufacturing (“man”) and service (“ser”) sectors.
Figure 2. Fit of the candidate models to data. Each plot panel shows one candidate model: pars, parsimonious; int_lm, intermediate with process-oriented loss estimation; int_sd, intermediate with sector differentiation; aug, fully augmented.
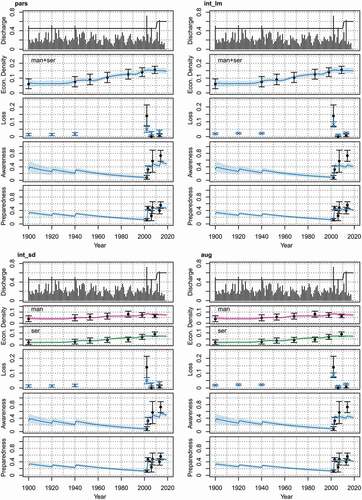
The models agree on the evolution of the economic density in the floodplain, and the simulations are generally within the credible intervals of the observations. In contrast, the candidate models show larger variation in the estimations of flood loss, and the predictions match the reported losses worse than they do for the economic density. The models with the process-oriented loss estimation (int_lm, aug) predict larger losses for the 2002 event and lower losses for the 2006 and 2013 events than the models with the simplistic loss estimation (pars, int_sd). We discuss the performance of the individual models in the loss estimation in more detail in section 3.2. As the awareness directly depends on the loss magnitude, the awareness time series of the candidate models diverge after the severe 2002 flood. The models with the simplistic loss estimation reproduce the awareness data better, but at the cost of overestimating the 2006 and 2013 flood losses. Model differences in the preparedness time series are less pronounced since the preparedness only indirectly depends on the flood loss via the awareness. Overall, the preparedness simulations agree with the observations.
The adaptation of the companies after the severe 2002 flood is captured accurately. The increase in awareness and preparedness was also reported in comparable empirical analyses of the flood event (Kreibich et al. Citation2007, Jehmlich et al. Citation2020). The models do not suggest that damaging flood events substantially affect the settling or abandonment of the floodplain by the companies. Instead, other motives such as economic growth seem to govern the development of the economic density in the Elbe floodplain. Jehmlich et al. (Citation2020) conducted qualitative interviews with companies in Dresden and reported that emotional attachment, tradition, and continued benefits of a location in the floodplain (e.g. proximity to customers) also induce companies to stay.
The uncertainty in the simulations of the economic density, awareness, and preparedness is largest in 1900 and decreases towards the present. Overall, the confidence is particularly low in the case of awareness, compared to the other variables. The uncertainties reflect the availability of historical data and the information content in the prior for the respective variable. Specifically, a comparably large number of observations is available for the economic density, and the prior for the initial preparedness is comparably strong (see ). In contrast, the prior on the initial awareness
is relatively weak, and the awareness data are most uncertain and smallest in number. In addition, awareness takes a pivotal position in the socio-hydrological system with connections to three other random variables (see )). This allows for strong variable interaction and leads to an accumulation of uncertainties in the awareness simulations.
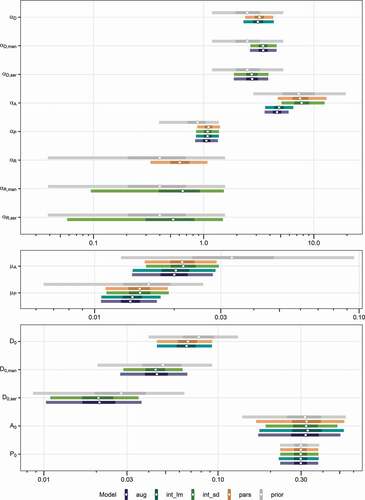
Figure 3. Marginal posterior distributions (log-scale) of the socio-hydrological parameters in the four candidate models: pars, parsimonious; int_lm, intermediate with process-oriented loss estimation; int_sd, intermediate with sector differentiation; aug, fully augmented. The marginal prior distributions are the adopted posterior distributions from Barendrecht et al.’s (2019) model for the residential sector. The points show the median, while the bars correspond to 50% and 95% credible intervals.
In summary, all tested model structures are capable of reproducing the essential dynamics of the coupled human–flood system, especially the adaptation effect. Variations across model simulations mainly affect the loss and awareness estimates and arise from the difference in the loss estimation.
3.1.2 Insights on the adaptive behaviour of companies
The parameter estimates of the candidate models describe the adaptive behaviour of companies in Dresden with respect to the flood risk. shows the marginal prior and posterior distributions of the socio-hydrological parameters in the four candidate models. Model parameters with subscripts (i.e. “man” and “ser”) refer to sector-specific parameters that are included in the candidate models with the differentiation.
The posteriors reveal whether companies behave differently than private households, as they can be compared to the model fit of Barendrecht et al. (Citation2019) for the residential sector in Dresden. Unless otherwise noted, we adopted the posteriors of this residential model as priors for our company models, so that differences are directly visible in . The estimated risk-taking attitude () of the companies is larger in the median than the adopted a priori parameter value. This indicates that companies in Dresden are less risk-taking than private households with respect to populating the floodplain. That is, commercially used areas grow more slowly and disintegrate more rapidly than residential areas. The fits suggest a slight difference between the economic sectors in the risk-taking attitude, but its magnitude is small given the level of uncertainty. For the anxiousness (
), we assigned a prior that is smaller than the residential posterior because the estimate for the private households proved to be implausibly high for the company model. With median values around 4.7 (int_lm, aug) and 7.6 (pars, int_sd), the posterior company anxiousness is lower than the reported anxiousness of private households (median: 11). The parameter directly depends on the magnitude of flood loss and, hence, the estimates differ relatively strongly between the company models with and without the process-oriented loss estimation. The candidate models agree on the activeness (
) and suggest that, given the same level of awareness, companies implement more precautionary measures than private households because the posterior estimates exceed the prior. For the effectiveness of the precautionary measures (
), we chose a prior that allowed for larger parameter values and was less informative than the posterior from the residential model. The comparison of the posteriors points towards larger effectiveness of the preparedness for companies (
: 0.61,
: 0.65,
: 0.53) than for private households in the median (0.16). The forgetfulness (
) and the decay rate of precautionary measures (
) are lower than for the private households, which can be interpreted more intuitively when expressed as half times (i.e. the time until the awareness and preparedness are halved). Depending on the candidate model, the median half time of the awareness lies between 32 and 35 years, which is substantially longer than the half time for private households (21 years). The median half time of precautionary measures varies between 46 and 50 years across the company models, which is only slightly larger than the value for the residential sector (43 years). The initial values of the economic density (
) cannot be compared to the settlement density of private households since the variables describe distinct quantities. The variation in the simulated awareness time series also reflects in the initial awareness (
), which varies comparably strongly across the candidate models. The initial preparedness (
), however, is similar for the four company models. The posteriors indicate that the company awareness and preparedness in the year 1900 was similar to that of the private households, yet the initial values of these two variables are relatively uncertain parameters.
In summary, the companies in Dresden are not as anxious as private households, but they are less risk-taking and less forgetful, and more actively undertake precautionary measures. The posteriors of the sector-differentiating parameters imply minor differences in behaviour between the manufacturing and the service sector. However, these deviations are small in comparison to the associated uncertainties and do not allow for robust statements. Overall, the parameter estimates and the simulated time series (section 3.1.1) show that companies reduce their vulnerability through private precautions, rather than reducing their exposure through resettling. This is in line with the qualitative interviews of Jehmlich et al. (Citation2020), where a considerably larger share of companies decided to undertake precautionary measures instead of dissolving or moving away.
3.1.3 Information content in priors and data
The contraction of the posterior relative to the prior densities in shows that, for most parameters, the data convey additional information that reduces the a priori parameter uncertainty. The sector-specific effectiveness of preparedness and the initial values of the awareness and preparedness (), however, are informed less by the data and, in turn, depend more strongly on their priors.
The plot also highlights the benefit of using informative priors, especially for socio-hydrological models where datasets are usually small. The majority of the posterior parameters in the company models and, thus, the simulated variable time series exhibit considerably lower uncertainty than the posteriors of the private model, which act as priors in the company models. Yet the number of socio-hydrological data points for the inference were comparable in the two studies. For the residential model, however, no informative a priori knowledge from previous studies was available, resulting in larger a posteriori parameter uncertainty. The prior predictive checking during model setup indicated that the informative priors did not bias the inference (e.g. through underfitting or underestimating uncertainty) but rather increased the numerical stability of the models.
Correlations between model parameters or model overparameterization can inflate the associated uncertainties. For instance, the intermediate model with the sector differentiation (int_sd) resolves differences in the effectiveness of preparedness across sectors (,
) although no loss data for individual sectors is available. As a result, the parameters can only be identified indirectly via the sector-specific economic density data, leading to comparably large parameter uncertainty. The fully augmented model (aug), which also differentiates between sectors, does not suffer from this problem as the object-level survey data carry the necessary information on the inter-sectorial differences of damage processes.
Consequently, the socio-hydrological system processes that are resolved in the model require sources of information for parameter identification, either directly or indirectly through connected system variables. Our results show that the use of informative prior distributions, obtained from previous works, can complement the information provided by data, ultimately reducing uncertainty. In general, a deliberated prior choice in consideration of established practices such as prior predictive checking (Gabry et al. Citation2019, Gelman et al. Citation2020) promotes meaningful socio-hydrological inference.
3.2 Flood loss estimation
3.2.1 Predictive accuracy and uncertainty
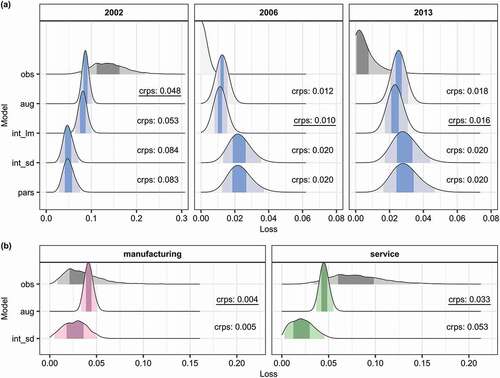
This work aims at improving the loss estimation in socio-hydrological flood risk models. Based on the accuracy and the uncertainty of the loss predictions, we assess the skill of the simplistic and process-oriented loss estimation. ) compares the estimated flood loss distributions of the four candidate models and the observed loss. The predictive error of each probabilistic loss estimate is quantified by the continuous ranked probability score (CRPS), where a perfect fit is indicated by a value of 0. In each plot panel, the best CRPS value is underlined. The loss estimates differ particularly between the models that feature the process-oriented loss estimation (int_lm, aug) and those that rely on the simplistic loss estimation (int_sd, pars). The process-oriented loss estimation predicts all three loss events more accurately, as indicated by consistently lower CRPS values, which are up to twice (i.e. 2006) as high for the simplistic loss estimation. In general, the predictions of the process-oriented loss estimation better capture the range in observed loss magnitudes between the individual events – from the minor 2006 to the severe 2002 loss. Moreover, the loss distributions of the process-oriented loss estimation are associated with considerably lower uncertainties than the predictions of the simplistic loss estimation. The parsimonious model (pars) yields the widest predictive distributions across the three observed events whereas the fully augmented model (aug) produces the narrowest predictive distributions, with 95% credible intervals up to four times smaller.
Figure 4. Comparison of modelled and reported flood losses. (a) Aggregated losses for the three observed flood events; (b) sector-specific losses of the 2002 flood. The shaded areas under the curves show 50% and 95% credible intervals. The continuous ranked probability score (crps) quantifies the error of the loss predictions; the best fit is underlined. Model codes: obs, observation; pars, parsimonious; int_lm, intermediate with process-oriented loss estimation; int_sd, intermediate with sector differentiation; aug, fully augmented.
The advantages of the process-oriented loss estimation arise from three aspects: increased detail in the representation of the damage process, greater flexibility of the probabilistic model, and additional data. First, the simplistic loss estimation is based on the diffuse relationship between flood discharge and loss. In contrast, the process-oriented model estimates the flooded area and the inundation depth, allowing for a predictor set with higher explanatory power. Secondly, the loss model augmentation addresses the common overdispersion of loss data with the dedicated inflation parameters of the zero-and-one-inflated beta distribution ( and
in EquationEquation 9)
(9)
(9) . The 2006 event underlines the benefit of this inflation, where the flood protection level was exceeded and caused a flood, but the resulting loss was nearly zero due to the small margin between the discharge and the protection level and the efficacy of the preparedness. The simplistic structure of the standard loss estimation is not capable of reproducing such threshold effects. Thirdly, the inundation and loss regression models are jointly informed by the socio-hydrological loss observations and the survey loss data. Although this complex loss model estimation comprises more parameters than the standard loss estimation, it has access to a far larger data pool for parameter inference (n = 656 vs. n = 3).
Yet even the fully augmented model (aug) underestimates the variation in the reported loss values. In the case of the 2002 flood, the underestimation can be explained by the spatial domain of the model, which only covers the Elbe floodplain. In this event, however, considerable parts of the city were inundated by the Elbe tributaries Weißeritz and the Lockwitzbach, which also flow through Dresden (Kreibich and Thieken Citation2009). As it is difficult to allocate the contribution to the overall loss in Dresden to the different rivers, we adopted the reported 2002 loss for the entire city. Under these circumstances, we can conclude that the loss estimates for 2002 are better than suggested by the figures, since the loss that is caused by the river Elbe must have been lower than the overall loss. While the confinement of the model domain to the main river is necessary to maintain a manageable socio-hydrological system, this oversimplification can cause biased loss estimates in the occurrence of compound events as in 2002.
The variation in the loss distributions due to the sector differentiation is small compared to the variation between models with different loss estimation approaches. Candidate models that share the same loss estimation routine (simplistic: pars, int_sd; process-oriented: int_lm, aug) exhibit similar CRPS values independently of how they treat the economic sectors (aggregated or differentiated). Small differences in CRPS (up to 0.005) occur between the fully augmented (aug) and the intermediate model with the process-oriented loss estimation (int_lm), with an advantage of the former (aug) for major and of the latter (int_lm) for minor loss events. ) displays loss predictions of the sector-differentiating models (int_sd, aug) for the manufacturing and service sectors for the 2002 flood, the only event for which sector-specific loss reports are available. Again, the model with the process-oriented loss estimation outperforms the model with the simplistic loss estimation for both sectors. Both models predict the loss of the manufacturing sector more accurately than that of the service sector.
3.2.2 Reliability of loss estimation
The previously presented loss estimates reflect the training performance of the models and, hence, overestimate the true predictive capacity of the loss estimations for unseen data. Therefore, we conducted an LOO-CV experiment, in which we recursively fitted the models to the data, each time leaving out one of the three observed loss events in Dresden. The goodness of fit to the held-out loss events provides insight on the models’ capacities to assess the flood loss of new events and has implications for the reliability of the candidate models.
summarizes the results of the LOO-CV experiment. Again, the columns of the plot show the estimated and observed company flood loss for the three reported flood events (2002, 2006, 2013). In each row, another loss event was held out of the training dataset. This means that the panels on the diagonal (background shading) are of special importance because they express the predictive skill of the models for new data. The loss estimates in the LOO-CV experiment are indistinguishable from the estimates of the model calibration runs (). The CRPS metrics show that the candidate models with the process-oriented loss estimation assess the three held-out loss events more precisely and with less uncertainty than the models with the simplistic loss estimation. In addition, the increase from training to validation error for the simplistic loss estimation (pars, int_sd; up to 75% increase in CRPS) is larger than that for the process-oriented loss estimation (int_lm, aug; up to 9% increase in CRPS).
Figure 5. Modelled and observed losses (as in )) for the leave-one-out cross-validation experiment. Panel rows indicate which flood event was held out during model training, while in each column the same loss event is displayed. Plot panels with background shading highlight the predictions for unseen data. Model codes: obs, observation; pars, parsimonious; int_lm, intermediate with process-oriented loss estimation; int_sd, intermediate with sector differentiation; aug, fully augmented.
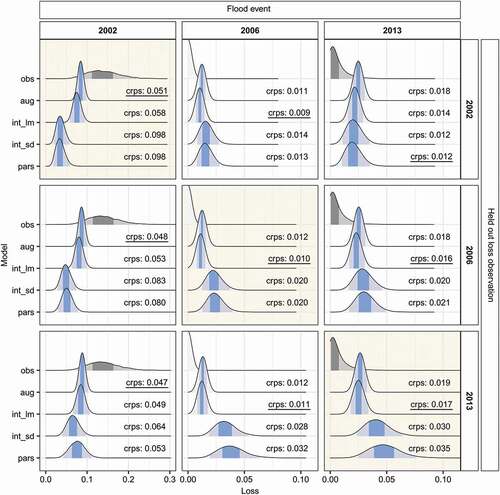
More importantly, the plot reveals that the process-oriented loss estimation provides more robust predictions than the simplistic loss estimation. When considering the plot panels within one column, we see that the loss distributions and predictive errors (i.e. CRPS) of the models with the augmented loss estimation (int_lm, aug) fluctuate less across the different training datasets than the distributions of the simplistic loss estimation (pars, int_sd). This implies that the simplistic loss estimation relies more strongly on the available loss data, which can lead to systematic underestimation when the training dataset does not contain observations of rare, high magnitude loss events. Since the process-oriented loss estimation combines the aggregated, large-scale losses from the socio-hydrological data with the vulnerability information from the object-level flood loss data, it is capable of extrapolating more reliably to unseen flood magnitudes. This is of particular advantage in socio-hydrological studies since historical flood loss reports are commonly scarce and short discharge records might not contain extreme floods.
Overall, the scarcity of loss reports for historical floods only allows for an evaluation of the predictive model performance for three events. Nevertheless, the training and validation errors coherently indicate that the process-oriented loss regression model (int_lm, aug) outperforms the simplistic loss estimation (pars, int_sd). On the contrary, the sector-specific modelling has a minor influence on the loss estimates and, given the level of uncertainty, we cannot assess the performance differences between the aggregated (par, int_lm) and sector-specific candidate models (int_sd, aug) confidently. Possibly, performance differences might emerge when additional sector-specific loss reports become available for the validation of the loss estimates.
3.3 Potential of augmentations in socio-hydrological modelling
Our results show that the presented augmentations increase the accuracy, confidence, and reliability in the loss estimates of the socio-hydrological flood risk model. The loss estimation benefits from the inclusion of the inundation and loss regression, which resemble the physical reality of the damage processes more closely and feature a refined probabilistic model. The sector differentiation did not improve the loss estimation conclusively. Since we lumped the awareness, preparedness, and loss across sectors due to data constraints, more distinctive risk dynamics between the sectors might have been attenuated. Conceivably, the influence of the sector differentiation on the loss prediction and the entire socio-hydrological system could be larger if these variables, conditional on sector-specific observations, were also allowed to develop individually for each sector or if the society under consideration involved more distinct actors – for example, in a model that considers private households and companies. The augmentations add further complexity to the socio-hydrological flood risk model, and, yet, the substantial increase in training data outweighs the increase in the number of parameters, ultimately reducing uncertainty.
As flood loss represents a central component in the coupled human–flood system (see )), the effect of the improved loss estimation enhances the validity of the entire socio-hydrological flood risk model. A biased loss estimation could propagate through the entire socio-hydrological system, leading to unrealistic system evolutions and misguided conclusions about the behaviour of society. The LOO-CV experiment shows that the process-oriented loss estimation provides more reliable loss estimates even in the absence of numerous reported loss events. This characteristic promotes the prospective transferability of the socio-hydrological flood risk model in space and time. Thus, the object-level flood loss data, which stem from various regions in Germany, facilitate the model application at other study sites with comparable socioeconomic conditions (e.g. building codes). In addition, credible loss estimates are a prerequisite for sound projections of the socio-hydrological flood system in Dresden into the future.
While this study focused on the improvement of one specific process in a socio-hydrological flood risk model (i.e. loss estimation), the notion of process augmentation could be extended to other components of the human–flood system. Socio-hydrological models are modular frameworks that stipulate how the considered system variables interact and co-evolve. Depending on the required degree of process detail, we could selectively replace one or several simplistic mathematical process representations with more informed estimation techniques, conditional on domain knowledge and additional data. As the targeted enhancement of socio-hydrological processes increases model complexity, it is only advisable when suitable and sufficient data are available to inform the additional parameters. Similarly, model augmentations might hinder the spatial transfer to other case studies where these additional data requirements cannot be satisfied. Particularly for variables that map the individuals or entities of society, like awareness or preparedness, data collection is intricate and expensive because it commonly relies on interviews or surveys (Barendrecht et al. Citation2019).
Returning to the human–flood system, next steps could aim at improving the representation of how households and companies become aware of the flood risk and what drives them to take action to protect themselves. Protection motivation theory provides a conceptual basis and models that could be added the socio-hydrological flood risk model in addition to the process-oriented loss model (Grothmann and Reusswig Citation2006, Bubeck et al. Citation2018). In the end, model development remains an iterative process, where recursive updates of the employed data streams or the model structure can improve the capacity of existing models to reproduce human–water dynamics and reduce the simulation uncertainty (Thompson et al. Citation2013, Hipsey et al. Citation2015, Sivapalan and Blöschl Citation2015).
4 Conclusions
All versions of the developed socio-hydrological flood risk model are capable of reproducing the adaptation effect for companies in Dresden that was observed over the past 20 years. The model augmentation, mainly in the form of process-oriented loss estimation, improves the accuracy and reliability of the loss estimates and reduces their predictive uncertainty (research question 1). The simulations suggest that companies settle more cautiously in exposed locations in the floodplain and prepare themselves more actively against flooding than private households do (research question 2).
Consequently, the augmented socio-hydrological flood risk model provides higher reliability for further analyses than the parsimonious model; for example, for projecting the evolution of the coupled human–flood system in Dresden into the future. In general, the informed augmentation of socio-hydrological models of all kinds (e.g. for drought or water resources management) by process-oriented model components facilitates the model transfer in space (i.e. to other study sites) and time (i.e. projections). After the integration of empirical data, the inclusion of validated, empirical models that reflect current process understanding represents the next step towards more precise and credible socio-hydrological modelling.
Supplemental Material
Download MS Word (91.4 KB)Acknowledgements
We thank Gotthard Meinel from the Leibniz Institute of Ecological Urban and Regional Development (IOER) for providing us with the historical land-use maps of Dresden. The discharge data can be downloaded from the Global Runoff Data Centre (https://www.bafg.de/GRDC/). The flood loss survey data for companies are distributed via the German flood damage database HOWAS21 (http://dx.doi.org/10.1594/GFZ.SDDB.HOWAS21). The inundation maps for Dresden are publically available at the Saxonian Environmental Agency (https://www.wasser.sachsen.de/hochwassergefahrenkarte-11915.html). Economic data (gross domestic product and asset values) are contained in the HANZE dataset (https://doi.org/10.4121/collection:HANZE). Data on flood losses in Dresden were collected by the Saxonian Relief Bank in the aftermath of flood events and were shared with the authors upon request.
Disclosure statement
No potential conflict of interest was reported by the authors.
Supplementary material
Supplemental data for this article can be accessed online at https://doi.org/10.1080/02626667.2022.2095207
Correction Statement
This article has been corrected with minor changes. These changes do not impact the academic content of the article.
Additional information
Funding
References
- Abebe, Y.A., et al., 2019. A coupled flood-agent-institution modelling (CLAIM) framework for urban flood risk management. Environmental Modelling & Software, 111 (February), 483–492. doi:10.1016/j.envsoft.2018.10.015
- Barendrecht, M.H., Viglione, A., and Blöschl, G., 2017. A dynamic framework for flood risk. Water Security, 1, 3–11. doi:10.1016/j.wasec.2017.02.001
- Barendrecht, M.H., et al., 2019. The value of empirical data for estimating the parameters of a sociohydrological flood risk model. Water Resources Research, 55 (2), 1312–1336. doi:10.1029/2018WR024128
- Blair, P. and Buytaert, W., 2016. Socio-hydrological modelling: a review asking “why, what and how? Hydrology and Earth System Sciences, 20 (1), 443–478. doi:10.5194/hess-20-443-2016
- Bubeck, P., et al., 2018. Insights into flood-coping appraisals of protection motivation theory: empirical evidence from Germany and France. Risk Analysis, 38 (6), 1239–1257. doi:10.1111/risa.12938
- Bubeck, P., et al., 2020. Using panel data to understand the dynamics of human behavior in response to flooding. Risk Analysis, 40 (11), 2340–2359. doi:10.1111/risa.13548
- Bürkner, P.C., 2017. Brms: an R package for bayesian multilevel models using stan. Journal of Statistical Software, 80 (1). doi:10.18637/jss.v080.i01
- Carpenter, B., et al., 2017. Stan: a probabilistic programming language. Journal of Statistical Software, 76 (1). doi:10.18637/jss.v076.i01.
- Ciullo, A., et al., 2017. Socio-hydrological modelling of flood-risk dynamics: comparing the resilience of green and technological systems. Hydrological Sciences Journal, 62 (6), 880–891. doi:10.1080/02626667.2016.1273527
- Coates, G., et al., 2014. Agent-based modelling and inundation prediction to enable the identification of businesses affected by flooding. WIT Transactions on Ecology and the Environment, 184, 13–22. doi:10.2495/FRIAR140021
- Coates, G., et al., 2019. Agent-based modeling and simulation to assess flood preparedness and recovery of manufacturing small and medium-sized enterprises. Engineering Applications of Artificial Intelligence, 78 (November 2018), 195–217. doi:10.1016/j.engappai.2018.11.010
- Delignette-Muller, M.L. and Dutang, C., 2015. fitdistrplus : an R package for fitting distributions. Journal of Statistical Software, 64 (4), 1–34. doi:10.18637/jss.v064.i04
- Devkota, R., et al., 2020. Assessing the past and adapting to future floods: a hydro-social analysis. Climatic Change, 163 (2), 1065–1082. doi:10.1007/s10584-020-02909-w
- Di Baldassarre, G., et al., 2013. Socio-hydrology: conceptualising human-flood interactions. Hydrology and Earth System Sciences, 17 (8), 3295–3303. doi:10.5194/hess-17-3295-2013
- Di Baldassarre, G., et al., 2015. Debates-Perspectives on socio-hydrology: capturing feedbacks between physical and social processes. Water Resources Research, 51 (6), 4770–4781. doi:10.1002/2014WR016416
- Di Baldassarre, G., et al., 2017. Drought and flood in the anthropocene: feedback mechanisms in reservoir operation. Earth System Dynamics, 8 (1), 225–233. doi:10.5194/esd-8-225-2017
- Eurostat, 2008. NACE Rev. 2 – Statistical classification of economic activities in the European Community. Luxembourg, Office for Official Publications of the European Communities. Available from: https://ec.europa.eu/eurostat/web/products-manuals-and-guidelines/-/ks-ra-07-015 [Accessed 24 July 2022].
- Federal Dam Operation Authority of Saxony, 2013. Neue Hochwasserschutzanlagen retten Dresden [online]. Available from: https://www.medienservice.sachsen.de/medien/news/184938 [Accessed 24 July 2022].
- Ferrari, S. and Cribari-Neto, F., 2004. Beta regression for modelling rates and proportions. Journal of Applied Statistics, 31 (7), 799–815. doi:10.1080/0266476042000214501
- Gabry, J., et al., 2019. Visualization in Bayesian workflow. Journal of the Royal Statistical Society: Series A (Statistics in Society), 182 (2), 389–402. doi:10.1111/rssa.12378
- Gelman, A., et al., 2013. Bayesian data analysis. 3rd. Chapman and Hall/CRC. doi:10.1201/b16018 [Accessed 24 July 2022].
- Gelman, A., et al., 2020. Bayesian Workflow. Available from: http://arxiv.org/abs/2011.01808 [Accessed 24 July 2022].
- Gerl, T., et al., 2016. A review of flood loss models as basis for harmonization and benchmarking. PLOS ONE, 11 (7), e0159791. doi:10.1371/journal.pone.0159791
- German Federal Institute of Hydrology (BfG), 2021. Global Runoff Data Centre [online]. Available from: https://www.bafg.de/GRDC/ [Accessed 24 July 2022].
- GFZ German Research Centre for Geosciences, 2021. HOWAS21. 10.1594/GFZ.SDDB.HOWAS21.
- Gneiting, T. and Katzfuss, M., 2014. Probabilistic Forecasting. Annual Review of Statistics and Its Application, 1 (1), 125–151. doi:10.1146/annurev-statistics-062713-085831
- Grames, J., et al., 2016. Modeling the interaction between flooding events and economic growth. Ecological Economics, 129, 193–209. doi:10.1016/j.ecolecon.2016.06.014
- Grothmann, T. and Reusswig, F., 2006. People at risk of flooding: why some residents take precautionary action while others do not. Natural Hazards, 38 (1–2), 101–120. doi:10.1007/s11069-005-8604-6
- Gruner, T., 2012. WebGIS-basierte Visualisierung der Flächennutzungsentwicklung der Stadtregion Dresden auf Grundlage von MapServer. HTW Dresden. Available from: http://maps.ioer.de/FNDD2/ [Accessed 24 July 2022].
- Haeffner, M. and Hellman, D., 2020. The social geometry of collaborative flood risk management: a hydrosocial case study of Tillamook County, Oregon. Natural Hazards, 103 (3), 3303–3325. doi:10.1007/s11069-020-04131-4
- Haer, T., et al., 2017. Integrating household risk mitigation behavior in flood risk analysis: an agent-based model approach. Risk Analysis, 37 (10), 1977–1992. doi:10.1111/risa.12740
- Haer, T., Botzen, W.J.W., and Aerts, J.C.J.H., 2019. Advancing disaster policies by integrating dynamic adaptive behaviour in risk assessments using an agent-based modelling approach. Environmental Research Letters, 14 (4), 044022. doi:10.1088/1748-9326/ab0770
- Haer, T., et al., 2020. The safe development paradox: an agent-based model for flood risk under climate change in the European Union. Global Environmental Change, 60 (December 2018), 102009. doi:10.1016/j.gloenvcha.2019.102009
- Hasanzadeh Nafari, R., Ngo, T., and Mendis, P., 2016. An assessment of the effectiveness of tree-based models for multi-variate flood damage assessment in Australia. Water, 8 (7), 282. doi:10.3390/w8070282
- Hipsey, M.R., et al., 2015. Predicting the resilience and recovery of aquatic systems: a framework for model evolution within environmental observatories. Water Resources Research, 51 (9), 7023–7043. doi:10.1002/2015WR017175
- Hoffman, M.D. and Gelman, A., 2014. The no-u-turn sampler: adaptively setting path lengths in hamiltonian monte carlo. Journal of Machine Learning Research, 15, 1593–1623. Available from: https://jmlr.org/papers/v15/hoffman14a.html [Accessed 24 July 2022].
- Hosking, J.R.M., 1990. L-Moments: analysis and estimation of distributions using linear combinations of order statistics. Journal of the Royal Statistical Society: Series B (Methodological), 52 (1), 105–124. doi:10.1111/j.2517-6161.1990.tb01775.x
- Ishtiaque, A., Sangwan, N., and Yu, D.J., 2017. Robust-yet-fragile nature of partly engineered social-ecological systems: a case study of coastal Bangladesh. Ecology and Society, 22 (3). doi:10.5751/ES-09186-220305
- Jehmlich, C., Hudson, P., and Thieken, A.H., 2020. Short contribution on adaptive behaviour of flood-prone companies: a pilot study of Dresden-Laubegast, Germany. Journal of Flood Risk Management, 13 (4), 1–7. doi:10.1111/jfr3.12653
- Jordan, A., Krüger, F., and Lerch, S., 2019. Evaluating probabilistic forecasts with scoringRules. Journal of Statistical Software, 90 (12). doi:10.18637/jss.v090.i12.
- Kienzler, S., et al., 2015. After the extreme flood in 2002: changes in preparedness, response and recovery of flood-affected residents in Germany between 2005 and 2011. Natural Hazards and Earth System Sciences, 15 (3), 505–526. doi:10.5194/nhess-15-505–2015.
- Kreibich, H., et al., 2005. Flood loss reduction of private households due to building precautionary measures – lessons learned from the Elbe flood in August 2002. Natural Hazards and Earth System Sciences, 5 (1), 117–126. doi:10.5194/nhess-5-117–2005.
- Kreibich, H., et al., 2007. Flood precaution of companies and their ability to cope with the flood in August 2002 in Saxony, Germany. Water Resources Research, 43 (3), 1–15. doi:10.1029/2005WR004691
- Kreibich, H. and Thieken, A.H., 2009. Coping with floods in the city of Dresden, Germany. Natural Hazards, 51 (3), 423–436. doi:10.1007/s11069-007-9200-8
- Kreibich, H., et al., 2010. Development of FLEMOcs – a new model for the estimation of flood losses in the commercial sector. Hydrological Sciences Journal, 55 (8), 1302–1314. doi:10.1080/02626667.2010.529815
- Kreibich, H., et al., 2017. Adaptation to flood risk: results of international paired flood event studies. Earth’s Future, 5 (10), 953–965. doi:10.1002/2017EF000606
- Kron, W., 2005. Flood Risk = Hazard • Values • Vulnerability. Water International, 30 (1), 58–68. doi:10.1080/02508060508691837
- Krüger, F., et al., 2016. Predictive Inference Based on Markov Chain Monte Carlo Output, 23–24. Available from: http://arxiv.org/abs/1608.06802 [Accessed 24 July 2022].
- Li, C. and Coates, G., 2016. Design and development of an agent-based model for business operations faced with flood disruption. International Journal of Design & Nature and Ecodynamics, 11 (2), 97–106. 10.2495/DNE-V11-N2-97–106.
- Maier, M.J., 2014. DirichletReg: Dirichlet Regression for Compositional Data in R. Available from: http://epub.wu.ac.at/4077/ [Accessed 24 July 2022].
- Marks, D., 2019. Assembling the 2011 Thailand floods: protecting farmers and inundating high-value industrial estates in a fragmented hydro-social territory. Political Geography, 68 (August 2017), 66–76. doi:10.1016/j.polgeo.2018.10.002
- Matheson, J.E. and Winkler, R.L., 1976. Scoring rules for continuous probability distributions. Management Science, 22 (10), 1087–1096. doi:10.1287/mnsc.22.10.1087
- McElreath, R., 2018. Statistical rethinking. Boca Raton, FL: Chapman and Hall/CRC. doi:10.1201/9781315372495
- Merz, B., et al., 2010a. Fluvial flood risk management in a changing world. Natural Hazards and Earth System Science, 10 (3), 509–527. doi:10.5194/nhess-10-509-2010
- Merz, B., et al., 2010b. Review article ‘Assessment of economic flood damage’. Natural Hazards and Earth System Science, 10 (8), 1697–1724. doi:10.5194/nhess-10-1697-2010
- Merz, B., et al., 2015. Charting unknown waters-On the role of surprise in flood risk assessment and management. Water Resources Research, 51 (8), 6399–6416. doi:10.1002/2015WR017464
- O’Connell, P.E. and O’Donnell, G., 2014. Towards modelling flood protection investment as a coupled human and natural system. Hydrology and Earth System Sciences, 18 (1), 155–171. doi:10.5194/hess-18-155-2014
- Ospina, R. and Ferrari, S.L.P., 2010. Inflated beta distributions. Statistical Papers, 51 (1), 111–126. doi:10.1007/s00362-008-0125-4
- Paprotny, D., Morales-Nápoles, O., and Jonkman, S.N., 2018. HANZE: a pan-European database of exposure to natural hazards and damaging historical floods since 1870. Earth System Science Data, 10 (1), 565–581. doi:10.5194/essd-10-565-2018
- Paprotny, D., et al., 2020. Exposure and vulnerability estimation for modelling flood losses to commercial assets in Europe. Science of the Total Environment, 737, 140011. doi:10.1016/j.scitotenv.2020.140011
- Pohl, R., 2004. Historische Hochwasser aus dem Erzgebirge: von der Gottleuba bis zur Mulde. Dresden: Technische Universität Dresden, Institut für Wasserbau und Technische Hydromechanik.
- Ridolfi, E., Albrecht, F., and Di Baldassarre, G., 2020. Exploring the role of risk perception in influencing flood losses over time. Hydrological Sciences Journal, 65 (1), 12–20. doi:10.1080/02626667.2019.1677907
- Ridolfi, E., Mondino, E., and Di Baldassarre, G., 2021. Hydrological risk: modeling flood memory and human proximity to rivers. Hydrology Research, 52 (1), 241–252. doi:10.2166/nh.2020.195
- Rosina, K., et al., 2020. Increasing the detail of European land use/cover data by combining heterogeneous data sets. International Journal of Digital Earth, 13 (5), 602–626. doi:10.1080/17538947.2018.1550119
- Ross, A. and Chang, H., 2020. Socio-hydrology with hydrosocial theory: two sides of the same coin? Hydrological Sciences Journal, 65 (9), 1443–1457. doi:10.1080/02626667.2020.1761023
- Rözer, V., et al., 2019. Probabilistic models significantly reduce uncertainty in hurricane harvey pluvial flood loss estimates. Earth’s Future, 7 (4), 384–394. doi:10.1029/2018EF001074
- Saxonian Environmental Agency, 2012. Flood Hazard Maps for Saxony [Dataset] [online]. Available from: https://www.wasser.sachsen.de/hochwassergefahrenkarte-11915.html [Accessed 24 July 2022].
- Saxonian Relief Bank, 2007. SAB-Förderbericht 2006 − Wirtschaft, Technologie, Arbeit. Dresden. Available from: https://www.sab.sachsen.de/publikationen/förderbericht/förderbericht-2006.pdf [Accessed 24 July 2022].
- Schoppa, L., et al., 2020. Probabilistic flood loss models for companies. Water Resources Research, 56 (9). doi:10.1029/2020WR027649
- Sennhenn-Reulen, H., 2018. Bayesian regression for a dirichlet distributed response using stan. arXiv, 1, 1–13. Available from: http://arxiv.org/abs/1808.06399 [Accessed 24 July 2022]
- Sieg, T., et al., 2017. Tree-based flood damage modeling of companies: damage processes and model performance. Water Resources Research, 53 (7), 6050–6068. doi:10.1002/2017WR020784
- Sieg, T., et al., 2019. Seamless estimation of hydrometeorological risk across spatial scales. Earth’s Future, 7 (5). doi:10.1029/2018EF001122
- Sivapalan, M., Savenije, H.H.G., and Blöschl, G., 2012. Socio-hydrology: a new science of people and water. Hydrological Processes, 26 (8), 1270–1276. doi:10.1002/hyp.8426
- Sivapalan, M., et al., 2014. Socio‐hydrology: use‐inspired water sustainability science for the Anthropocene. Earth’s Future, 2 (4), 225–230. doi:10.1002/2013ef000164
- Sivapalan, M. and Blöschl, G., 2015. Time scale interactions and the coevolution of humans and water. Water Resources Research, 51 (9), 6988–7022. doi:10.1002/2015WR017896
- Song, S., Chen, H., and Wang, Y., 2021. Improving representation of collective memory in socio- hydrological models and new insights into flood risk management. Journal of Flood Risk Management, 14 (1), 1–12. doi:10.1111/jfr3.12679.
- Srinivasan, V., et al., 2017. Prediction in a socio-hydrological world. Hydrological Sciences Journal, 62 (3), 338–345. doi:10.1080/02626667.2016.1253844
- Thieken, A.H., et al., 2007. Coping with floods: preparedness, response and recovery of flood-affected residents in Germany in 2002. Hydrological Sciences Journal, 52 (5), 1016–1037. doi:10.1623/hysj.52.5.1016
- Thieken, A.H., et al., 2016. The flood of June 2013 in Germany: how much do we know about its impacts? Natural Hazards and Earth System Sciences, 16 (6), 1519–1540. doi:10.5194/nhess-16-1519-2016
- Thompson, S.E., et al., 2013. Developing predictive insight into changing water systems: use-inspired hydrologic science for the anthropocene. Hydrology and Earth System Sciences, 17 (12), 5013–5039. doi:10.5194/hess-17-5013-2013
- van de Schoot, R., et al., 2021. Bayesian statistics and modelling. Nature Reviews Methods Primers, 1 (1), 1. doi:10.1038/s43586-020-00001-2
- Viglione, A., et al., 2014. Insights from socio-hydrology modelling on dealing with flood risk - Roles of collective memory, risk-taking attitude and trust. Journal of Hydrology, 518 (PA), 71–82. doi:10.1016/j.jhydrol.2014.01.018
- Vogel, K., et al., 2018. Identifying driving factors in flood-damaging processes using graphical models. Water Resources Research, 54 (11), 8864–8889. doi:10.1029/2018WR022858
- Wagenaar, D., De Jong, J., and Bouwer, L.M., 2017. Multi-variable flood damage modelling with limited data using supervised learning approaches. Natural Hazards and Earth System Sciences, 17 (9), 1683–1696. doi:10.5194/nhess-17-1683-2017
- Wedawatta, G. and Ingirige, B., 2012. Resilience and adaptation of small and medium-sized enterprises to flood risk. Disaster Prevention and Management: An International Journal, 21 (4), 474–488. doi:10.1108/09653561211256170
- Wedawatta, G., Ingirige, B., and Proverbs, D., 2014. Small businesses and flood impacts: the case of the 2009 flood event in Cockermouth. Journal of Flood Risk Management, 7 (1), 42–53. doi:10.1111/jfr3.12031
- Weikinn, C., 2000. Quellentexte zur Witterungsgeschichte Europas von der Zeitwende bis zum Jahr 1850 - Hydrographie Band 1, Teil 5 (1751-1800). Stuttgart, Germany, Schweizerbart Science Publishers. Available from: http://www.schweizerbart.de//publications/detail/isbn/9783443010447/Weikinn%5C_Quellentexte%5C_zur%5C_Witterungsgesc [Accessed 24 July 2022].
- Weikinn, C., 2002. Quellentexte zur Witterungsgeschichte Europas von der Zeitwende bis zum Jahr 1850 - Hydrographie Band 1, Teil 6 (1801-1850). Stuttgart, Germany, Schweizerbart Science Publishers. Available from: http://www.schweizerbart.de//publications/detail/isbn/9783443010478/Weikinn%5C_Quellentexte%5C_zur%5C_Witterungsgesc [Accessed 24 July 2022].
- Wing, O.E.J., et al., 2020. New insights into US flood vulnerability revealed from flood insurance big data. Nature Communications, 11 (1), 1–10. doi:10.1038/s41467-020-15264-2
- Yu, D.J., et al., 2017. Incorporating institutions and collective action into a sociohydrological model of flood resilience. Water Resources Research, 53 (2), 1336–1353. doi:10.1002/2016WR019746