
 ?Mathematical formulae have been encoded as MathML and are displayed in this HTML version using MathJax in order to improve their display. Uncheck the box to turn MathJax off. This feature requires Javascript. Click on a formula to zoom.
ABSTRACT
In this study, we explore the utility of stable isotopes of water (δ2H and δ18O) as integrative proxies for evaporative condition in high-mountain tropical lakes using a set of small Ecuadorian lakes in the Cajas National Park. Specifically, we (1) characterize the variability of stable water isotopic composition across several lakes of varying size and depth and (2) determine the evaporation as a fraction of inflow using stable isotopes of water for these lakes. We have used the Hydrocalculator tool for estimation of the evaporation to inflow (E/I) ratio. Results indicated that larger lakes have lower seasonal variability in isotopic composition across their depth compared with the smaller lakes. Further, there was clear seasonal variation across the monthly E/I ratios estimated in several lakes, indicating that evaporation likely plays some (albeit limited) role in the water level variability experienced within a year.
Editor S. Archfield; Associate Editor G. Jeelani
1. Introduction
High-mountain lakes are important globally as they sustain water flows to downstream communities while at the same time providing unique habitats and potential refugia for species. High-mountain lakes also provide excellent records of climatic change impacts as they are literal surface manifestations of groundwater supply at the very top of the terrestrial portion of the water cycle in the headwaters of watersheds. As such, it is important to understand what controls the seasonal variations in water levels in high-elevation lakes and how high-elevation lakes modulate hydrological signatures as these ecosystems serve as sentinels of change (Råman Vinnå et al. Citation2021).
The scarcity and discontinuity of long-term, homogeneous hydrological observations, however, make it nearly impossible to determine drivers of lake water level and storage changes worldwide (Alsdorf and Lettenmaier Citation2003, Pontes et al. Citation2017, Yao et al. Citation2018, Woolway et al. Citation2020). Also, as most lakes globally and especially those at high elevation tend to be small (i.e. less than 10 km2 in area), there is an increasing need to develop a full cadre of complementary approaches to monitor and assess hydrological changes (Alsdorf et al. Citation2003, Yao et al. Citation2018) as these are the lakes that are most susceptible to climatic shifts. Mechanistic understanding of how high-mountain lakes and their surrounding landscapes store and release water thus becomes crucial as researchers seek to test climate models regionally and as managers seek to manage ecosystems locally. Without improved mechanistic understanding of surface–groundwater interactions, which likely only comes from strategic investment in improved monitoring of high-mountain lakes, we are at risk of misalignment between our regional estimations into the future as they inform our small-scale recommendations for management.
Nowhere is this need to understand the potential risk of misalignment more visible than across high-mountain tropical lakes, as these regions are likely to experience significant climate-driven impacts on social, economic, and environmental sectors in the near future (Magrin et al. Citation2007, Lyon et al. Citation2022). Specifically, clear warming trends and shifts in seasonal rainfall distributions are anticipated in the tropics over the next century (Neelin et al. Citation2006), bringing about longer periods of drought, earlier baseflow recessions, and increased flood severity (Reyer et al. Citation2017). To this end, recent work across high-mountain tropical lakes has started to explore advanced and complementary techniques for monitoring potential controls on evaporative losses and relative changes in water levels across the region to better support regional modeling development and sustainable water resource management. For example, Palomino-Ángel et al. (Citation2022) utilized remote sensing to detect water level changes in 24 small lakes across Ecuador’s Cajas Massif Lake system. They found that in general lake water level changes were consistent with precipitation patterns in the region; however, this relationship potentially breaks down seasonally and as a function of lake area as the dominant controls on surface–groundwater interactions shift. Esquivel-Hernández et al. (Citation2018) used stable isotopes of water and hydrometric observations to constrain water balance and evaporation loss estimates for tropical glacial lakes located in the highlands of Chirripó, Costa Rica. They recommend their framework utilizing targeted monitoring of stable isotopes of water to provide baseline information for future hydro‐climate assessments in high‐mountain regions of the tropics.
Usage of stable isotopes of water (δ2H and δ18O) as integrative proxies of the lake water balance (Vystavna et al. Citation2021) has grown in popularity over recent decades as the costs of isotopic analysis continue to decrease (Lyon et al. Citation2009) and the understanding of controls on isotopic variability continues to increase (Sánchez-Murillo et al. Citation2020). Comparing, for example, isotopic composition of lake water to local meteoric water lines (LMWLs) has been shown to provide information about hydrological conditions and seasonal changes in lake water balances (Jasechko et al. Citation2014, Biggs et al. Citation2015, Gibson et al. Citation2016). Further, approaches comparing inflow and outflow isotopic variability to assess evaporative losses and to isolate possible controls – similar to what was done and recommended for high-mountain tropical lakes in Esquivel-Hernández et al. (Citation2018) – have gained increased attention recently (Vystavna et al. Citation2021). Looking specifically at tropical regions, comparative efforts from Esquivel-Hernández et al. (Citation2018) and Michelutti et al. (Citation2022) underscore the potential of stable isotopes of water in this regard especially as we look for mechanistic differences that control lake level variations at regional and local scales.
In this study, thus, we seek to explore the utility of stable isotopes of water for assessing evaporation to inflow (E/I) ratios and characterizing how evaporation can modulate the isotope signal of lake water within high-mountain tropical lakes, using a set of small Ecuadorian lakes located in the Cajas Massif Lake system. Previous work in the Cajas Massif Lake system by Michelutti et al. (Citation2022) suggests that the influence of evaporation on hydrological and isotopic mass balances of lakes in this region is potentially limited given the general wetness and ample rainfall. This suggestion is consistent in general with the connections between precipitation patterns and lake water levels seen by Palomino-Ángel et al. (Citation2022); however, that work found that the dominance of precipitation as a control on water levels tended to be weaker for smaller lakes in the region relative to the larger lakes. We seek to test this deterioration in the precipitation control on lake levels in the Cajas Massif Lake system by exploring the relative strength of the evaporative forcing through the year using an inflow and outflow isotopic composition variability approach similar to that recommended by Esquivel-Hernández et al. (Citation2018). Specifically, we (1) characterize the variability of stable water isotopic composition across several lakes of varying size and depth and (2) determine the evaporation as a fraction of inflow using stable isotopes of water for these lakes.
2. Methods
2.1. Site description
The Cajas Massif is a large United Nations Educational, Scientific and Cultural Organization (UNESCO) biosphere reserve located in the austral region of Ecuador that contains the Cajas National Park (CNP). In this area, geomorphological processes occurring in the last glacial period resulted in an exceptionally high density of lakes and ponds, located at more than 3400 m above sea level (a.s.l.), which provide drinking water to nearly 60% of the population of Cuenca, the third largest city in Ecuador. Rainfall occurs throughout the year, typically following a bimodal regime, with wet periods from February to April and October to November and rain falling primarily as a constant drizzle (80% duration) with only about 12% dry days per year. The mean annual precipitation in the Cajas Massif ranges from 900 to 1400 mm (Padrón et al. Citation2015). Air temperature shows low seasonal variation, with colder months from June to October. Temperature oscillations can be substantial during daytime, ranging between 6 and 18°C around 3100 m a.s.l, and between 3 and 6°C at about 4000 m (Bandowe et al. Citation2018). As such, the region and the water cycle are not impacted by snow. The primary bedrock is volcanic (Tarqui Formation), including rhyolite, andesite, tuff, pyroclastic, and ignimbrites (Hungerbühler et al. Citation2002). The main soil types at the region are nonallophanic Andosols and Histosols of volcanic origin (Borja and Cisneros Citation2009). Hydrographically, the CNP is a mountain system of which 34% is contributed by the headwaters of the Balao and Cañar river basins, both draining toward the Pacific Ocean, and 66% by the headwaters of the Paute River basin, draining toward the Atlantic Ocean. For more detailed lake morphometry of the CNP and Cajas Massif see Mosquera et al. (Citation2017) and Vázquez et al. (Citation2024). At this elevation, there is no significant infrastructure, and human impacts on the hydrological cycle are negligible.
Eight lakes located in the CNP and two in its surroundings were selected (); the selection was restricted to lakes with an area greater than 1 ha and a maximum depth greater than 10 m. Geographically, they occupy the territories of the Western Cordillera of the South of the Ecuadorian Andes between 2°44’29” and 2°56’23”S and between 79°8’21” and 79°23’3”W (), with an elevation range spanning from 3152 to 4128 m a.s.l., a depth range of 16.5–65.3 m and a size range of 7–77 ha, covering the range of altitudes, sizes and depths existing in this high-mountain tropical lake district ().
Figure 1. Site map showing the positions of the study lakes, relative to the administrative boundary of the Cajas National Park (CNP), which is located near Cuenca city, Ecuador. Black polygons depict other non-sampled lakes that belong to the CNP lake system.
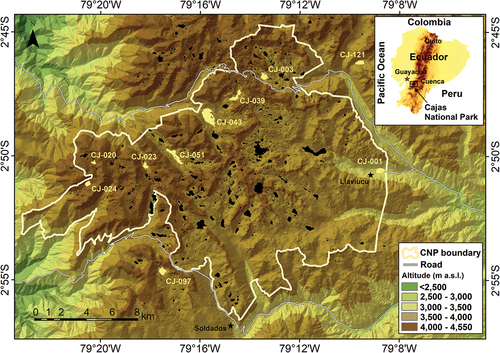
Table 1. Locations and characteristics of the Cajas National Park lakes considered in this study. Codes correspond to the site map ().
Meteorological data were obtained from the Municipal Public Enterprise of Telecommunications, Drinking Water, Sanitation and Environmental Management (ETAPA EP) for the study period (March 2019–March 2020). Data of two meteorological stations, namely Soldados at 3268 m elevation and Llaviuco at 3154 m elevation (), were also used in the study. With regard to the west–east direction, the Soldados station is situated in the south part of the CNP, whilst the Llaviuco station is situated in the eastern side (). The rainfall records for the two stations indicate the same pattern: a drier period extending from the beginning of July until the mid of September ().
Figure 2. Meteorological parameters across the study region showing seasonal patterns by averaging data available from the two stations considered in this study (i.e. Soldados and Llaviuco).
2.2. Lake monitoring
Water levels were continuously monitored in the locations where the maximum depth of the study lakes occurs, using HOBO® Onset U20L-02 water level loggers. At this sampling spot, a buoy was anchored to the bottom of the lake, using a rope and heavy rocks as ballast. The loggers were submerged and attached to the rope connecting the buoy and its anchorage. For every monitored lake, to avoid as much as feasible the effects of some inevitable horizontal and vertical buoy displacements occurring, for instance, because of wind/wave actions and seasonal water level variation, the water level logger was located closer to the lake bottom. In the case of Sunincocha Grande and Luspa, the level sensors did not produce interpretable data, hence we do not present level data for these two lakes. Further, every submerged logger was used in conjunction with a barometric compensation sensor located above the ground in the vicinity of the lake. In addition, water temperatures were measured at different vertical spots ranging from the top of the lake to the bottom. With that purpose in mind, HOBO® Onset Water Temp Pro v. 2 sensors were attached to the referred buoy rope at known distances from the buoy to create a temperature profile with depth for each lake.
The exact vertical location of the water level logger could not be determined for every lake because of the lack of a suitable high-precision surveying device that could be easily transported in the field. Thus, water levels could be surveyed only as historical level fluctuations, relative to the initial water level measured at the beginning of the monitoring period. Water temperature was measured always at the same vertical locations relative to the current water level (i.e. relative to the buoy position).
2.3. Stable water isotope analysis
Sampling campaigns were carried out on a monthly basis (12 per year) in every study lake in the period March 2019–February 2020. The sampling spot was determined by the geographical location of the deepest point. Isotope samples in the lake water column were taken at four depths corresponding to about 100% (lake surface), 75%, 50% and < 5% (lake bottom) of the lake’s relative volume.
A Van Dorn bottle (3 L) was used to collect water samples at different depths, and the isotopic sample was collected direct from the bottle using a sterile syringe. Samples were filtered using 0.45 μm sterile polytetrafluorethylene (PTFE) syringe membranes and collected in 2 mL amber glass vials. Parafilm was used to reduce the effect of evaporation on the water samples. All samples were stored in dark and cool conditions (5°C) until their analysis took place in the lab of the Ohio State University. For the isotopic analysis we used a cavity ring-down spectroscopy water isotope analyzer (Picarro L2130-i). All data were normalized and corrected for drift and memory effects. Stable isotope compositions in this research are reported as delta notations (δ) in ‰ that relate the ratios of 18O/16O and 2H/1H relative to the Vienna Standard Mean Ocean Water (VSMOW)-Standard Light Antarctic Precipitation (SLAP) scale. The analytical long-term error was ± 0.5‰ for δ2H and ± 0.1‰ for δ18O for the isotopic analysis. Water isotopic compositions were also compared in dual isotope space plotting δ2H against δ18O relative to the global meteoric water line (GMWL) defined as δ2H = 8 δ18O + 10‰ from Craig (Citation1961) which does not deviate significantly from the LMWL for the CNP defined as δ2H = 8 δ18O + 10.2‰ from Michelutti et al. (Citation2022). Further, we estimate deuterium excess (d-excess) as a function of δ18O and δ2H as d-excess = δ2H − 8 × δ18O following the standard approach of Dansgaard (Citation1964).
2.4. Estimating evaporation over inflow ratio
The evaporation to inflow ratios (E/I ratios) were estimated using a stable isotope balance approach based on the Craig and Gordon (Citation1965) model as it is considered in the Hydrocalculator developed by Skrzypek et al. (Citation2015). Hydrocalculator allows for (among other things) estimation of evaporative losses of inflow in through-flow pools in a stream, namely the evaporation over inflow (E/I) ratio. For such a calculation, the stable isotope composition of the inflow and the outflow is required to inform the steady-state model. The core assumption here is that under steady-state conditions, a well-mixed through-flow pool is constantly replenished by inflow and the water level remains constant as the evaporative losses from the pool are compensated for by inflow that equals or exceeds evaporation (Skrzypek et al. Citation2015). The steady-state assumption within Hydrocalculator is well suited for systems where lake level changes with time are negligible, as is the case for the lakes considered in this study and many high-elevation lakes. For situations where evaporated lake water is constantly mixing with inflow, proportionally to the lake volume, and the inflow volume and lake volume are typically not known, Hydrocalculator estimates the E/I ratio using the following equation from Skrzypek et al. (Citation2015):
where δL represents the isotopic composition of outflow and δP the isotopic composition of inflow. δ* is the limiting isotope enrichment factor (Gat and Levy Citation1978, Gat Citation1981) and m is the enrichment slope (Welhan and Fritz Citation1977, Allison and Leaney Citation1982). Relevant for the region and to help provide some context here for these parameters, Mayr et al. (Citation2007) found δ* = 6.44 and m = 1.64 for Laguna Azul of Patagonia in Argentina.
As originally developed in Skrzypek et al. (Citation2015) and later explored extensively in studies such as Esquivel-Hernández et al. (Citation2018), here we focus on the application of Hydrocalculator as a tool for characterizing and comparing across the isotopic data we had available for the study site. Nevertheless, as our original experimental design targeted isotopic variability in lakes across CNP, we did not have observations or estimations of several of the factors utilized in Hydrocalculator, which precluded an in-depth assessment similar to that done, for instance, by Esquivel-Hernández et al. (Citation2018). Observed monthly inflow and outflow water isotopic compositions for each study lake were fed into the Hydrocalculator tool. For lakes with more than one inflow, we averaged across the isotopic compositions available for each month to provide one characteristic inflow signature for every lake. Such a non-weighted averaging of inflow isotopic composition may limit our approach as it could over-weight smaller inflow volumes that have higher evaporative signatures but smaller impact on actual lake volume turnover. Atmospheric conditions, namely relative humidity and temperature, were taken from the nearby meteorological stations and averaged for each month considered. As our current study did not directly measure isotopic composition of precipitation for the region, we adopted long-term monthly precipitation isotopic composition patterns from publicly available records maintained by the International Atomic Energy Agency (IAEA), namely the Global Network of Isotopes in Precipitation (GNIP) database for the nearby monitoring station located in Cuenca, Ecuador. These monthly precipitation isotopic composition patterns thus only allowed us to approximate the variability from month to month rather than isolate real differences in precipitation isotopic composition. As such, lapse rate variation or impacts on precipitation isotopic composition patterns between the original monitoring location and the study site were not considered in our analysis. As we assumed constant monthly precipitation isotopic composition patterns across all the study lakes, the limitation or potential error incurred by this data limitation is minimized and assumed to be relatively constant across all individual lake E/I ratios.
3. Results
3.1. Lake temperature and water levels
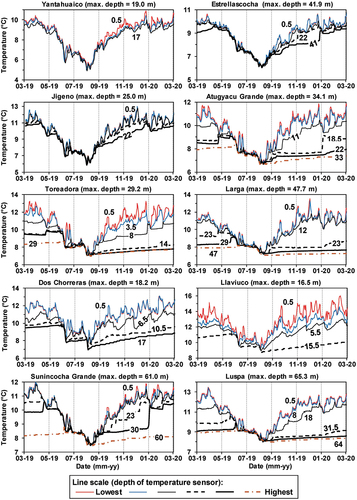
Lakes showed clear variation in temperature across the sampling year (). Stratification developed over the year in most of the lakes with a small mixing period from mid July to end September. Most notably, Yantahuaico and Jigeno, the two lakes with the highest altitude (and, relatively, shallower depths), showed no evidence of thermal stratification. Further, most lakes showing thermal stratification had rather warm surface waters (higher than 12°C) for part of the year (e.g. April and May) and rather cool surface waters (lower than 8°C) for other part of the year (e.g. August and September).
Figure 3. Lake temperatures observed across the depth profiles for the study lakes in the period March 2019–March 2020.
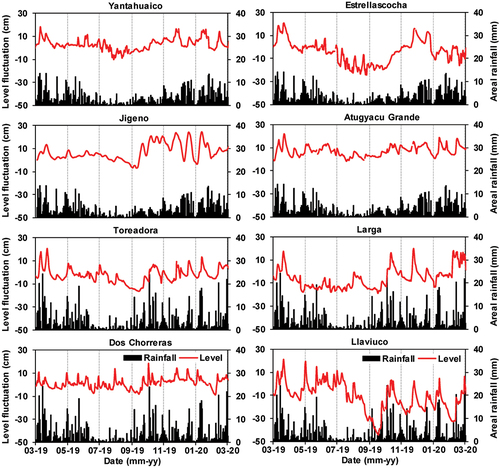
In general, lake water levels () showed responses to large rainfall events (both peaks and dry periods). It should be noted that water levels are not available for Luspa and Sunincocha Grande as our sensors ruptured/failed in these lakes and, thus, could not record data. In general, lake levels decreased from March through about September and increased from September through the end of the sampling year; however, these trends were weak relative to the fluctuation in lake levels in response to rain events. It is remarkable that some of the highest water level fluctuation occurred in Llaviuco, a lake whose outlet is formed by a non-operated gate that is unmaintained. These fluctuations were driven by leaking and other uncontrolled outflow, which has been witnessed throughout past and recent visits to the lake outlet. Regardless, lake level changes observed were, overall, rather moderate relative to the total depths and sizes of the lakes considered ().
Figure 4. Daily fluctuation of lake water level, expressed as a difference with regard to the initial water level, for the study lakes in the period March of 2019 – March of 2020. Areal rainfalls observed at nearest available weather stations are provided for context.
3.2. Variability in stable water isotopic composition
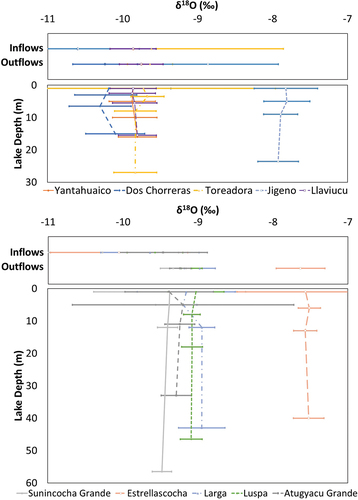
The larger lakes () had lower variability in isotopic composition as seen through the standard deviation in isotopic composition across their depth over the sampling year compared with the smaller lakes (). Further, average lake water isotopic composition tended to be more similar to lake outflow isotopic composition than lake inflow isotopic composition. This was also the case for the standard deviation in isotopic composition, as the respective variabilities of isotopic composition of lake and outflow of the study lakes were consistently similar and significantly lower than the respective variability of inflow water. These same general patterns hold for d-excess estimates across the lakes (). Across all samples, isotopic composition expressed as δ18O related directly to isotopic composition expressed as δ2H. Given the redundancy in the information provided by these two isotopes for our samples, we report on results for δ18O when possible in the following rather than presenting duplicate results for both isotopic compositions.
Table 2. Summary statistics for isotopic compositions (δ2H and δ18O) analyzed and d-excess values computed across the lakes of the Cajas National Park (CNP) considered in this study.
Lakes sampled in this study held consistent isotopic composition across depth profiles (). Looking at averages for isotopic composition (e.g. δ18O), observed values in lake outflows follow those observed across lake depth profiles. This agreement between outflowing isotopic composition and lake water isotopic composition seems to be the best when considering the water at the lake’s surface (); however, there are notable exceptions, as for Jigeno. Counter to this isotopic consistency between lake water and outflowing water, inflowing waters were different than waters in lakes across all levels in the lake.
Figure 5. Average annual isotopic compositions (δ18O) across all monthly samples available at each depth profile into the study lakes relative to their inflowing and outflowing waters with error bars indicating standard deviation across compositions. Note: to increase clarity in the figure, the errors bars go slightly beyond the axis extents, and lakes have been grouped by depth.
Isotopic compositions sampled in inflows to the lakes showed limited consistent evidence of evaporation and clustered around the GMWL in dual isotope spaces (). Lake outflow isotopic composition had a more substantive and consistent offset from the GMWL; however, the slopes connected with these outflow samples in the space do not appear to be very different than that of the GMWL, which could indicate source water mixing. In general, there was considerable spread in the inflow water isotopic composition relative to that seen in the outflow water. Such a spread in isotopic composition could reflect the variations in source waters – namely precipitation, groundwater, and other lake water contributions – from across a lake’s given watershed that drive lake inflows across the season. Further, as lakes often had multiple inflows () that were independently sampled, these inflows integrate different source waters across the landscape, leading to the spread in dual isotope space. There was noticeable deviation from the GMWL for several samples collected in the inlet to Toreadora, which could indicate an impact of evaporation on these samples. Given the consistency of the other lake inflows, this systematic deviation could indicate evaporation that occurred post sampling and may not necessarily be reflective of processes occurring in the landscape.
Figure 6. Dual isotope space for monthly isotopic compositions (δ2H and δ18O) for (a) inflowing waters; (b) lakes across all depths; and (c) outflowing waters, for all lakes considered in this study, with the global meteoric water line (GMWL) for reference. Note: to increase clarity in the figure, zoomed-in plots (right) accompany each full-extent figure (left).
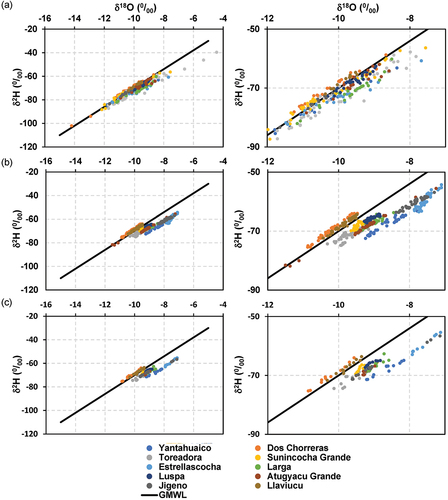
Considering the lake water itself across the depths in dual isotope space, as with the outflow waters, clearer and consistent separation from the GMWL and the isotopic composition was observed for many of the lakes (). Despite seasonal variation, the isotopic composition of lake water samples tended to not spread as much as the inflow water isotopic compositions in dual isotope space, which would be expected.
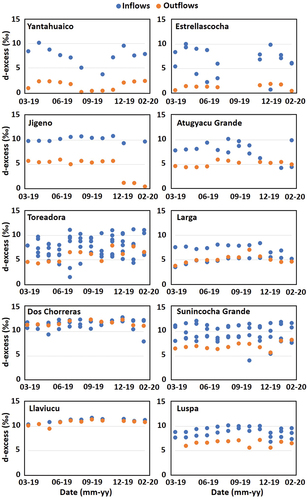
Looking temporally at the lake inflow waters relative to the lake outflow waters, there were evident seasonal patterns in isotopic composition () and d-excess () of both flows. Typically, outflow waters were more enriched and had lower d-excess values relative to inflow waters despite the inherent spread in inflow composition due to multiple inflows for each lake. Collectively, the lakes and subsequent outflow waters appear to be enriched in isotopes, which is consistent with global theory around evaporation in lakes presented in Vystavna et al. (Citation2021).
Figure 7. Monthly variation in isotopic composition (δ18O) for inflowing and outflowing waters for each of the study lakes. Note: several lakes have multiple inflowing waters (see ).
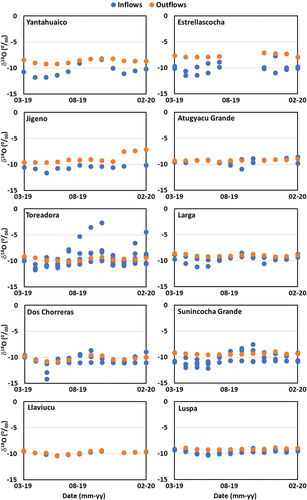
Figure 8. Monthly variation in d-excess for inflowing and outflowing waters for each of the study lakes. Note: several lakes have multiple inflowing waters (see ), and negative d-excess values (five in total) for Toreadora are omitted in these plots.
3.3. Evaporation as a fraction of inflow
There was clear seasonal variation across the E/I ratio estimated for the study lakes (). For the 1-year study period, the E/I ratio was highest in the March through May period and lowest in the August through October period (). A second (moderate) E/I “peak” was observed in the November through December period. The variability of the E/I ratio among the study lakes, represented by the respective standard deviation of E/I estimates, was higher during the E/I peak periods and lower for low average E/I ratio values ().
Figure 9. Monthly variation in evaporation to inflow (E/I) ratio for each of the study lakes.
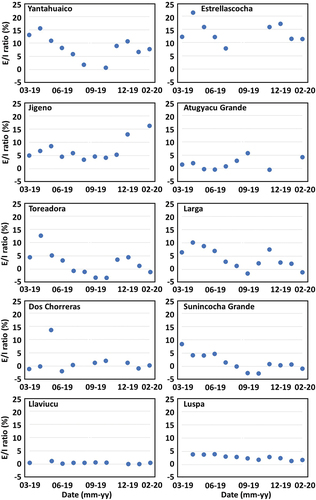
Figure 10. Temporal distribution of the average monthly evaporation to inflow (E/I) ratio calculated across all study lakes, with vertical bars representing the variability of the E/I ratio among the study lakes (i.e. the standard deviation of the E/I ratio).
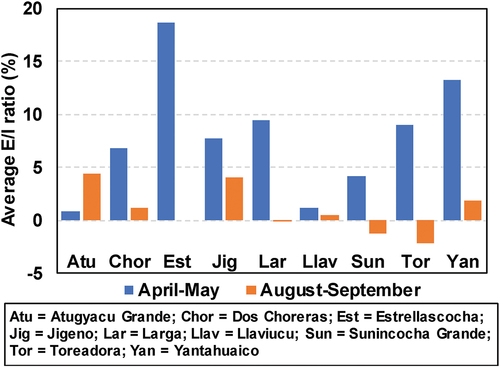
We can use this seasonal pattern in the E/I ratio in combination with observations of lake temperatures () to assess relative differences in E/I ratio between the warmer and cooler periods of the year. These periods were not selected on the basis of rainfall as there is minimal difference in monthly precipitation across the year given the general wetness of the region (Padrón et al. Citation2015). As lake surface temperatures tended to peak in April and May and were lowest in August and September, we can pull these months out as examples of E/I ratio variation over the seasons in the CNP (). Looking across the responses of the individual lakes, there is clear variability in average E/I ratio and values tend to be higher during the warm lake period (April through May) than during the cool lake period (August through September). Note that Estrellascocha did not have isotopic data available for the August through September period of the year, so no E/I ratio estimate could be made for that station. Compared with the results from Esquivel-Hernández et al. (Citation2018), the E/I ratio values estimated during the warm lake period are similar in magnitude to the values estimated during the dry season for lakes in Costa Rica, while the E/I ratio values estimated during the cool lake periods are similar to those estimated for lakes in Costa Rica during the wet period. This consistency lends some credence to the E/I ratio estimates for the study lakes considered here despite assumptions around rainfall isotopic variation and other potential limitations of our methodology.
Figure 11. Average evaporation to inflow (E/I) ratio across each study lake for April through May and August through September periods of the year.
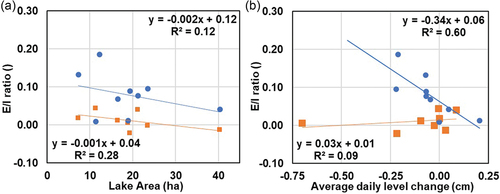
The warm lake (e.g. April through May period) and cool lake (e.g. August through September period) E/I ratio values were compared with properties of the lakes (). Considering lake area for size, there was a general pattern of decreasing E/I ratio for increasing lake area for both the warm and the cool period; however, neither of these linear relationships was statistically significant. Looking at the relationship between E/I ratio and the observed changes in lake levels, we found a significant negative relationship (p < 0.05) between the average daily lake level change and the E/I ratio estimated during the warm lake period but no significant relationship between lake level changes and E/I ratio during the cool period (). Collectively, these results indicate that during the warm lake period lakes exhibiting larger average daily decreases in water levels also exhibited higher E/I ratio values estimated from isotopic composition, while this relationship does not hold during the cooler lake period.
Figure 12. Relationship between average evaporation to inflow (E/I) ratio for the April through May and August through September periods for each lake against (a) lake area and (b) average daily lake change in the same period.
Regressing the E/I ratio values against available meteorological data for the region () showed that while there are some potential relationships there is not an emergent pattern whereby atmospheric forcing clearly drives E/I ratio for these lakes. As such, solar radiation, relative humidity and air temperature in the region all have some relationship (R2 values larger than 0.25) with several of the lake E/I ratio values. What is more interesting perhaps is that rainfall totals and atmospheric pressure had no regressions with R2 values higher than 0.25 for any of the lakes.
Table 3. Regressions between individual monthly lake evaporation to inflow (E/I) ratios (y variable) and various meteorological parameters (x variable).
4. Discussion
4.1. Isotopic observations relative to previous efforts
Looking through the growing literature around isotopes and their use in tropical environments (Sánchez-Murillo et al. Citation2020), our observed isotopic compositions for the lakes surveyed in CNP agree well with both previously reported compositions and variability. For example, Vystavna et al. (Citation2021) reported tropical lake isotopic composition medians being slightly negative with regards to δ18O and ranging down to about −15‰, which covers the range of compositions seen for the CNP lakes (). Further, patterns seen across the study lakes align well in dual isotope space with those reported by Sanchez-Murillo et al. (Citation2020) or Esquivel-Hernández et al. (Citation2022) for Costa Rica, where deviation from meteoric water lines (MWL), along potential local evaporation lines, only occurs, slightly, at extreme levels of enrichment. For the lakes in this study (), the offset isotopic compositions in dual isotope space from the MWL along apparently similar slopes rather than evolution along a lower slope could be more suggestive of source mixing than evaporation in this landscape, which would be consistent with these previous studies. Further, the ranges of isotopic compositions and the d-excess values reported here agree well with those previously observed in the CNP (Michelutti et al. Citation2022).
Given the difficulty faced by researchers trying to characterize isotopic composition across tropical environments, the congruence between our observed data and existing records is promising. Further, the translation of inflowing water variability into outflowing water consistency, with regard to lake water isotopic composition (; ), illustrates the fidelity between outflow sampling approaches and lake-centric sampling strategies. For these lakes and others in the CNP, this consistency between outflowing waters and lake isotopic compositions could help streamline monitoring into the future as studies seek to track seasonal and long-term changes in lake water balances or determine source apportionment for the various river systems.
4.2. Evaporation as a fraction of inflow relative to drivers of water level change
Compared with the remote sensing estimates from Palomino-Ángel et al. (Citation2022), the larger lakes in the current study with well-established stratification (), showing lower variability in isotopic composition across seasons (), were the ones with the highest correlations between precipitation and lake level change estimated with remote sensing. Counter to this, the smaller lakes which had more variability in seasonal isotopic compositions were among those with the lowest correlations between precipitation and water level changes estimated with remote sensing in Palomino-Ángel et al. (Citation2022).
Further for this region, Palomino-Ángel et al. (Citation2022) highlighted that the magnitude of water level change decreases with lake area across CNP since there is a direct relationship between the volume and area in each lake (Mosquera et al. Citation2017). Palomino-Ángel et al. (Citation2022) used this to conclude that precipitation events will yield smaller water level changes for lakes with greater differential volumes. Our results indicate that the deterioration in the precipitation control on lake levels across lake size in the CNP lake system could partially be explained by an increased relative importance of evaporation for part of the year (). For the lakes considered in this study, we found a relationship between E/I ratios and average daily lake level change only during periods when lake surface water temperatures were relatively warm (). Mechanistically, warm surface waters in lakes would support high evaporative rates (Wang et al. Citation2018), which could explain these relationships to some extent; however, we saw inconsistent importance of meteorological factors driving E/I ratios ().
Collectively, our results support that while precipitation drives local variability in water level for the lakes in the Cajas region, as posited by Palomino-Ángel et al. (Citation2022) for the largest and deepest lakes, evaporation appears to play some role for lakes in the region. Still, we did not find a strong relationship between lake area and E/I ratios () but rather a relationship with water temperature (and only during the warmer part of the year). Further, we did not find any clear relationship with lake water volumes (analysis not shown). So, while our results indicate some impacts of evaporation during part of the year for lakes it is of relatively variable importance. This variability is similar to that observed by Esquivel-Hernández et al. (Citation2018) in Costa Rican lakes but different in that the observed variability is not necessarily driven by wet and dry periods (as it was in Esquivel-Hernández et al. (Citation2018)) but rather by lake surface temperature variability and, potentially, atmospheric forcing () in this almost constantly wet landscape.
Of course, there are several limitations here with regards to our analysis and consideration of E/I ratios. For example, we have assumed a steady-state lake system in our application of Hydrocalculator. As such, the change in lake levels observed () may push our analysis toward the limits of the assumptions of Skrzypek et al. (Citation2015) during part of the year. However, the relative lake level fluctuations observed over the entire year () tend to be on the order of 20 to 40 cm and represent at most about 5% of total lake depths for smaller lakes and < 1% for larger lakes. Lakes with larger surface areas could have larger volume changes of water per change in depth relative to those with smaller surface areas. Also, our data indicate that these lakes do become stratified (), but with minimal impact on isotope ratios (), implying these lakes are well mixed at least in the upper zones. Further, we did not monitor precipitation isotopic composition explicitly at CNP, so our study assumed it was constant across the region. Also, we did not utilize spatially interpolated products like those from Bowen and Revenaugh (Citation2003) or Terzer et al. (Citation2013), which allowed us to hold uncertainties constant across our E/I ratio estimates and avoid impacts of the factors driving spatial patterns in the interpolation models. Esquivel-Hernández et al. (Citation2018) saw that estimated E/I ratios were more sensitive to variations in rain isotopic composition than to those in lake isotopic variation. However, as there is minimal elevation variation or differentiation in wind patterns for moisture sources across the region, impacts of adopting a regional rain isotopic composition value are at least consistent across the current study, allowing for comparisons among the resultant E/I ratios.
Further, no independent measurements of evaporation were made in the region to inform the modeling of evaporation lines in the dual isotope space. Again, this limits our use of the E/I ratios in an absolute sense but should have only limited impact on subsequent relative comparisons. Despite this, there were negative estimations of E/I ratio which are non-physical in nature (). The negative E/I ratios, which typically occur when the isotope ratio of the outflow is lighter than the inflow, could indicate a second source of water to the lakes (e.g. groundwater) with a lighter isotope ratio that has not been characterized. These can also be artifacts due to over-representation of inflow waters that are smaller in volume relative to the lake and other inflow values when averaging across isotopic composition (). Future work assessing the collective impacts of all these sources of variability would be interesting to follow up on the current study.
5. Concluding remarks
Given the ability of high-mountain tropical lakes to serve as sentinels for climatic changes, our ability to characterize the relative importance of precipitation and evaporation in driving lake water balances becomes crucial. An emphasis on stable isotopes of water could help drive regional monitoring campaigns into the future as isotopes can offer insights to the seasonal importance of evaporation for high-mountain tropical lakes. Specifically, selective isotopic sampling across high-mountain tropical lakes could help constrain models around variables driving lake water evaporation.
Acknowledgements
The research was carried out within the scope of the project “Análisis de la descomposición de la materia orgánica en ecosistemas acuáticos altoandinos del Austro Ecuatoriano” financed by the Universidad de Cuenca and ETAPA EP. This research was partially supported by a grant from the Office of International Affairs at The Ohio State University, Columbus, Ohio, USA.
Disclosure statement
No potential conflict of interest was reported by the author(s).
Data availability statement
The data that support the findings of this study are available upon reasonable request.
Additional information
Funding
References
- Allison, G.B. and Leaney, F.W., 1982. Estimation of isotopic exchange parameters, using constant-feed pans. Journal of Hydrology, 55 (1), 151–161. doi:10.1016/0022-1694(82)90126-3.
- Alsdorf, D., Lettenmaier, D., and Vörösmarty, C., 2003. The need for global, satellite-based observations of terrestrial surface waters. Eos, Transactions American Geophysical Union, 84 (29), 269–276. doi:10.1029/2003EO290001.
- Alsdorf, D.E. and Lettenmaier, D.P., 2003. Tracking fresh water from space. Science, 301 (5639), 1491–1494. doi:10.1126/science.1089802.
- Bandowe, B.A.M., et al., 2018. A 150-year record of polycyclic aromatic compound (PAC) deposition from high Andean Cajas National Park, southern Ecuador. Science of the Total Environment, 621, 1652–1663. doi:10.1016/j.scitotenv.2017.10.060.
- Biggs, T.W., et al., 2015. Evaporative fractions and elevation effects on stable isotopes of high elevation lakes and streams in arid western Himalaya. Journal of Hydrology, 522, 239–249. doi:10.1016/j.jhydrol.2014.12.023.
- Borja, P. and Cisneros, P., 2009. Estudio Edafológico. Informe del II año del proyecto “Elaboración de la línea base en hidrología de los páramos de Quimsacocha y su área de influencia”. Cuenca: PROMAS, Universidad de Cuenca.
- Bowen, G.J. and Revenaugh, J., 2003. Interpolating the isotopic composition of modern meteoric precipitation. Water Resources Research, 39 (10). doi:10.1029/2003WR002086.
- Craig, H., 1961. Isotopic variation in meteoric waters. Science, 133, 1702–1703. doi:10.1126/science.133.3465.1702
- Craig, H. and Gordon, L.I., 1965. Deuterium and oxygen 18 variations in the ocean and the marine atmosphere. In: E. Tongiorgi, ed. Stable isotopes in oceanographic studies and paleotemperatures. Pisa, Italy: Ric. Lab. di Geol. Nucl., 9–130.
- Dansgaard, W., 1964. Stable isotopes in precipitation. Tellus, 16 (4), 436–468. doi:10.1111/j.2153-3490.1964.tb00181.x.
- Esquivel-Hernández, G., et al., 2018. Insight into the stable isotopic composition of glacial lakes in a tropical alpine ecosystem: chirripó, Costa Rica. Hydrological Processes, 32 (24), 3588–3603. doi:10.1002/hyp.13286.
- Esquivel-Hernández, G., et al., 2022. Water stable isotopes reveal the hydrological response of Costa Rican glacial lakes to climate variability. Journal of South American Earth Sciences, 120, 104091. doi:10.1016/j.jsames.2022.104091.
- Gat, J.R., 1981. Properties of the isotopic species of water: the “isotope effect”. In: J.R. GAT and R. Gonfiantini, eds. Stable isotope hydrology, deuterium and oxygen-18 in the water cycle. Vienna: IAEA, 7–19.
- Gat, J.R. and Levy, Y., 1978. Isotope hydrology of inland sabkhas in the Bardawil area, Sinai. Limnology and Oceanography, 23 (5), 841–850. doi:10.4319/lo.1978.23.5.0841.
- Gibson, J.J., Birks, S.J., and YI, Y., 2016. Stable isotope mass balance of lakes: a contemporary perspective. Quaternary Science Reviews, 131, 316–328. doi:10.1016/j.quascirev.2015.04.013
- Hungerbühler, D., et al., 2002. Neogene stratigraphy and Andean geodynamics of southern Ecuador. Earth-Science Reviews, 57 (1), 75–124. doi:10.1016/S0012-8252(01)00071-X.
- Jasechko, S., GIBSON, J.J., and Edwards, T.W.D., 2014. Stable isotope mass balance of the Laurentian Great Lakes. Journal of Great Lakes Research, 40 (2), 336–346. doi:10.1016/j.jglr.2014.02.020.
- Lyon, S.W., et al., 2022. On the potential of biochar soil amendments as a sustainable water management strategy. Sustainability, 14 (12), 7026. doi:10.3390/su14127026.
- Lyon, S.W., Desilets, S.L.E., and Troch, P.A., 2009. A tale of two isotopes: differences in hydrograph separation for a runoff event when using δD versus δ18O. Hydrological Processes, 23 (14), 2095–2101. doi:10.1002/hyp.7326.
- Magrin, G., et al., 2007. Latin America climate change 2007: impacts, adaptation and vulnerability. In: M.L. Parry, ed. Contribution of working group II to the fourth assessment report of the intergovernmental panel on climate Change. Cambridge, UK: Cambridge University Press, 581–615.
- Mayr, C., et al., 2007. Precipitation origin and evaporation of lakes in semi-arid patagonia (Argentina) inferred from stable isotopes (d18O, d2H). Journal of Hydrology, 334, 53–63. doi:10.1016/j.jhydrol.2006.09.025
- Michelutti, N., et al., 2022. Using Stable Water Isotope Composition (δ18O and δ2H) to track the interannual responses of arctic and tropical andean water bodies to rising air temperatures. Journal of Geophysical Research: Biogeosciences, 127 (4), e2021JG006719. doi:10.1029/2021JG006719.
- Mosquera, P.V., et al., 2017. Abundance and morphometry changes across the high-mountain lake-size gradient in the tropical Andes of Southern Ecuador. Water Resources Research, 53 (8), 7269–7280. doi:10.1002/2017WR020902.
- Neelin, J.D., et al., 2006. Tropical drying trends in global warming models and observations. Proceedings of the National Academy of Sciences, 103 (16), 6110–6115. doi:10.1073/pnas.0601798103.
- Padrón, R.S., et al., 2015. Rainfall in the Andean Páramo: new insights from high-resolution monitoring in Southern Ecuador. Journal of Hydrometeorology, 16 (3), 985–996. doi:10.1175/JHM-D-14-0135.1.
- Palomino-Ángel, S., et al., 2022. Retrieval of simultaneous water-level changes in Small Lakes With InSAR. Geophysical Research Letters, 49 (2), e2021GL095950. doi:10.1029/2021GL095950.
- Pontes, P.R.M., et al., 2017. MGB-IPH model for hydrological and hydraulic simulation of large floodplain river systems coupled with open source GIS. Environmental Modelling and Software, 94, 1–20. doi:10.1016/j.envsoft.2017.03.029.
- Råman Vinnå, L., et al., 2021. The vulnerability of lakes to climate change along an altitudinal gradient. Communications Earth & Environment, 2 (1), 35. doi:10.1038/s43247-021-00106-w.
- Reyer, C.P.O., et al., 2017. Climate change impacts in Latin America and the Caribbean and their implications for development. Regional Environmental Change, 17 (6), 1601–1621. doi:10.1007/s10113-015-0854-6.
- Sánchez-Murillo, R., et al., 2020. Tracing water sources and fluxes in a dynamic tropical environment: from observations to modeling. Frontiers in Earth Science, 8. doi:10.3389/feart.2020.571477.
- Skrzypek, G., et al., 2015. Estimation of evaporative loss based on the stable isotope composition of water using Hydrocalculator. Journal of Hydrology, 523, 781–789. doi:10.1016/j.jhydrol.2015.02.010.
- Terzer, S., et al., 2013. Global isoscapes for δ18O and δ2H in precipitation: improved prediction using regionalized climatic regression models. Hydrology and Earth System Sciences, 17 (11), 4713–4728. doi:10.5194/hess-17-4713-2013.
- Vázquez, R.F., Mosquera, P.V., and Hampel, H., 2024. Bathymetric modelling of high mountain tropical Lakes of Southern Ecuador. Water, 16 (8), 1142. doi:10.3390/w16081142.
- Vystavna, Y., et al., 2021. Stable isotopes in global lakes integrate catchment and climatic controls on evaporation. Nature Communications, 12 (1), 7224. doi:10.1038/s41467-021-27569-x.
- Wang, W., et al., 2018. Global lake evaporation accelerated by changes in surface energy allocation in a warmer climate. Nature Geoscience, 11 (6), 410–414. doi:10.1038/s41561-018-0114-8.
- Welhan, J.A. and FRITZ, P., 1977. Evaporation pan isotopic behavior as an index of isotopic evaporation conditions. Geochimica et Cosmochimica Acta, 41 (5), 682–686. doi:10.1016/0016-7037(77)90306-4.
- Woolway, R.I., et al., 2020. Global lake responses to climate change. Nature Reviews Earth & Environment, 1 (8), 388–403. doi:10.1038/s43017-020-0067-5.
- Yao, F., et al., 2018. Lake storage variation on the endorheic tibetan plateau and its attribution to climate change since the new millennium. Environmental Research Letters, 13 (6), 064011. doi:10.1088/1748-9326/aab5d3.