
 ?Mathematical formulae have been encoded as MathML and are displayed in this HTML version using MathJax in order to improve their display. Uncheck the box to turn MathJax off. This feature requires Javascript. Click on a formula to zoom.
ABSTRACT
Background
Previous research into children’s perceptions of science shows that children like science but often hold stereotypical views of scientists and commonly do not see themselves with a career as a scientist.
Purpose
The aim of this study is to examine if a carefully designed medium-term, teacher-led STEM intervention, ‘Scientist of the Week’ which showcased a diverse range of working scientists and the skills they need, can lead to a positive change in the perception of scientists among young people.
Sample Design and Methods
Using a case-control approach, this research used a tracked sample of 118 young people from aged 7 to 11 in a primary school in the North East of England. Words associated with scientists were collected before and after (directly, one month, one year) the intervention from the tracked sample and analysed to assess changes in stereotypical perceptions and any difference in responses between male and female participants.
Results
Before the intervention, young children held many of the common stereotypes associated with scientists. Shortly afterwards, and one year following the intervention, the use of common stereotypes had fallen significantly across all children, with particular improvements in counter-stereotypical word usage for males. It also found that stereotypical images of scientists as highly intelligent were more difficult to counteract and that many of the positive changes in this view seen in the short term (weeks and months) diminished in the long term (one year later).
Conclusions
This research has shown that with minimal expense and effort from teachers, negative stereotypes of scientists can be reduced through an intervention that does not require bringing scientists into the classroom. Some of the observed changes persisted in the longer-term, suggesting a lasting alteration in children’s perceptions of scientists following the intervention.
Introduction
Equality of access to and participation in STEM (Science, Technology, Engineering and Mathematics), including in STEM careers, is a significant and well-documented societal challenge in the UK and internationally (Greenfield et al. Citation2002; House of Commons Science and Technology Committee Citation2014; Noonan Citation2017), with little change in the demographics of the STEM workforce over recent decades. The STEM workforce – particularly in the physical sciences and engineering – is still predominantly made up of individuals from the same gender, racial and socio-economic groups that it has been for the past 40 years (National Science Foundation Citation2020; Morgan and Kirby Citation2016; Strachan et al. Citation2018; WISE Citation2018). Although different stakeholders (e.g. policymakers, industry, educators) may be motivated by a range of concerns – from national economic competitiveness to social justice, the inequitable patterns in STEM participation are problematic not only in terms of who pursues science careers, but also for wider issues of scientific literacy and engagement with science more broadly.
In order to address these challenges, numerous interventions have been designed and implemented in recent decades (Morgan and Kirby Citation2016). Historically, STEM interventions have been targeted at secondary school pupils. Although these interventions may be well thought out, funded and executed (Vennix, Den Brok, and Taconis Citation2018), they appear to be insufficient to increase the number and diversity of those entering the STEM workforce. In more recent years, an increasing focus has been given to the importance of guidance and interventions aimed at younger children in primary levels of education (Archer et al. Citation2013a; Davenport et al. Citation2020; Morgan and Kirby Citation2016). Our work continues along this trajectory, focusing on the design, implementation and possible outcomes of a stereotype reduction intervention, with particular emphasis on gender, which was aimed at primary school students.
While the effectiveness of interventions focusing on younger children remains an area of research, the seemingly intractable nature of the lack of diversity in the STEM workforce has also spurred efforts to better understand the social and cultural contexts of STEM education (Archer et al. Citation2013a; Osborne, Simon, and Collins Citation2003). Multiple studies on children’s attitudes to science indicate that, from an early age, children like science (Clemence et al. Citation2013; Leonardi et al. Citation2019), but commonly do not see themselves as the sort of person who becomes a scientist (DeWitt and Archer Citation2017; Jenkins and Pell Citation2006; Tan et al. Citation2013). Research also highlights multiple, interacting reasons why this might be the case. For example, children from groups that are under-represented in STEM may be limited in who they know who works in science or STEM, preventing them from seeing science as a real possibility for individuals from their backgrounds (Archer et al. Citation2015; Girl Guides Citation2016). Teachers’ understanding of STEM pathways, and their own biases about the kinds of individuals who pursue science may also limit children’s aspirations and engagement with science (Keller and Whiston Citation2008; Mansour Citation2015; McCarthy Citation2015; Leonardi et al. Citation2019). This limitation is compounded by the emphasis many science curricula place on knowledge and understanding, with little guidance regarding STEM careers (Newton and Newton Citation2011), although this situation in England may be starting to improve with the introduction of a careers strategy by the UK government (Department for Education Citation2017).
Finally, young people and their parents/carers and other key influencers often hold narrow or stereotypical views of STEM and STEM workers (Archer et al. Citation2013b; Koren and Bar Citation2009), which can be communicated to young people, making it difficult for them to see themselves in such occupations. While some of these views, such as those around intelligence, can be regarded as positive, they are also limiting, an issue we explore in more detail in the following section. We also do not argue that everyone should aspire to scientific careers, however, seeing science as ‘not for me’ or scientists as ‘not me’ can act as a barrier to science literacy and engagement across the lifespan, as well as contributing to unequal participation in science careers.
Images of scientists
The studies noted above give a flavour of the research attempting to understand and unpick the reasons young people come to see science as ‘not for me’, highlighting the multifaceted nature of the problem. They also converge on the central role played by images of science and scientists held by young people, their parents/carers and other key influencers play. We now turn to consider these images in more detail, as broadening children’s images of scientists was a key aim of the intervention that forms the focus of our study.
Substantial research suggests that young people, and adults, hold narrow, and often stereotypical, views of scientists and their work. For example, several decades of studies using the Draw-a-Scientist test, reflect that children continue to draw upon a very narrow, heavily stereotyped view of what a scientist is or does (e.g. Chambers Citation1983; Emvalotis and Koutsianou Citation2018; Finson et al. Citation1995Fort and Varney Citation1989; Hillman et al. Citation2014; Matthews and Davies Citation1999Mead and Metreaux Citation1957), and there is some suggestion that this tendency may be stronger for boys than girls (e.g. Huber and Burton Citation1995). Indeed, a recent meta-analysis of data collected on children’s gender stereotypes in 78 Draw-a-Scientist studies conducted over five decades found that although children’s representations of scientists have come to depict more female scientists over time, stereotypes of scientists as male still predominate. In addition, older children are more likely to draw male scientists than female, suggesting perceptions of science as being suitable more for males than females, become more entrenched as children get older (Miller et al. Citation2018).
Although Draw-a-Scientist studies can be subjected to critique (Losh, Wilke, and Pop Citation2008), young people often do seem to subscribe to a narrow view of scientists as white, male, and highly intelligent (using terms such as ‘smart’, ‘clever’ and ‘brainy’), with limited social skills and working long hours alone in a lab (Cleaves Citation2005; DeWitt and Archer Citation2017; Hillman et al. Citation2014; Scherz and Oren Citation2006). Moreover, even when scientists are considered in a positive light (e.g. as intelligent, or capable of ‘saving the world’), these perceptions often position scientists as ‘other’, which makes it difficult for young people to consider them as ‘like me’ or as someone they could become (Archer et al. Citation2013b).
These images of scientists and their work would seem to form early in an individual’s life, with pupils in primary school often holding such stereotypical views (Avraamidou Citation2013; Bian, Leslie, and Cimpian Citation2017; Buck, Leslie-Pelecky, and Kirby Citation2002; Emvalotis and Koutsianou Citation2018; Hillman et al. Citation2014). Such perceptions are likely shaped by the numerous societal messages that children and their key influencers – their families and teachers – receive (Christensen, Knezek, and Tyler-Wood Citation2014). Indeed, research on public attitudes to science suggests that adults often hold images of science which, while positive (e.g. making a valuable contribution to society), are narrow (Ipsos MORI Citation2011; Losh et al. Citation2008), and that many adults do not necessarily have a clear understanding of what scientists do (BIS Citation2014; BEIS Citation2020).
That narrow images take root early is also not surprising, considering the portrayal of scientists in the media, which is the main way in which most children encounter science (Sharkawy Citation2012). For instance, on the CBeebiesFootnote1 programme Biggleton (Langan Citation2019) which focuses on jobs various people do, the scientist character is introduced as ‘a clever, clever scientist, solving hard problems with her big, big brain’. While it is admirable that the scientist is female, the show broadly reinforces the stereotype of scientists as exceptionally clever individuals who work alone in a lab-type environment. Other research highlights that such limiting, or even stereotypical, images of science are pervasive in popular media (Long et al. Citation2010; Schummer and Spector Citation2008) and that such images do influence young people’s (and adults’) images of science and can be particularly problematic for girls (Steinke et al. Citation2009; Tan, Jocz and Zhai Citation2017). As Long et al. (Citation2010) note, ‘the popular perception of scientists as being “unusually intelligent, socially inept, and absent-minded “geeks” or “nerds”” (Congressional Commission on the Advancement of Women and Minorities in Science, Engineering and Technology Development Citation2020) may work against girls’ identifying with scientist characters and perceiving science as a reasonable career path’ (p 359).
Not surprisingly, research highlights that such perceptions can be difficult to shift. For example, one intervention which brought female scientists into primary school classrooms, where they introduced themselves as scientists and led discussions about their work, failed to change 9- to 11-year-old students’ stereotypes of scientists. Indeed, most students insisted that the visitors could not be scientists and were likely teachers (Buck, Leslie-Pelecky, and Kirby Citation2002). In a more recent study, ‘resident scientists’ were placed in classrooms for ten hours a week, over most of an academic year. This intervention led to decreased stereotypes among secondary school age children (middle and high school students) but not among children in primary school (Hillman et al. Citation2014).
In contrast, other research reflects that it may indeed be possible to counter stereotypical images and shift perceptions of scientists (Cakmakci et al. Citation2011; Painter et al. Citation2006; Schinske et al. Citation2016; Sharkawy Citation2012; Woods-Townsend et al. Citation2016). For instance, stories about scientists from diverse backgrounds were presented to young primary school students over a period of approximately 5 months. Qualitative analysis suggested that participating children extended their perceptions of scientists to individuals from non-dominant backgrounds, as well as began to gain an appreciation of scientists’ work as collaborative in nature (Sharkawy Citation2009, Citation2012). Another project involving four interventions, introducing slightly older students (ages 12–13) to scientists and presentations on scientists’ lives, reported an increase in students’ perceptions of scientists as ‘ordinary people’ with families and social lives (Cakmakci et al. Citation2011). Other research has also highlighted the way in which relatively brief face-to-face interactions with scientists can help shift perceptions of secondary school students towards regarding scientists as ‘normal’ (Woods-Townsend et al. Citation2016). Broadly, then, while it may be possible to broaden or shift young people’s images of scientists, this would seem to perhaps be particularly challenging with primary school students. Nevertheless, the early formation of such narrow views highlights the importance of attempting to challenge them sooner rather than later, which further informed our decision to implement our intervention with primary school students.
Possible selves in science
We regard broadening students’ images of who does – and can do – science as a precursor to many students being able to imagine themselves in a science-related career, whether this breadth is represented in background characteristics (e.g. gender, ethnicity, social class) or others more aligned with personality attributes (e.g. curious, observant). Thus, our work draws upon the notion of ‘possible selves’ as a conceptual frame. Possible selves reflect individuals’ ideas of what they might become and would like to become, as well as what they are afraid of becoming (Markus and Nurius Citation1986) or images of the self that are desired/hoped for and those that are feared (Oyserman and Fryberg Citation2006). Possible selves are important because they play a motivational or self-regulatory role in shaping choices and behaviours, including those related to participation in science.
Possible selves are inherently social, shaped by specific others, such as family members, role models and media images, as well as social contexts more broadly, all influencing the ‘creation and maintenance of possible selves’ (Oyserman and Fryberg Citation2006). Individuals learn who people like them and not like them can become. In the case of science (often associated with ‘not me’ or who people ‘not like me’ can become), then, it becomes particularly important to highlight ways that scientists might be ‘like me’ (might possess shared desired attributes), in order to be able to start to see a scientist role as a possible self. Moreover, when social contexts do not have images of possible (science) selves for individuals ‘like me’, adopting science as a possible self is challenging. We are not arguing here that everyone should see science as part of their ‘possible self’, nor that every child should aspire to become, or grow up to become, a scientist. We simply hope to increase the possibility that a wider range of individuals can come to see scientist as a possible self.
The use of the construct of possible selves as a conceptual lens in the current study aligns well with the focus of our intervention on challenging stereotypes associated with scientists. That is, the intervention draws attention to non-stereotypical attributes of featured scientists, characteristics which students may feel they possess or could come to embody in future careers. Indeed, previous research suggests that as students make decisions about whether or not to pursue science, they may compare themselves with a prototype (and attributes possessed by that prototype) of a person in that role (Hannover and Kessels Citation2004).
It should be noted that the focus of this study was primarily on attributes that any child could feel they possess or could come to possess (e.g. curious, observant), regardless of background characteristics such as gender, ethnicity or social class. Such characteristics are very important influences on individuals’ possible selves – being completely interwoven with identity, but they are generally less malleable, at least during childhood. Additionally, because of the under-representation of women in STEM particular attention was paid to how girls’ responded to the study. Intelligence as a characteristic was also a focus, as previous research highlights that intelligence or cleverness, while a broadly positive characteristic, can also lead girls in particular to position careers that require it – or possible selves that possess it – as unattainable and thus ‘not for me’ (Betz and Sekaquaptewa Citation2012; Archer et al. Citation2017).
Previous research has also utilised the theory of possible selves to explore aspirations, career self-concepts and perceptions of science careers (DeWitt and Bultitude Citation2018; Mills Citation2014; Packard and Nguyen Citation2003; Steinke et al. Citation2009). For instance, a study investigating young people’s academic self-concepts related to science found that a brief intervention involving viewing televised scientist characters seemed to support a positive change in adolescents’ future academic science self-concepts (Steinke et al. Citation2009).
The aim of this research study, then, was to examine if a carefully-designed stereotype reduction intervention, ‘Scientist of the Week’ could lead to a change in the perceptions of children about people who work in science-related careers. The study investigates whether using a school-based, medium-term, teacher-led intervention can improve children’s knowledge and understanding of scientists and other people in STEM-based jobs by replacing the common stereotypes or limiting images with a more nuanced, accurate and varied vocabulary. It also seeks to ascertain the longer-term impact of this intervention on the stereotypical viewpoints of scientists often held by young children.
Materials and methods
Context
The Scientist of the Week (SotW) intervention was created as part of the offer of a University STEM Outreach Group in England. This Outreach Group aims to broaden the diversity of young people studying STEM subjects and choosing STEM careers. The group does this by supporting young people and their key influencers (families and teachers) to widen their aspirations and perceptions of STEM, helping them make informed choices about their future particularly with respect to STEM pathways and careers.
This paper presents the analyses of the impact of the SotW intervention on children in one primary school in England. The school has two classes in each year group and caters for children from Nursery to Year 6 (ages 3 to 11), with 482 children on roll (January 2016). The school serves children from a community which is within the top 20% most deprived neighbourhoods in England (Department for Communities and Local Government Citation2015) with 20% of its pupils in receipt of Free School Meals, above the national average of 14.5% for English schools in 2016. The school serves communities that are in the top 10% of the most deprived areas in the United Kingdom (Department for Communities and Local Government Citation2015). The ethnic makeup of the school mirrors the local area, with the majority of pupils coming from predominantly white British backgrounds. The school had been working closely with the University Outreach Group for 2 years prior to the SotW intervention.
SotW is comprised of teaching resources, teacher CPD, and pupil resources. During the intervention, each week a new scientist was introduced to the children using three different resources: presentation slides for teachers, postcards for the children to take home, and posters for display on classroom walls for teachers to refer to throughout the week. During the week teachers also encouraged pupils to demonstrate the three key attributes linked to that scientist in their science lessons. The children were regularly encouraged to refer to their copy of the postcard of the scientist which contained the description and an explanation of the 3 linked attributes. For each week, classroom discussions in science (and wider STEM lessons) were contextualised through the scientist, their work and their attributes. Praise given by the teachers to the students was also framed in terms of the attributes; so rather than being praised for completing a worksheet or getting a questions right, praise was given for showing tenacity, being well-organised, or communicating a scientific idea well (see for the full list of attributes).
Table 1. The fifteen STEM attributes.
SotW described five science role-models working across different disciplines. The scientists were chosen to represent the diversity present in the STEM workforce whilst countering the common stereotypes about scientists that are common in children’s media. Three female and two male scientists were chosen and two of the scientists were from black or ethnic minority backgrounds. For each scientist, a photograph was selected accompanied by their name and job title. A short paragraph was written to describe the work of that scientist. Embedded within the paragraph were three key attributes that allow each person to be successful within their science discipline (). Although the term ‘scientist’ was used in the project, the role models chosen were from a broad range of STEM careers.
Figure 1. An example of the scientist of the week resource.
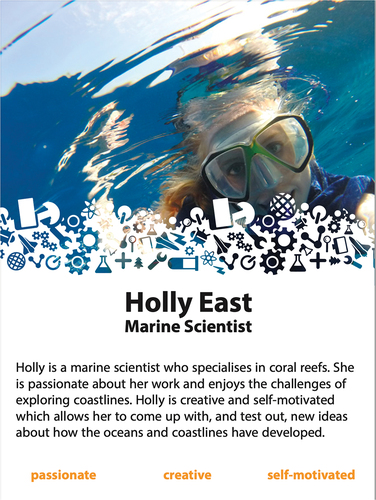
The fifteen descriptive attributes () were used as counter-stereotypical vocabulary and were drawn from discussions with scientists and academics working in STEM-based fields, and from attributes used in projects such as ‘People Like Me’ (MacDonald Citation2014) and the Royal Academy of Engineering’s ‘Engineering Habits of Mind’ (Lucas, Hanson, and Claxton Citation2014).
Research question and methodology
The SotW intervention was designed to change children’s perception of scientists through the introduction of counter-stereotypical descriptive vocabulary (See ). The research attempted to answer the following question:
Does a medium-term teacher-led intervention change reported stereotypical word association with scientists amongst young children in the long term?
Data collection methods and analysis
Children were asked to ‘Write down 6 words you would use to describe a scientist’. These data were collected from all pupils in the school (ages 5–11) who were present at four data collection points: one week before the SotW intervention began (t0), one week after the intervention had ended (t1), and then 3 months (t2) and 1 year (t3) after the intervention. Data collection took place in the classroom by the research team. Using the child’s name and their class name, a matched sample of individuals was identified for use in the analysis (n = 118). These were individuals that were present at all four data collection points. The children in the oldest year group (age 11+) were removed from the sample as they could not form part of the long-term matched sample due to their transition to secondary school before t3. The matched sample of individuals was anonymised.
The open question ‘What 6 words would you use to describe a scientist?’ generated qualitative data in children’s own words. A qualitative methodology was selected for this study for the value it places in generating knowledge grounded in human experience, and in answering questions about meaning and perspectives from the standpoint of the participant (Hatch Citation2002). This study employed inductive thematic analysis to explore the concepts and themes that make up children’s understandings and perceptions of scientists. Thematic analysis is a method used for identifying, analysing, organising, describing and reporting themes that emerge within a data set (Braun and Clarke Citation2006). Thematic analysis was additionally used in this study to identify 8 distinct categories that could be used to measure children’s perceptions of scientists.
Following anonymisation, an Excel spreadsheet was used to log all raw data. During this process it was decided to exclude data collected from the youngest year group (aged 5) due to difficulties in transcribing the children’s written answers to the question. Frequency analysis of the Excel spreadsheet was undertaken to identify the frequency each unique word that occurred within the data set. The unique words and their frequencies were printed out onto cards for manual analysis by the research team. This analysis was undertaken by five researchers during research meetings, to ensure researcher triangulation and enhance the credibility of the analytical procedure (Lincoln and Guba Citation1985). In the first stage of analysis, researchers individually familiarised themselves with the data, documenting their thoughts about potential codes and themes that could be returned to in subsequent phases (Braun and Clarke Citation2006; Lincoln and Guba Citation1985). The second stage of analysis began to generate initial codes. In a series of research meetings, the team met to systematically work their way through the data set grouping words of similar meaning (i.e. intelligent, clever, genius, smart), and identifying initial codes for these groupings. ‘In-vivo’ codes were used where possible (Nowell et al. Citation2017). Once all data had been grouped and coded, phase three involved sorting, clustering and condensing all relevant coded data into larger categories (Braun and Clarke Citation2006; Nowell et al. Citation2017). Categories were derived inductively from the data, rather than trying to fix a pre-existing coding frame or any preconceived ideas within the research team. During this process diagramming was used to make sense of and display the connections and relationships between the categories. In this hierarchies were explored, and some initial codes began to form main categories (e.g. stereotypes), and others became their sub-categories (e.g. intelligence stereotypes) (Nowell et al. Citation2017). A miscellaneous category was created to accommodate codes that did not seem to fit within the main themes. In phase four, the emergent categories were reviewed among the research team and further refined (Braun and Clarke Citation2006). In this process the coded data extracts within each category were reviewed to ensure each was distinct and determine whether the category encapsulated the meanings evident in the data set as a whole (Nowell et al. Citation2017). As an additional check, two further researchers were invited to review the categorisations and flag up any apparent inconsistencies or areas of confusion. These were discussed among the research team and revisions were made where necessary, for example, an initial category was created for words that fell into gender stereotypical patterns regarding scientists, however only two children wrote words that fell into these categories so they were removed. In phase five, the categories and subcategories were finalised and documented. documents the eight final categories alongside some of the ‘in-vivo’ codes from within this category.
Table 2. Categories of words produced.
The ‘Intelligence’ subcategory of ‘Stereotypes’ was further thematically analysed to differentiate between high levels of intelligence (genius, brainbox, etc.) and a more general, positive understanding of intelligence (clever, intelligent, etc.).
Within the t0 dataset, the proportion of the total words across the sample in each of the eight categories was compared across the year groups and genders. This was then compared at t1, t2 and t3 to explore changes in the tracked dataset over the time period following the intervention.
Proportional word usage between the collection points was tested for significance using the Chi Square Test Statistic with a 95% confidence interval. All statistical analyses were completed using the R statistical Software package (R Core Team Citation2013).
Results
Baseline data (t0)
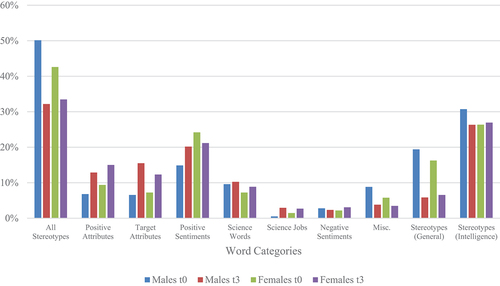
At the initial data collection (t0), 674 words were used by respondents (N = 118). A comparison of the proportion of the total words used across the entire sample for each category () showed that 47% of the words were aligned with stereotypes.
Figure 2. Types of words used to describe scientists, by gender.
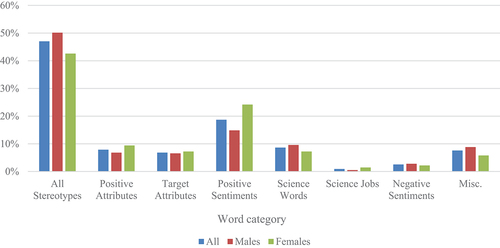
33% of the words used were positive in nature (combining the categories ‘Positive attributes’, ‘Target attributes’ or Positive Sentiments’). Females were more likely to use words that were categorised as ‘Positive sentiments’ than males. Of all the words used by females, 24% were categorised as ‘Positive sentiments’, compared with 15% of all the words used by males 2 (2, N = 118) = 10.009, p < .01. Although males used proportionally more words classed as ‘Stereotypes’ than females, this difference was not statistically significant.
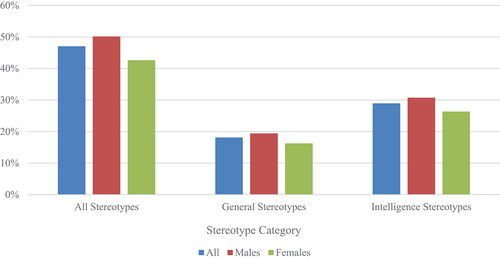
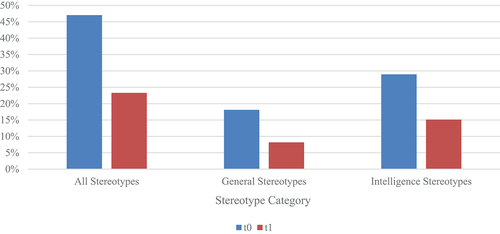
Further analysis within the ‘Stereotypes’ category () reflected that stereotypes that specifically referred to intelligence (e.g. brain box, genius, clever) made up a greater proportion of the total sample of words (29%) compared with ‘General Stereotypes’ (e.g. lab coats, explosion, crazy hair), at 18%. Although males seemed more likely than females to use words in these categories, the differences were not statistically significant.
Figure 3. Use of stereotypical words, by gender.
Post-intervention (t1, 2, 3)
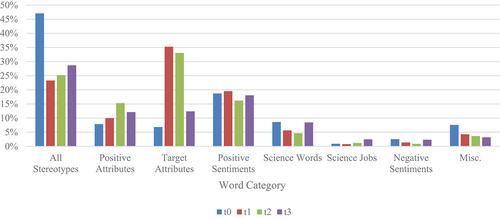
At t1 (one week post-intervention), there was a change in the types of words that children were using to describe scientists ().
Figure 4. Types of words produced, pre-post (t1) intervention.
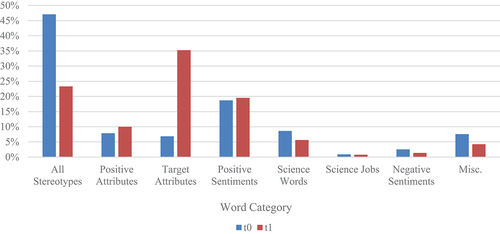
There was a significant association between time (t0 to t1) and the proportions of words in the ‘All Stereotypes’ category, 2 (2) = 117.732, p < .001 and between time and the proportions of words in the ‘Target Attributes’ category,
2 (2) = 64.010, p < .001. That is, from t0 to t1 the words children produced in the ‘All Stereotypes’ category decreased from 47% to 23%, and those in the ‘Target Attributes’ category increased from 7% to 35%.
Further analysis of the ‘All stereotypes’ category confirms a significant association between time and the proportion of words in the categories ‘Intelligence Stereotypes’, 2 (2) = 37.116, p < .001, and ‘General stereotypes’,
2 (2) = 28.832, p < .001 (). The proportion of total words children used that were categorised as ‘General Stereotypes’ fell from 18% to 8%, and for ‘Intelligence Stereotypes’ fell from 29% to 15%
Figure 5. Sub-types of stereotypical words produced, pre-post (t1) intervention.
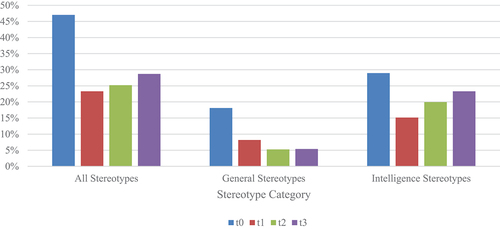
At t3 (one year post-intervention), a significant association remained between time point (t0 to t3), and the words in the categories: ‘All Stereotypes’ 2 (2) = 71.722, p < .000, and ‘Target Attributes’,
2 (2) = 17.792, p < .000 (). The proportion of the total words used that were categorised as ‘All Stereotypes’ decreased from 47% to 29%, and for ‘Target Attributes’ there was an increase from 7% to 12%.
Figure 6. Types of words produced, over time.
Further analysis of the ‘All Stereotypes’ sub-categories () shows a significant association between time period (t0 – t3) and the proportion of words categorised as ‘General Stereotypes’, 2 (2) = 40.831, p < .000. The proportion of total words that were categorised as ‘General Stereotypes’ decreased from 18% to 5%. However, although the use of ‘Intelligence Stereotypes’ was lower than at t0, a decrease from 29% to 23% of the total words used, this was not statistically significant.
Figure 7. Types of stereotypical words produced, over time.
The ‘Intelligence Stereotypes’ category was further analysed through sub-categorisation into words that portrayed an extreme level of intelligence (genius, brain box, etc.) and those that described a more general level intelligence (clever, intelligent, etc.). Neither of these groups saw a statistically significant change from t0 to t3, either across the whole study, or within the male or female subgroups.
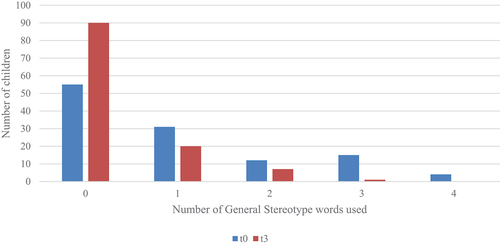
The fall in participants’ use of ‘General stereotypes’ seemed to be maintained over time, while their use of words consistent with intelligence-related stereotypes was not. This finding is further supported by an examination of the numbers of words children produced in these categories at the beginning and end of the study for the ‘General Stereotypes’ (). In particular, more children (110) used one or no words in the ‘General Stereotypes’ category at the end of the study, compared with the number of children doing so at the beginning (86). Likewise, fewer children (8) produced two, three or four words in this category at the end of the study, compared with the beginning children (31).
Figure 8. Number of ‘General Stereotypes’ words produced, by time.
Changes in word usage from t0 to t3 by gender
One year post-intervention changes in the word usage by males and females show different responses to the intervention. Both groups had changes in the percentage of stereotypical words used, however, males were twice as likely to have reduced the numbers of stereotypes they used (a decrease of 19% for males, compared to 9% for females). Males were more likely to be using fewer ‘Intelligence Stereotypes’, however this was not statistically significant.
Further analysis of data from males () showed a significant association between time (t0 – t3) and the proportion of words categorised as ‘Positive Attributes’, 2 (2) = 7.585, p < .01; ‘Target Attributes’,
2 (2,) = 14.161, p < .000; and ‘Positive Sentiments’,
2 (2) = 4.734, p < .05. More specifically, ‘Positive attributes’ increased from 7% to 13%, ‘Target Attributes’ increased from 7% to 15% and ‘Positive Sentiments’ increased from 15% to 20%. While trends for ‘Positive attributes’ and ‘Target attributes’ were similar for females, these differences were not significant.
Figure 9. Types of words used to describe scientists over time, by gender.
Discussion
This study sought to examine long term changes in stereotypical associations with scientists made by young children achieved through a medium-term, counter-stereotypical role model intervention, ‘Scientist of the Week’. The results suggest that the intervention seems to have been able to effect change in the stereotypical views of scientists held by the participants. The effect was more pronounced among male pupils compared with female pupils. Analyses also found that stereotypical associations related to high-level intelligence changed significantly in the short-term, but not in the longer term.
The baseline data is consistent with much of the previous literature exploring stereotypes of scientists held by children and young people (Bian, Leslie, and Cimpian Citation2017; Emvalotis and Koutsianou Citation2018; Finson Citation2002; Hillman et al. Citation2014; Miller et al. Citation2018). This research highlights that young children’s understanding of scientists is narrow and is also aligned with commonly portrayed stereotypes (Christensen, Knezek, and Tyler-Wood Citation2014; DeWitt and Archer Citation2017). However, one key difference between the baseline data in this study and previous research was the omission of the ‘male’ stereotype from the data. This may be in part because children were asked to provide descriptive text rather than a drawing and thus did not have to pick a gender for their scientist. At the same time, substantial research (beyond that using the Draw-a-Scientist-Test) has highlighted the pervasive association of science – particularly engineering, physics and technology – with masculinity (Archer et al. Citation2017; Kessels, Rau, and Hannover Citation2006). Although it would be unwarranted to assume that the omission of ‘man’ or ‘male’ from the words provided means the stereotype is shifting, it is nonetheless encouraging that, perhaps, the strength of this association may be starting to fade. On the other hand, existing research is not definitive about how early the associations between science and masculinity begin (Buck, Leslie-Pelecky, and Kirby Citation2002; Hillman et al. Citation2014).
This study found that the perceptions of scientists by males and females were broadly similar at baseline, with one exception. Females were more likely to describe scientists using positive sentiments, and are more aligned with the non-stereotypical view of scientists. Previous research has suggested that stereotypical descriptions of scientists may be correlated with media consumption, such as video games, the use of which is more prevalent amongst males (Tan, Jocz and Zhai Citation2017). The impact of the intervention was more significant for males, with significant changes maintained after one year in three categories.
The results show diminishing returns over the year after the intervention took place. One-week (t0) and three months (t2) post intervention there had been statistically significant changes in almost all categories, however after a year had passed only ‘general stereotypes’ and ‘positive attributes’ categories remained changed significantly. Of particular note is the return of the ‘intelligence stereotypes’ category to pre-intervention levels. This suggests that there are some stereotypes that are more prevalent with the highest proportional usage at baseline (), and therefore more difficult to influence than others; intelligence being possibly the most difficult. Of course, given the pervasiveness outside of this intervention of impressions of scientists as particularly clever, such shifts back towards the baseline are not surprising.
This is particularly the case for the association of science with intelligence – the image of the ‘clever scientist’ is one that has proven to be particularly deeply entrenched (Kessels, Rau, and Hannover Citation2006; Varelas, Kane, and Wylie Citation2011). Finally, this reversion to more stereotypical or limiting views also serves as a reminder of the importance of extended interventions (rather than one-off experiences) and of looking for change after more extended time periods.
In sum, this research has shown that with minimal expense and effort from teachers, negative stereotypes of scientists can be reduced. The intervention does not require bringing scientists into the classroom, nor changing the curriculum, nor taking pupils on trips out of the classroom, as effective as these types of experiences can be. Moreover, some of the observed changes persisted in the longer-term, suggesting a lasting alteration in children’s perceptions of scientists as a result of the intervention. The intervention has even been shown to mitigate against intelligence stereotypes, although only in the short-term. However, in this way the study is also consistent with research highlighting the strength and persistence of the stereotype of scientists as very clever. If this type of intervention was more common in a child’s schooling, occurring on an annual basis, for instance, then it could offer more promise for a mitigating effect even on this stereotype.
The findings are also encouraging from the perspective of research and theorisation around possible selves. By portraying a range of attributes among the featured scientists in the intervention, we hoped to increase the likelihood a student could find attributes that they desired or valued, related to both how they see themselves now and/or who they would like to be in the future, thus scaffolding the development of possible selves by making them more ‘thinkable’. Moreover, by highlighting varied attributes or characteristics of scientists, the intervention aimed to enable students to see someone in science they already resemble, or to see their possible selves reflected in a scientist, an approach which stands in contrast to portraying scientist role models who represent the people students would be expected to change into. The shift in the attributes used by students to describe scientists following the intervention suggests that these young people may now be using vocabulary that is more similar to the way that scientists themselves would describe their role and work. It is also encouraging that this shift was seen in primary school students, an age at which some studies, at least, have found it challenging to shift stereotypes (e.g. Buck, Leslie-Pelecky, and Kirby Citation2002; Hillman et al. Citation2014).
Limitations and future research
The study reported here has a number of limitations, such as its focus on one school in one region of the country. The method of data collection, the six-word association with the word ‘scientist’, is relatively novel in terms of its use in this line of research, with the Draw a Scientist task more often utilised; it could therefore warrant further exploration as to its efficacy. There is also a challenge with interpreting a child’s meaning from a single word; future studies may wish to use focus groups to gain a better understanding of this. Lack of a comparison group is also a limitation. Although it is unlikely that the changes observed would have happened in the absence of an intervention, utilisation of a comparison group would strengthen confidence in the findings. Analysis of possible effects of repeated SotW interventions over a number of years with a single group would also deepen our understanding of the effectiveness of this intervention, addressing questions around whether effects are cumulative, whether there is a ceiling effect, and even whether with repeat interventions, the ‘clever scientist’ stereotype could be effectively mitigated.
The intervention is due to be delivered by teachers in a number of other schools in the future and the authors would welcome studies by researchers using this approach in other educational contexts.
Conclusions
The evidence presented in this study suggests that a medium-term, teacher-led intervention can influence stereotypical word association with scientists amongst primary-aged children for up to a year. Some common science-related stereotypes, such as those involving appearance (e.g. lab coats) can be changed amongst children, and that change seems to remain stable over the long term. Even the stereotype that scientists require high or genius level of intelligence can be changed in the short term, although over time this stereotype makes a return into a child’s view of who and what scientists are.
Although this intractability of the ‘clever scientist’ stereotype is broadly consistent with existing research, there have also been studies, particularly with secondary school students, suggesting that this stereotype too may be amenable to intervention, particularly when young people have the opportunity to get to know scientists as ‘normal people’ (Woods-Townsend et al. Citation2016). Although students did not have the opportunity to meet scientists in person in the Scientist of the Week intervention, its focus on non-stereotypical, attainable attributes has some potential to give students similar insights. Moreover, not only does this focus on attributes such as observant or curious help to flesh out students’ mental pictures of who can do science but it is also ‘true’ to science. That is, some interventions that aim to challenge stereotypes of science and scientists try to portray fields such as physics and engineering as diverse and welcoming, which runs the risk of providing a misleading view of the STEM workforce. By focusing on diverse yet relatable attributes (many of which the young people may already feel they possess), Scientist of the Week offers a way to address this tension between the need to challenge stereotypes yet also not portray science (or some areas of science) in a way that sets unrealistic expectations of what might be encountered should a young person pursue a career in the field. The balance between providing a realistic view of science and increasing and diversifying the number of young people who can find a possible self in it is a delicate one, and one in which the approach offered by Scientist of the Week has promise in reaching.
Disclosure statement
No potential conflict of interest was reported by the author(s).
Notes
1. (A BBC children’s channel)
References
- Archer, L., J. DeWitt, J. Osborne, J. Dillon, B. Willis, and B. Wong. 2013b. “Not girly, not sexy, not glamorous”: primary school girls’ and parents’ constructions of science aspirations1. Pedagogy, Culture and Society 21(1): 171–194. https://doi.org/10.1080/14681366.2012
- Archer, L., J. DeWitt, J. Osborne, J. Dillon, and B. Wong. 2013a. ASPIRES. Young people’s science and career aspirations, age 10 – 14. King’s College London Department of Education & Professional Studies. Accessed 13 January 2021. https://www.kcl.ac.uk/ecs/research/aspires/aspires-final-report-december-2013.pdf
- Archer, L., J. Moote, B. Francis, J. DeWitt, and L. Yeomans. 2017. The “Exceptional” Physics Girl: A Sociological Analysis of Multimethod Data From Young Women Aged 10–16 to Explore Gendered Patterns of Post-16 Participation. American Educational Research Journal 54(1): 88–126. https://doi.org/10.3102/0002831216678379
- Archer, L., E. Dawson, J. DeWitt, A. Seakins, and B. Wong. 2015. “Science capital”: A conceptual, methodological, and empirical argument for extending bourdieusian notions of capital beyond the arts. Journal of Research in Science Teaching. https://doi.org/10.1002/tea.21227
- Avraamidou, L. 2013. “Superheroes and Supervillains: Reconstructing the Mad-scientist Stereotype in School Science.” Research in Science and Technological Education 31 (1): 90–115. doi:10.1080/02635143.2012.761605.
- Betz, D. E., and D. Sekaquaptewa. 2012. “My Fair Physicist? Feminine Math and Science Role Models Demotivate Young Girls.” Social Psychological and Personality Science 3(6): 738–746. doi:10.1177/1948550612440735.
- Bian, L., S. J. Leslie, and A. Cimpian. 2017. “Gender Stereotypes about Intellectual Ability Emerge Early and Influence Children’s Interests.” Science (New York, N.Y.) 355 (6323): 389–391. doi:10.1126/science.aah6524.
- Braun, V., and V. Clarke. 2006. “Using Thematic Analysis in Psychology.” Qualitative Research in Psychology 3 (2): 77–101. doi:10.1191/1478088706qp063oa.
- Buck, G. A., D. Leslie-Pelecky, and S. K. Kirby. 2002. “Bringing Female Scientists into the Elementary Classroom: Confronting the Strength of Elementary Students’ Stereotypical Images of Scientists.” Journal of Elementary Science Education 14 (2): 1–9. doi:10.1007/bf03173844.
- Cakmakci, G., O. Tosun, S. Turgut, S. Orenler, K. Sengul, and G. Top. 2011. “Promoting an Inclusive Image of Scientists among Students: Towards Research Evidence-based Practice.” International Journal of Science and Mathematics Education 9 (3): 627–655. doi:10.1007/s10763-010-9217-4.
- Catalyst. 2020. “Women in Science, Technology, Engineering, and Mathematics (STEM): Quick Take.” https://www.catalyst.org/research/women-in-science-technology-engineering-and-mathematics-stem/
- Chambers, D. W. 1983. Stereotypic images of the scientist: The draw-a-scientist test. Science education 67(2): 255–265.
- Christensen, R., G. Knezek, and T. Tyler-Wood. 2014. “Student Perceptions of Science, Technology, Engineering and Mathematics (STEM) Content and Careers.” Computers in Human Behavior 34: 173–186. doi:10.1016/j.chb.2014.01.046.
- Cleaves, A. 2005. “The Formation of Science Choices in Secondary School.” International Journal of Science Education 27 (4): 471–486. doi:10.1080/0950069042000323746.
- Clemence, M., N. Gilby, J. Shah, J. Swiecicka, D. Warren, P. Smith, and J. D. Souza. 2013. “Wellcome Trust Monitor: Wave 2.” Wellcome Trust. Accessed 4 January 2021. https://wellcome.ac.uk/sites/default/files/monitor-wave2-full-wellcome-may13.pdf
- Congressional Commission on the Advancement of Women and Minorities in Science, Engineering and Technology Development. 2020. “Land of Plenty Diversity as America’s Competitive Edge in Science, Engineering and Technology.” Accessed 5 January 2020. https://www.nsf.gov/pubs/2000/cawmset0409/cawmset_0409.pdf
- Davenport, C., O. Dele-Ajayi, I. Emembolu, R. Morton, A. Padwick, A. Portas, J. Sanderson, J. Shimwell, J. Stonehouse, R. Strachan, and L. Wake. 2020. A Theory of Change for Improving Children’s Perceptions, Aspirations and Uptake of STEM Careers. Research Science Education. https://doi.org/10.1007/s11165-019-09909–6
- Department for Business, Energy and Industrial Strategy. 2020. “Annual Report and Accounts 2014–2015.” Accessed 4 January 2021. https://assets.publishing.service.gov.uk/government/uploads/system/uploads/attachment_data/file/922625/CCS0320287242-001_BEIS_Annual_Report-V11.pdf
- Department for Business Innovation and Skills. 2014. “Annual Report and Accounts 2014–2015.” Accessed 4 January 2021. https://assets.publishing.service.gov.uk/government/uploads/system/uploads/attachment_data/file/444895/BIS-15-421-BIS-Annual-Report-15-HI-RES.pdf
- Department for Communities and Local Government. 2015. “The English Indices of Deprivation 2015”. Accessed 6 January 2021. https://assets.publishing.service.gov.uk/government/uploads/system/uploads/attachment_data/file/465791/English_Indices_of_Deprivation_2015_-_Statistical_Release.pdf
- Department for Education. 2017. “Careers Strategy: Making the Most of Everyone’s Skills and Talents”. Accessed 6 January 2021. https://assets.publishing.service.gov.uk/government/uploads/system/uploads/attachment_data/file/664319/Careers_strategy.pdf
- DeWitt, J., and L. Archer. 2017. Participation in informal science learning experiences: the rich get richer? International Journal of Science Education, Part B: Communication and Public Engagement, 7(4), 356–373. https://doi.org/10.1080/21548455.2017.1360531
- DeWitt, J., and K. Bultitude. 2018. Space Science: the View from European School Students. Research in Science Education. https://doi.org/10.1007/s11165-018-9759–y
- Emvalotis, A., and A. Koutsianou. 2018. “Greek Primary School Students’ Images of Scientists and Their Work: Has Anything Changed?” Research in Science and Technological Education 36 (1): 69–85. doi:10.1080/02635143.2017.1366899.
- Finson, K. D. 2002. “Drawing a Scientist: What We Do and Do Not Know after Fifty Years of Drawings.” School Science and Mathematics 102 (7): 335–345. doi:10.1111/j.1949-8594.2002.tb18217.x.
- Finson, K. D., J. B. Beaver, and B. L. Cramond. 1995. Development and field test of a checklist for the Draw‐A‐Scientist Test. School science and mathematics 95(4): 195–205.
- Fort, D. C., and H. L. Varney. 1989. How students see scientists: Mostly male, mostly white, and mostly benevolent. Science and Children 26(8): 8–13.
- Greenfield, S., J. Peters, N. Lane, T. Rees, and G. Samuels. 2002. “SET Fair.” Accessed 10 January 2021. http://image.guardian.co.uk/sys-files/Education/documents/2002/11/28/4408-DTI-Greenfield.pdf
- Guides Girl. 2016. “2016 Girls’ Attitudes Survey.” Accessed 8 January 2021. www.girlguiding.org.uk/girlsattitudes
- Hannover, B., and U. Kessels. 2004. “Self-to-prototype Matching as a Strategy for Making Academic Choices. Why High School Students Do Not like Math and Science.” Learning and Instruction 14 (1): 51–67. doi:10.1016/j.learninstruc.2003.10.002.
- Hatch, J. A. 2002. Doing Qualitative Research in Education Settings. Suny Press.
- Hillman, S. J., K. H. Bloodsworth, C. E. Tilburg, S. I. Zeeman, and H. E. List. 2014. “K-12 Students’ Perceptions of Scientists: Finding a Valid Measurement and Exploring whether Exposure to Scientists Makes an Impact.” International Journal of Science Education 36 (15): 2580–2595. doi:10.1080/09500693.2014.908264.
- House of Commons Science and Technology Committee. 2014. “Women in scientific careers Sixth Report of Session 2013-14 Report.” https://publications.parliament.uk/pa/cm201314/cmselect/cmsctech/701/701.pdf
- Huber, R. A., and G. M. Burton. 1995. What do students think scientists look like? School Science and Mathematics 95(7): 371–376.
- Ipsos MORI. 2011. “Public attitudes to science 2011.” London: Ipsos MORI Social Research Institute.
- Jenkins, E. W., and R. G. Pell. 2006. “The Relevance of Science Education Project (ROSE) in England: A Summary of Findings.” Centre for Studies in Science and Mathematics Education, University of Leeds. Accessed 3 March 2021. https://www.roseproject.no/network/countries/uk-england/rose-report-eng.pdf
- Keller, B. K., and S. C. Whiston. 2008. “The Role of Parental Influences on Young Adolescents’ Career Development.” Journal of Career Assessment 16 (2): 198–217. doi:10.1177/1069072707313206.
- Kessels, U., M. Rau, and B. Hannover. 2006. “What Goes Well with Physics? Measuring and Altering the Image of Science.” British Journal of Educational Psychology 76 (4): 761–780. doi:10.1348/000709905X59961.
- Koren, P., and V. Bar. 2009. “Science and It’s Images - Promise and Threat: From Classic Literature to Contemporary Students’ Images of Science and the Scientist.” Interchange 40 (2): 141–163. doi:10.1007/s10780-009-9088-1.
- Langan, T. 2019. Biggleton. United Kingdom: BBC. www.bbc.co.uk/cbeebies/shows/biggleton
- Leonardi, S., H. Lamb, J. Harrison, A. Stutz, R. Steer, P. Howe, and A. Corley. 2019. “Understanding the “State of the Nation” Report of UK Primary Science.” Wellcome Trust. https://wellcome.ac.uk/sites/default/files/understanding-state-of-the-nation-report-of-uk-primary-science-education.pdf
- Lincoln, Y., and E. G. Guba. 1985. Naturalistic Enquiry. Newbury Park, CA: SAGE.
- Long, Marilee, Jocelyn Steinke, Brooks Applegate, Maria Knight Lapinski, Marne J. Johnson, and Sayani Ghosh. 2010. “Portrayals of Male and Female Scientists in Television Programs Popular among Middle School-Age Children.” Science Communication 32 (3): 356–382. doi:10.1177/1075547009357779.
- Losh, S. C., R. Wilke, and M. Pop. 2008. “Some Methodological Issues with “Draw a Scientist Tests” among Young Children.” International Journal of Science Education 30 (6): 773–792. doi:10.1080/09500690701250452.
- Lucas, B., J. Hanson, and G. Claxton 2014. “Thinking like an Engineer - Implications for the Education System.” Royal Academy of Engineers. Accessed 11 January 2021. http://www.raeng.org.uk/thinkinglikeanengineer
- MacDonald, A. 2014. “Not for People like Me?” Under-represented groups in science, technology and engineering, (November 2014), 1–32.
- Mansour, N. 2015. “Science Teachers’ Views and Stereotypes of Religion, Scientists and Scientific Research: A Call for Scientist–science Teacher Partnerships to Promote Inquiry-based Learning.” International Journal of Science Education 37 (11): 1767–1794. doi:10.1080/09500693.2015.1049575.
- Markus, H., and P. Nurius 1986. “Possible Selves”. psycnet.apa.org. Accessed 3 January 2021. https://psycnet.apa.org/journals/amp/41/9/954.html?uid=1987-01154-001
- Matthews, B., and D. Davies. 1999. Changing Children's Images of Scientists: Can Teachers Make a Difference? School Science Review 80(293): 79–85.
- McCarthy, D. 2015. “Teacher Candidates’ Perceptions of Scientists: Images and Attributes.” Educational Review 67 (4): 389–413. doi:10.1080/00131911.2014.974510.
- Mead, M., and R. Metraux. 1957. Image of the scientist among high-school students. Science 126(3270): 384–390.
- Miller, D. I., K. H Nolla, A. H. Eagly, and D. H. Uttal. 2018. “The Development of Children’s Gender-Science Stereotypes: A Meta-analysis of 5 Decades of U.S. Draw-A-Scientist Studies.” Child Development 89 (6): 1943–1955. doi:10.1111/cdev.13039.
- Mills, L. A. 2014. “Possible Science Selves: Informal Learning and the Career Interest Development Process”. In 11th International Conference on Cognition and Exploratory Learning in Digital Age, CELDA 2014 (pp. 275–279). Portugal. https://eric.ed.gov/?id=ED557373
- Morgan, R, and C. Kirby 2016. “The UK STEM Education Landscape.” Royal Academy of Engineering. Accessed 12 January 2021. https://www.raeng.org.uk/publications/reports/uk-stem-education-landscape
- National Science Foundation. 2020. “The State of U.S. Science and Engineering 2020.” National Science Foundation. Accessed 19 August 2020, from https://ncses.nsf.gov/pubs/nsb20201/u-s-s-e-workforce
- Newton, L. D., and D. P. Newton. 2011. “Primary Children’s Conceptions of Science and the Scientist: Is the Impact of a National Curriculum Breaking down the Stereotype?” International Journal of Science Education 20 (9): 1137–1149. doi:10.1080/0950069980200909.
- Noonan, R. 2017. “STEM Jobs: 2017 Update (ESA Issue Brief #02-17).” US Department of Commerce. Accessed 8 January 2021. https://eric.ed.gov/?id=ED594354
- Nowell, L. S., J. M. Norris, D. E. White, and N. J. Moules. 2017. “Thematic Analysis.” International Journal of Qualitative Methods 16 (1): 160940691773384. doi:10.1177/1609406917733847.
- Osborne, J., S. Simon, and S. Collins. 2003. “Attitudes Towards Science: A Review of the Literature and Its Implications.” International Journal of Science Education 25 (9): 1049–1079. doi:10.1080/0950069032000032199.
- Oyserman, D., and S. Fryberg. 2006. “The Possible Selves of Diverse Adolescents: Content and Function across Gender, Race and National Origin.” In Possible Selves: Theory, Research and Applications, 17–40. Nova Science Publishers. https://bit.ly/308H6wk
- Packard, B. W. L., and D. Nguyen. 2003. “Science Career-Related Possible Selves of Adolescent Girls: A Longitudinal Study.” Journal of Career Development 29 (4): 251–263. doi:10.1177/089484530302900403.
- Painter, J., T.R. Tretter, M. G. Jones, and D. Kubasko. 2006. “Pulling Back the Curtain: Uncovering and Changing Students’ Perceptions of Scientists.” School Science and Mathematics 106 (4): 181–190. doi:10.1111/j.1949-8594.2006.tb18074.x.
- R Core Team. 2013. “R: A Language and Environment for Statistical Computing.” Foundation for Statistical Computing, Vienna, Austria. Accessed 16 January 2021. http://www.R-project.org/
- Scherz, Z., and M. Oren. 2006. “How to Change Students’ Images of Science and Technology.” Science Education 90 (6): 965–985. doi:10.1002/sce.20159.
- Schinske, J. N., H. Perkins, A. Snyder, M. Wyer, and P. Marsteller. 2016. “Scientist Spotlight Homework Assignments Shift Students’ Stereotypes of Scientists and Enhance Science Identity in a Diverse Introductory Science Class.” CBE Life Sciences Education 15 (3): 1–18. doi:10.1187/cbe.16-01-0002.
- Schummer, J., and T. I. Spector. 2008. Popular images versus self-images of science. Science Images and Popular images of the Sciences 69–95.
- Sharkawy, A. 2009. “Moving beyond the Lone Scientist: Helping 1st-grade Students Appreciate the Social Context of Scientific Work Using Stories about Scientists.” Journal of Elementary Science Education 21 (1): 67–78. doi:10.1007/bf03174716.
- Sharkawy, A. 2012. “Exploring the Potential of Using Stories about Diverse Scientists and Reflective Activities to Enrich Primary Students’ Images of Scientists and Scientific Work.” Cultural Studies of Science Education 7 (2): 307–340. doi:10.1007/s11422-012-9386-2.
- Steinke, J., M. K. Lapinski, M. Long, C. Van Der Maas, L. Ryan, and B. Applegate. 2009. “Seeing Oneself as a Scientist: Media Influences and Adolescent Girls’ Science Career-possible Selves.” Journal of Women and Minorities in Science and Engineering 15 (4): 279–301. doi:10.1615/JWomenMinorScienEng.v15.i4.10.
- Strachan, R., Peixoto, A., Emembolu, I., & Restivo, M. T. 2018. Women in engineering: Addressing the gender gap, exploring trust and our unconscious bias. IEEE Global Engineering Education Conference, EDUCON, 2018-April, 2088–2093. https://doi.org/10.1109/EDUCON.2018.8363497
- Tan, A. L., J. A. Jocz, and J. Zhai. 2017. “Spiderman and Science: How Students’ Perceptions of Scientists are Shaped by Popular Media.” Public Understanding of Science 26 (5): 520–530. doi:10.1177/0963662515615086.
- Tan, E., A. Calabrese Barton, H. Kang, and T. O’Neill. 2013. “Desiring a Career in STEM-related Fields: How Middle School Girls Articulate and Negotiate Identities-in-practice in Science.” Journal of Research in Science Teaching 50 (10): 1143–1179. doi:10.1002/tea.21123.
- Varelas, M., J. M. Kane, and C. D. Wylie. 2011. “Young African American Children’s Representations of Self, Science, and School: Making Sense of Difference.” Science Education 95 (5): 824–851. doi:10.1002/sce.20447.
- Vennix, J., P. Den Brok, and R. Taconis. 2018. “Do Outreach Activities in Secondary STEM Education Motivate Students and Improve Their Attitudes Towards STEM?” International Journal of Science Education 0693 (May): 1–21. doi:10.1080/09500693.2018.1473659.
- WISE. 2018. “WISE 2018 Workforce Statistics.” Women in Science and Engineering. Accessed 6 January 2021. https://www.wisecampaign.org.uk/statistics/2018-workforce-statistics/
- Woods-Townsend, K., A. Christodoulou, W. Rietdijk, J. Byrne, J. B. Griffiths, and M. M. Grace. 2016. “Meet the Scientist: The Value of Short Interactions between Scientists and Students.” International Journal of Science Education, Part B: Communication and Public Engagement 6 (1): 89–113. doi:10.1080/21548455.2015.1016134.