
ABSTRACT
This study aimed to develop motor competence (MC) profiles in children based on their actual and perceived MC, and to investigate differences in physical activity (PA) behaviour and motivation towards PA between profiles. Two hundred and sixteen British children (7–10 years) took part in this study. Perceived motor competence (PMC) was assessed using the pictorial scale of movement competence. MC was assessed using process-oriented and product-oriented measures. A validated questionnaire assessed motivation towards PA and an objective measure of PA was employed. K-means cluster analysis was used to create profiles. Differences in PA and motivation towards PA were examined using ANCOVAs. Four groups of divergent and convergent levels were identified based on the contribution of either product or process MC with PMC. Motivation towards PA differed by profiles that included actual-process and PMC. Children with high actual process and high PMC had significantly higher levels of autonomous motivation than children with high actual process but low PMC. No significant differences were found between PA levels and profiles. Developing the quality and execution of actual motor competence (AMC) and PMC is key to stimulate motivation towards PA. Furthermore, maintaining AMC and PMC simultaneously may be imperative to children’s future PA behaviour.
Introduction
Physical activity (PA) levels have decreased over recent decades with children and adolescents worldwide failing to meet the recommended guidelines of at least 60 minutes of daily moderate-to-vigorous PA (WHO, Citation2020). In order to increase PA levels, it is necessary to identify underlying mechanisms that influence PA behaviour (Bauman et al., Citation2002; Craggs et al., Citation2011). Actual motor competence (AMC), a series of basic movement patterns that provide the building blocks for more advanced motor skills (Logan et al., Citation2018) is considered an important mechanism for developing children’s PA behaviour (Clark & Metcalfe, Citation2002; Robinson et al., Citation2015; Stodden et al., Citation2008). Furthermore, perceived motor competence (PMC), defined as an individual’s awareness and belief in their capability to perform motor tasks (Harter, Citation1999), is positively associated with PA as confirmed by a systematic review data (Babic, Citation2014). As such, both AMC and PMC are facilitating mechanisms for PA. Understanding the ways in which combinations of AMC and PMC might influence health behaviours is key to effectively targeting interventions focusing on motor competence (MC) as a pathway for lifelong PA.
Despite a positive association between actual and perceived MC (Duncan et al., Citation2018; Robinson, Citation2011), meta-analysis indicates that the variation in the strength of the relationship between these constructs ranges from low to moderate (r = 0.19–0.46) (De Meester et al., Citation2020). This raises questions regarding the strength of the collective impact of actual and perceived MC on PA engagement. The variation in the strength of the relationship indicated by De Meester et al. (Citation2020) may be influenced by the variable-centred approach employed by the majority of studies. A variable-centred approach only provides an average description of the strength of the associations, judged by a correlation between two variables at group level (Howard & Hoffman, Citation2018). This approach does not consider the perceptual error that can be present in children (Harter, Citation1999) and fails to provide an accurate insight into how different AMC and PMC levels may be combined at an individual level. Accordingly, in order to examine whether children have different combinations of actual and perceived MC levels, a person-centred approach is required to allow for identification of groups of children who share certain attributes or relationships among attributes (Howard & Hoffman, Citation2018).
Previous work utilising a person-centred approach (using cluster analysis) indicates different MC-based profiles exist among children and adolescents, with a combination of divergent and convergent levels (Bardid et al., Citation2016; Estevan et al., Citation2019; De Meester et al., Citation2016). However, findings should be interpreted cautiously given the variation in the assessment tools. Previous person-centred studies have relied on measures of PMC that are not directly aligned to AMC (Bardid et al., Citation2016; De Meester et al., Citation2016). Recent research by De Meester et al. (Citation2020) has also suggested that alignment of the measures of AMC and PMC is not associated with the strength of the relationship between the PMC and AMC. The non-aligned measure makes it difficult to conclude if it has determined either children’s self-perception of their MC skills or their global self-perception (Liong et al., Citation2015). This lack of alignment may contribute to divergent profiles, requiring further research with better aligned measures. Furthermore, previous person-centred studies (Bardid et al., Citation2016; Estevan et al., Citation2019; De Meester et al., Citation2016) have used either a process-oriented or product-oriented assessment tool to measure AMC. Yet, research has stated that studies should include both process- and product-oriented measures to provide a more holistic understanding of MC (Hulteen et al., Citation2020; Logan et al., Citation2017). Given these issues, developing person-centred MC profiles which consider the contribution of either product-oriented or process-oriented measures with an aligned measure of PMC will extend the literature.
In addition, a key question which remains unanswered, is whether such MC-based profiles relate to any differences in health behaviours, including PA levels or key antecedents of PA such as autonomous motivation (Pannekoek et al., Citation2013; Sebire et al., Citation2013), which is considered the optimal form of motivation from the perspective of the Self-Determination Theory (SDT) (Deci & Ryan, Citation2000). Understanding the effect of MC profiles on health behaviours is imperative in order to influence PA and promote PA engagement among children (Bauman et al., Citation2002; Craggs et al., Citation2011). Although some studies have attempted to examine this issue in regard to PA behaviour (Estevan et al., Citation2019; De Meester et al., Citation2016) and autonomous motivation towards PA (Bardid et al., Citation2016; De Meester et al., Citation2016), the evidence base is sparse and limited by a lack of person-centred studies. As such, differences between MC profiles, autonomous motivation and PA remains unclear, especially amongst primary school children.
Therefore, this study sought firstly to identify if MC-based profiles existed among primary children based on their actual process MC and PMC and their actual product MC and PMC. Secondly, the objective of this study was to investigate whether there are differences in PA behaviour and motivation towards PA between British Primary school children with different profiles.
Method
Participants
Following ethics approval (P79015) written informed parental consent and child assent, two Hundred and Sixteen children aged seven to ten years (110 boys,106 girls; 8.6 ± 1.0 years; 134.4 ± 8.1 cm; 33.3 ± 9.4 kg), from three primary schools in central England participated in this study. The schools were selected using convenience sampling and were comparable in terms of ethnic makeup and classed as low-medium (4–7) socio-economic status for the county in which they live, falling within the most deprived national quintile for the area (Staffordshire County Council, Citation2016, Citation2018). All data was collected from January 2019 to June 2019.
Procedures
Actual process motor competences measure
The Test of Gross Motor Development (TGMD) second and third edition (D. A. Ulrich, Citation2017; D. Ulrich, Citation2000) was used to assess MC. TGMD is an extensively employed assessment tool (S. Logan et al., Citation2012; Morgan et al., Citation2013) due to the established validity and reliability (α = .76–.92) for this age group (D. Ulrich, Citation2000). Six skills were incorporated from the second revision of the TGMD (TGMD-2) (jump, run, hop, skip, overarm throw, and catch) and one skill from the third version (TGMD-3) (underarm throw). The removal of the strike from TGMD-2 was replaced with the underarm throw from TGMD-3, as the underarm throw is a more relevant skill for the population, due to the popular types of sport participation within the British population (Sports England, 2018). These seven specific skills were designated because five of them (jump, run, underarm throw, overarm throw, and catch) have been identified as the predominant skills to be targeted for development (aimed at children of the participating age) by the English National Curriculum for Physical Education (Department of Education, Citation2013). The remaining two (hop and skip) were included since they assess co-ordination and unipedal movement, both of which are considered important components within sports and sport participation (Lopes et al., Citation2011; Vandorpe et al., Citation2012).
In line with the TGMD-2/TGMD-3 protocol, each participant executed each skill three times and was video-recorded in sagittal plane (Nikon video camera, d500, Tokyo, Japan). The first trial was a test trial for the children to familiarise themselves with the movement. The second and third trials were analysed using Windows Media Player 2013 (Version: 12), enabling the videos to be slowed, replayed and scored using the process-oriented checklist (D. Ulrich, Citation2000). Assessment of the skills was conducted in line with the standard analytical procedure in the TGMD manual (D. Ulrich, Citation2000). Scores from the two trials (2nd and 3rd) were summarised, creating an overall composite process measure of MC (scored 0–54). Two experienced researchers analysed the MC videos, both of whom having been previously trained in three separate training sessions whereby they watched videoed skills of children’s skill performance and rated these against the “gold standard” rating. Consistent with prior research, training was considered complete when each observer’s scores for the two trials differed by no more than one unit from the instructor score for each skill (>80% agreement) (L. Barnett et al., Citation2013). Intraclass correlation coefficients for inter- and intra-rater reliability were .925 (95% CI = .87–.95) and .987 (95% CI = .94–.98) respectively, demonstrating good reliability (Jones et al., Citation2010; Koo & Li, Citation2016).
Actual product motor competence measures
Three product measurements of MC were employed as follows: standing long jump, seated medicine ball (1 kg) throw and 10 sprint time, which are commonly assessed product performance measurements (Logan et al., Citation2017), and have been previously identified as valid and reliable measures in children as young as 5 years old (Davis et al., Citation2008; Petersen, Citation2015). All measures were assessed following one demonstration by the trained researcher for familiarisation. 10-metre submaximal sprint, standing long jump and 1 kg seated medicine ball throw were conducted in-line with the standardised procedures (Davis et al., Citation2008; Fernandez-Santos et al., Citation2015; Rumpf et al., Citation2011) and in accordance with previously published protocols (Duncan et al., Citation2018; Eyre et al., Citation2020). Three trials were used, with the fastest time, longest jump and throw being used for analysis (Davis et al., Citation2008). Intraclass correlation coefficients for the three-product measures were .93 (CI [.91, .94]) for 10-m sprint, .96 (CI [.95,.97]) for standing long jump, and .95 (CI [.94,.97]) for seated medicine ball throw, indicating good reliability (Koo & Li, Citation2016). Each of the three product measures were converted into Z-scores and then summed creating an overall composite product measure of MC (10-m sprints were acknowledged that lower scores presented better performance and therefore on this task were made negative before creating the summed Z-score).
Perceived motor competence
PMC was assessed using the Pictorial Scale of Perceived Movement Skill Competence (PMSC) (L.M. Barnett et al., Citation2015), as it is based on the TGMD and is a reliable and valid aligned measurement tool for providing self-perceived movement skills in children (Lopes et al., Citation2016). The test consisted of 12 perceived AMC skills on two scales (locomotor skills and objective control skills). The PMSC was implemented one-on-one, in a quiet environment. It was conducted in accordance with the PMSC manual (L.M. Barnett et al., Citation2015). Scores from all 12 were summed for an overall PMC (0–48).
Motivation towards physical activity
Motivation towards PA was assessed using the adapted behavioural regulations in exercise questionnaire developed by Sebire et al. (Citation2013) which has shown to be a valid and reliable assessment to measure the type of motivation towards PA in British primary school children (Sebire et al., Citation2013). The questionnaire was administered on a separate day one-on-one in a quiet environment in order to reduce children influencing one another. The trained researcher verbally read through and conducted the questionnaire in line with the established protocol (Sebire et al., Citation2013).
The questionnaires consisted of four subscales measuring either intrinsic or external behavioural regulations. Items were scored using a 5-point likert-type scale (1 = not true for me-5 = very true for me). Internal consistencies of the four subscales as indexed by Cronbach’s alpha ranged between .720 and .800. An autonomous motivation composite score (range from 1 to 5) (Cronbach’s alpha = .903) was measured by calculating the average score of the three items from identified motivation and intrinsic motivation (Sebire et al., Citation2013).
Physical activity
PA was obtained through an objective measurement using the Actigraph GT3X (ActiGraphinc, Pensacola, Florida, USA), which is the most widely used and accurate method for assessing PA in children (Loprinzi & Cardinal, Citation2011; Migueles et al., Citation2017). Trained researchers initialised the Actigraph monitors using the Actilife software (version 6) and fitted them attached to the child’s dominant hand, which is valid device placement with high compliance (Fairclough et al., Citation2016). All accelerometers were worn for 7 consecutive days, 24-hrs a day except for water-based activities, collecting data in 5s epochs. Which is recommended to capture short bouts of activity occurring frequently within the age group (Migueles et al., Citation2017). Following this, monitors were uploaded to the Actilife software (version 6) and non-wear time was identified at 20-min windows of zero or non-zero counts (Cain et al., Citation2013). In line with Migueles et al. (Citation2017) review, Crouter et al. (Citation2012) cut-points were used to calculate time spent in average daily sedentary behaviour, light, moderate and vigorous PA. Of the 216 children that received the accelerometers, 112 children (52%) met the requirement wear time which was defined as at least 10hrs a day over four consecutive days including two weekend days (Migueles et al., Citation2017).
Data analysis
Identifying motor competence based profiles
In the current study, we conceptualised MC-based profiles as comprising combinations of both AMC and PMC, for example, high actual but low perceived MC. AS a consequence when the term MC profiles is used it refers to combinations of both AMC and PMC. To identify MC-based profiles, K-means cluster analysis, a popular and appropriate data-clustering algorithm (Hartigan & Wong, Citation1979; Kaushik & Mathur, Citation2014; Pham et al., Citation2005), was conducted to create profiles based on participants standardised z-scores for process MC scores and PMC scores. The same cluster analysis was then repeated to develop a further four profiles, but this time based on participants standardised z-scores for product MC and PMC scores. In each analysis, all participants were assigned to the most similar profile on the basis of their Euclidean distance from the data points to a centroid.
Differences between motor competence based profiles and PA behaviour and motivation towards PA
In order to investigate differences in PA and motivation towards PA between actual process and PMC profiles and between actual product and PMC profiles, multiple two way (sex*profiles) analysis of covariance (ANCOVA), controlling for age were conducted. Data conformed to the requirements for parametric statistical tests. Significance level was set at 0.05 and effect sizes were estimated using partial eta squared (η2p), and classified as; small (≥0.0099), medium (≥0.0588), or large (≥0.1379) (Richardson, Citation2011). Where any significant differences were found, Bonferroni corrected pairwise comparisons which were performed and reported alongside corresponding effect sizes (Cohens’s d, classified as; small (0.2), medium (0.5), large (0.8), or very large (1.3) (Cohen, Citation1988) and 95% confidence intervals (CI). Statistical analyses were conducted using the Statistical Package for Social Science (SPPS, version 25, IMB Corp, Armonk, New York) and graphical representation of figures in R (Version 3.5.3, Vienna, Austria), using the ggplot2 package (Wickham, Citation2009).
Results
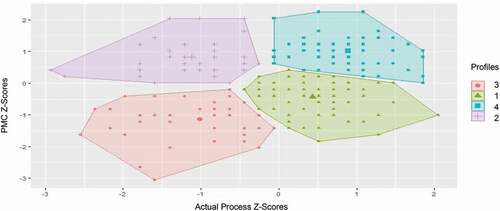
Four profiles were identified for both process and product MC-based profiles. The profiles were identified based on their relative scores (i.e. in comparison to the study sample) for both AMC (low, high) and for PMC (low, high).
The first profile (n = 83; 38.4%) was categorised by children who had divergent levels, comprising children who had relatively high actual process but relatively low perceived, labelled “high process-low” profile. The second profile (n = 40; 18.5%) was categorised by children who had divergent levels comprising children who had relatively low actual process but relatively high perceived, labelled “low process-high”. The final two profiles were categorised by children who had convergent levels. The third profile (n = 40; 18.5%) comprised children with relatively low actual process and relatively low perceived, labelled “low process-low”, and the fourth profile comprising children with relatively high actual process and relatively high perceived, labelled “high process-high” (n = 53; 24.5%) ().
Figure 1. Motor competence based profiles based on z-scores for actual process motor competence and perceived motor competence.
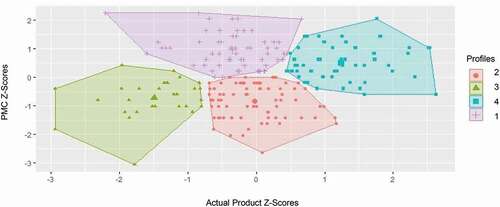
Similar to the above, two profiles were categorised by children who had divergent levels. However, the first profile (n = 65; 30.1%) comprised children who had relatively low actual product but relatively high perceived, labelled “low product-high”, whereas the second profile (n = 77; 35.6%), comprised children who had relatively high actual product but relatively low perceived, labelled “high product-low”. The final two profiles were categorised by children who had convergent levels. The third profile (n = 30; 13.9%) comprised children with relatively low actual product and relatively low perceived, labelled “low product-low”. The fourth profile comprised children with relatively high actual product and relatively high perceived, labelled “high product-high” (n = 44; 20.4%) ().
Figure 2. Motor competence based profiles based on z-scores for actual product motor competence and perceived motor competence.
Differences between motor competence based profiles and motivation towards physical activity
Analysis for motivation towards PA showed no significant Sex × Profile group interaction (p > 0.05). Age (p = .004; ŋ2 = .0.04; b = .169) was significant as a covariate, indicating that with every 1 year increase in age autonomous motivation decreased by 1.69. No significant main effect was found for sex or actual product and PMC profile (p > 0.05). However, a main effect was found for actual process and PMC profiles (p = .012; ŋ2 = .052)., where the “high process – high perceived” profile (4.37 ± .64), had higher levels of autonomous motivation to participate in PA compared to the “high process – low perceived” profile (3.92 ± .90) (p = .009; d = 0.6; 95%CI: .076, .805). No other significant differences between profiles were found ().
Figure 3. Mean ± SD of Autonomous Motivation towards PA of the four motor competence based profiles based on actual process motor competence and perceived motor competence.
Differences between motor competence based profiles and physical activity behaviour
ANCOVA analysis for sedentary time showed no significant Sex × Profile group interaction (p > 0.05). Age (p = .005; ŋ2 = .077; b = 11.909) was a significant covariate. There were no main effects for actual process and PMC profiles and actual product and PMC profiles (p > 0.05). However, there was a main effect of Sex (p = .025; ŋ2 = .049), where boys had higher sedentary time (180.92 ± 47.62) than girls (159.71 ± 27.86) (p = .025; d = 0.5; 95%CI: 2.257, 33.395).
Multiple ANCOVA analysis for time spent in light, moderate and vigorous activity showed no significant Sex × Profile group interaction (p > 0.05). Age (p = .001; ŋ2 = .101 b = −14.7) was a significant covariate for only vigorous activity, indicating that with every 1 year increase in age, vigorous activity decreased by 14.7 minutes. Additionally, there was no main effects for sex, actual process and PMC profiles and actual product and PMC (p > 0.05) ().
Table 1. Descriptive values according to profiles consisting of actual process and perceived motor competence
Table 2. Descriptive values according to profiles consisting of actual product and perceived motor competence
Discussion
The current study identified MC-based profiles in British Primary school children and the impact that these profiles have on PA behaviour and motivation towards PA. We add to the small body of work using a person-centred approach and uniquely identify that four MC-based profiles exist for both actual process and perceived profiles and actual product and perceived profiles (i.e. two divergent, two convergent). Furthermore, the current study investigated how different MC-based profiles might influence health behaviour. Overall findings showed only profiles that included actual process and PMC significantly influenced motivation towards PA. Children who attained high actual process MC and high perception of their MC skills demonstrated greater autonomous motivation towards PA compared to children who attain high actual process MC but had low perception of their MC skills. In addition, interestingly, none of the MC-based profiles were shown to influence objectively measured PA. No study to date has examined this issue and, as such, the current study makes an original contribution to the literature base related to MC for health.
Identifying profiles based on children’s actual process and perceived motor competence
Results of the current study demonstrate that MC profiles for actual and perceived MC exist among British children. The data indicate that two groups of children realistically estimated their own competence, by convergent levels of actual and perceived MC (high-high and low-low profiles), while two other groups of children unrealistically under/overestimated their competence, by divergent levels of actual and perceived MC (high-low and low-high profiles). Theory suggests that mostly children tend to have high PMC, especially younger children due to their cognitive limitations (Harter, Citation1999). However, this was not noticable in our data set which showed a similar proportion of children attaining low PMC to those attaining high PMC. In prior studies (Bardid et al., Citation2016; De Meester et al., Citation2020), findings have shown a large percentage of MC profiles displaying divergent levels (47–51%). However, there were concerns that the display of high levels of divergent profiles shown in previous studies may be due to the methodological approach, using non-aligned measures. Our results extend this work by including aligned measures of PMC with AMC and supports the conclusions of previous work with over a half of the children in the current study also displaying divergent levels in both MC-based profiles (i.e. actual process-perceived 56.9%; actual product-perceived 65.7%). Therefore, collectively the evidence base indicates that children need to be considered within these profiles in future research.
Differences between motor competence based profiles and motivation towards physical activity
Our data is the first to indicate that motivation towards PA was only affected by MC-based profiles that included actual process and perceived MC. This finding may be explained by the self-determination theory (SDT) which is a macro theory on why humans engage in PA. According to SDT, sources of motivation come from goal content which are either intrinsic or extrinsic (Deci & Ryan, Deci and Ryan, Citation2000). One of the most common intrinsic goals in children for exercise has been shown to be skill development (S. J. Sebire et al., Citation2008; Sebire et al., Citation2009). Children pursue and engage in exercise/PA in order to develop their skills and become proficient. This suggests that the influence of children’s motivation is the process of doing the skill, mastering something that is important rather than the score they are achieving (product). Therefore, children attaining high actual in product MC may not influence their motivation for PA as it does not directly relate to a goal content. Consequently, this identifies the importance of tool selection (i.e. use of actual process rather than actual product) when making informed decisions to improve motivation. Interventions should focus on developing the quality and execution of the skills first rather than the quantitative aspects of the skill (e.g. how a child runs, or jumps should be encouraged over focusing on how fast the child can run or how far they can jump) to improve motivation towards PA.
Specifically, analysis revealed children who displayed a combination of high process actual and low perceived MC were less autonomously motivated to participate in PA compared to children with the same level of actual process MC but higher levels of PMC (“high-high”). These findings are in agreement with previous research in Belgium where convergent high levels in children’s actual and perceived MC were associated with higher autonomous motivation for sports compared to children that had low levels of PMC (Bardid et al., Citation2016). These findings indicate that a child’s self-perception plays a key role for psycho-social factors relating to undertaking PA. Children may need to feel competent in order to be motivated, which influences the persistence in effort when facing barriers (Sebire et al., Citation2013; Teixeira et al., Citation2012). Developing children’s perception of their motor skill ability is thus of practical significance for teachers and coaches in sports and Physical Education settings. However, further exploration on the implementation of strategies to enhance self-perception is needed to help develop effective interventions that target children’s perception. Moreover, while perception is central, it is important not to consider PMC in isolation given that findings from the present study demonstrate the importance of developing perceived and actual MC simultaneously.
Differences between motor competence based profiles and physical activity behaviour
To our knowledge, this is the first study to examine whether objectively assessed PA (light, moderate and vigorous) and sedentary behaviour differ according to MC-based profiles. The findings, interestingly, identify that current PA behaviour does not differ by MC-based profiles. This is contrary to a recent study where differences in children’s PA behaviour were apparent between profiles. Children who had high levels in physical capacity and PMC were significantly more active than those children who had low capacity and medium perception, and those who had medium capacity and low perception (Estevan et al., Citation2019). Although the results relating to PA were unexpected based on prior literature (Hulteen et al., Citation2018; Lubans et al., Citation2010), it may be the lack of differences in profiles in their PA behaviour. This could be because the PA levels of the whole sample were relatively low and thus, the data may be more homogenous than anticipated when we conceptualised the data collection. In addition, the conflict in findings may be due to the different tools used to quantify PA. The current study used an objective assessment tool whereas Estevan et al. (Citation2019) used a subjective questionnaire. Such methods rely on recall, causing such tool to be problematic, especially among children (Chinapaw et al., Citation2010). Thus, levels of PA may less be accurate. Those that perceive their MC as high may also perceive themselves as being more physically active. Thus, may be why differences in PA levels between profiles are apparent in the work by Estevan et al. (Citation2019). However, one explanation for children with different MC-based profiles not displaying any significant disparity in PA behaviour, may be due to the effects of MC on PA taking time to develop given the complexity of such behaviour (Stodden et al., Citation2008). Given the theoretical basis anchored in SDT and the results of the current study it advocates, the development and maintenance of both actual and perceived MC in childhood may be imperative to children’s future PA behaviour and warrants further investigation.
Despite the novel insight provided by this study and the contribution it has made to existing literature by the inclusion of both process and product AMC, the use of aligned measurements and the objective measure of PA is not without limitation. Firstly, given the cross-sectional design cause and effect between study variables cannot be determined. Future exploratory and longitudinal studies should be conducted to gain an insight into these relationships. Secondly, differences between profiles may be less pronounced as profiles were not equal and only 52% of the participants met the requirement wear time for accelerometers. However, the sample size within the study was satisfactory to perform cluster analyses (Breckenridge, Citation2000). Nevertheless, a larger sample size would further support the identified profiles in the current study and would provide an opportunity to examine age differences in the alignment of actual and perceived MC and differences between PA behaviour and autonomous motivation.
Conclusion
The present study aimed to identify if MC-based profiles existed among British primary children and found four MC-based profiles, two convergent and two divergent, existed in both types of MC-based profiles (actual process-perceived, actual product-perceived). Furthermore, investigation into whether there were differences in health behaviour outcomes showed motivation towards PA to only be affected by MC profiles that included actual process and PMC. Children with convergent levels in actual process and PMC displayed higher levels of autonomous motivation compared to children who displayed divergent, high actual process but low perceived. As such, it is recommended that interventions should pay sufficient attention to developing both AMC and PMC and that the development of AMC should focus on developing children’s skill execution first rather than the outcome of the skill. Furthermore, although at present no differences in PA behaviour are found between the profiles, interventions should still develop and maintain both MC variables across childhood in order to positively impact on children’s future PA behaviour, given the effect of AMC and PMC on PA taking time to develop.
Disclosure statement
No potential conflict of interest was reported by the authors.
Additional information
Funding
References
- Babic, M. J., Morgan, P. J., Plotnikoff, R. C., Lonsdale, C., White, R. L., & Lubans, D. R. (2014). Physical activity and physical self-concept in youth: Systematic review and meta-analysis. Sports Medicine, 44(11), 1589–1601. https://doi.org/https://doi.org/10.1007/s40279-014-0229-z
- Bardid, F., De Meester, A., Tallir, I., Cardon, G., Lenoir, M., & Haerens, L. (2016). Configurations of actual and perceived motor competence among children: Associations with motivation for sports and global self-worth. Human Movement Science, 50, 1–9. https://doi.org/https://doi.org/10.1016/j.humov.2016.09.001
- Barnett, L. M., Ridgers, N. D., Zask, A., & Salmon, J. (2015). Face validity and reliability of a pictorial instrument for assessing fundamental movement skill perceived competence in young children. Journal of Science and Medicine in Sport, 18(1), 98–102. https://doi.org/https://doi.org/10.1016/j.jsams.2013.12.004
- Barnett, L., Minto, C., Lander, N., & Hardy, L. (2013). Interrater reliability assessment using the test of gross motor development-2. Journal of Science and Medicine in Sports, 17(6), 667–670. https://doi.org/https://doi.org/10.1016/j.jinf.2020.04.010
- Bauman, A. E., Sallis, J. F., Dzewaltowski, D. A., & Owen, N. (2002). Toward a better understanding of the influences on physical activity: The role of determinants, correlates, causal variables, mediators, moderators, and confounders. American Journal of Preventive Medicine, 23(2), 5–14. https://doi.org/https://doi.org/10.1016/S0749-37970200469-5
- Breckenridge, J. N. (2000). Validating cluster analysis: Consistent replication and symmetry. Multivariate Behavioral Research, 35(2), 261–285. https://doi.org/https://doi.org/10.1207/S15327906MBR3502_5
- Cain, K. L., Sallis, J. F., Conway, T. L., Dyck, D., & Van Calhoon, L. (2013). Using accelerometers in youth physical activity studies: A review of methods. Journal of Physical Activity & Health, 10(3), 437–450. https://doi.org/https://doi.org/10.1123/jpah.10.3.437
- Chinapaw, J. M., Mokkink, L. B., Van Poppel, M. N. M., Van Mechelen, W., & Terwee, C. B. (2010). Physical activity questionnaires for youth: A systematic review of measurement properties. Sports Medicine, 40(7), 539–563. https://doi.org/https://doi.org/10.2165/11530770-000000000-00000
- Clark, J., & Metcalfe, J. (2002). The mountain of motor development. In J. E. Clark & J. H. Humprehy (Eds.), Motor development research and reviews (Vol. 2, pp. 163–190). National Association of Sport and Physical Education.
- Cohen, J. (1988). Statistical power analysis for the behavioural sciences (3rd ed.). Lawrence Erlbaum Associates.
- Craggs, C., Corder, K., Van Sluijs, E. M. F., & Griffin, S. J. (2011). Determinants of change in physical activity in children and adolescents: A systematic review. American Journal of Preventive Medicine, 40(6), 645–658. https://doi.org/https://doi.org/10.1016/j.amepre.2011.02.025
- Crouter, S., Horton, M., & Basset, R. J. (2012). Use of a 2-regression model for estimating energy expenditure in children. Medicine and Science in Sports and Exercise, 44(6), 1177–1185. https://doi.org/https://doi.org/10.1249/MSS.0b013e3182447825
- Davis, K., Kang, M., Boswell, B., DuBose, K., Altman, S., & Binkley, H. (2008). Validity and reliability of the medicine ball throw for kindergarten children. Journal of Strength and Conditioning Research, 22(6), 1958–1963. https://doi.org/https://doi.org/10.1519/JSC.0b013e3181821b20
- De Meester, A., Barnett, L. M., Brian, A., Bowe, S. J., Jiménez-Díaz, J., Van Duyse, F., Irwin, J. M., Stodden, D. F., D’Hondt, E., Lenoir, M., & Haerens, L. (2020). The relationship between actual and perceived motor competence in children, adolescents and young adults: A systematic review and meta-analysis. Sports Medicine, 50(11), 2001–2049. https://doi.org/https://doi.org/10.1007/s40279-020-01336-2
- De Meester, A., Maes, J., Stodden, D., Cardon, G., Goodway, J., Lenoir, M., & Haerens, L. (2016). Identifying profiles of actual and perceived motor competence among adolescents: Associations with motivation, physical activity, and sports participation. Journal of Sports Sciences, 34(21), 2027–2037. https://doi.org/https://doi.org/10.1080/02640414.2016.1149608
- Deci, E. L., & Ryan, R. M. (2000). The “what” and “why” of goal pursuits: Human needs and self-determination of behavior. Psychological Inquiry, 11(4), 227–268. https://doi.org/https://doi.org/10.1207/S15327965PLI1104_01
- Department of Education. (2013). Physical education programmes of study: Key stages 1 and 2. The National Curriculum.
- Duncan, M. J., Jones, V., O’Brien, W., Barnett, L. M., & Eyre, E. L. J. (2018). Self-perceived and actual motor competence in young British children. Perceptual and Motor Skills, 125(2), 251–264. https://doi.org/https://doi.org/10.1177/0031512517752833
- Estevan, I., García-Massó, X., Molina García, J., & Barnett, L. M. (2019). Identifying profiles of children at risk of being less physically active: An exploratory study using a self-organised map approach for motor competence. Journal of Sports Sciences, 37(12), 1356–1364. https://doi.org/https://doi.org/10.1080/02640414.2018.1559491
- Eyre, E. L. J., Clark, C. C. T., Tallis, J., Hodson, D., Lowton-Smith, S., Nelson, C., Noon, M., & Duncan, M. J. (2020). The effects of combined movement and storytelling intervention on motor skills in South Asian and white children aged 5–6 years living in the United Kingdom. International Journal of Environmental Research and Public Health, 17(10), 3391. https://doi.org/https://doi.org/10.3390/ijerph17103391
- Fairclough, S., Noonan, R., Rowlands, A., VanHees, V., Knowles, Z., & Boddy, L. (2016). Wear compliance and activity in children wearing wrist and hip-mounted accelerometers. Medicine and Science in Sports and Exercise, 48(2), 245–253. https://doi.org/https://doi.org/10.1249/mss.0000000000000771
- Fernandez-Santos, J., Ruiz, J., Cohen, D., Gonzalez-Montesinos, J., & Castro-Pinero, J. (2015). Reliability and validity of tests to assess lower-body muscular power in children. Journal of Strength and Conditioning Reserach, 29(8), 2277–2285. https://doi.org/https://doi.org/10.1519/jsc.0000000000000864
- Harter, S. (1999). The construction of the self: A developmental perspective. Guilford Press.
- Hartigan, J., & Wong, M. (1979). A K-means clustering algorithm. Journal of the Royal Statistical Society, 28(1), 100–108. https://doi.org/https://doi.org/10.9756/bijdm.1106
- Howard, M. C., & Hoffman, M. E. (2018). Variable-centered, person-centered, and person-specific approaches: Where theory meets the method. Organizational Research Methods, 21(4), 846–876. https://doi.org/https://doi.org/10.1177/1094428117744021
- Hulteen, R. M., Morgan, P. J., Barnett, L. M., Stodden, D. F., & Lubans, D. R. (2018). Development of foundational movement skills: A conceptual model for physical activity across the lifespan. Sports Medicine, 48(7), 1533–1540. https://doi.org/https://doi.org/10.1007/s40279-018-0892-6
- Hulteen, R. M., True, L., & Pfeiffer, K. A. (2020). Differences in associations of product- and process-oriented motor competence assessments with physical activity in children. Journal of Sports Sciences, 38(4), 375–382. https://doi.org/https://doi.org/10.1080/02640414.2019.1702279
- Jones, R. A., Okely, A. D., Caputi, P., & Cliff, D. P. (2010). Perceived and actual competence among overweight and non-overweight children. Journal of Science and Medicine in Sport, 13(6), 589–596. https://doi.org/https://doi.org/10.1016/j.jsams.2010.04.002
- Kaushik, M., & Mathur, M. (2014). Comparative study of K-means and hierarchical clustering techniques. International Journal of Software & Hardware Research in Engineering, 2(6), 93–98. https://doi.org/https://doi.org/10.30534/ijeter/2020/20852020
- Koo, T. K., & Li, M. Y. (2016). A guideline of selecting and reporting intraclass correlation coefficients for reliability research. Journal of Chiropractic Medicine, 15(2), 155–163. https://doi.org/https://doi.org/10.1016/j.jcm.2016.02.012
- Liong, G. H. E., Ridgers, N. D., & Barnett, L. M. (2015). Associations between skill perceptions and young children’s actual fundamental movement skills. Perceptual and Motor Skills, 120(2), 591–603. https://doi.org/https://doi.org/10.2466/10.25.PMS.120v18x2
- Logan, S. W., Barnett, L. M., Goodway, J. D., & Stodden, D. F. (2017). Comparison of performance on process- and product-oriented assessments of fundamental motor skills across childhood. Journal of Sports Sciences, 35(7), 634–641. https://doi.org/https://doi.org/10.1080/02640414.2016.1183803
- Logan, S. W., Ross, S. M., Chee, K., Stodden, D. F., & Robinson, L. E. (2018). Fundamental motor skills: A systematic review of terminology. Journal of Sports Sciences, 36(7), 781–796. https://doi.org/https://doi.org/10.1080/02640414.2017.1340660
- Logan, S., Robinson, L. E., Wilson, A. E., & Lucas, W. A. (2012). Getting the fundamentals of movement: A meta-analysis of the effectiveness of motor skill interventions in children. Child: Care, Health and Development, 38(3), 305–315. https://doi.org/https://doi.org/10.1111/j.1365-2214.2011.01307.x
- Lopes, V. P., Barnett, L. M., Saraiva, L., Gonçalves, C., Bowe, S. J., Abbott, G., & Rodrigues, L. P. (2016). Validity and reliability of a pictorial instrument for assessing perceived motor competence in Portuguese children. Child: Care, Health and Development, 42(5), 666–674. https://doi.org/https://doi.org/10.1111/cch.12359
- Lopes, V. P., Rodrigues, L. P., Maia, J. A. R., & Malina, R. M. (2011). Motor coordination as predictor of physical activity in childhood. Scandinavian Journal of Medicine & Science in Sports, 21(5), 663–669. https://doi.org/https://doi.org/10.1111/j.1600-0838.2009.01027.x
- Loprinzi, P. D., & Cardinal, B. J. (2011). Measuring children’s physical activity and sedentary behaviors. Journal of Exercise Science and Fitness, 9(1), 15–23. https://doi.org/https://doi.org/10.1016/S1728-869X1160002-6
- Lubans, D. R., Morgan, P. J., Cliff, D. P., Barnett, L. M., & Okely, A. D. (2010). Fundamental movement skills in children and adolescents: Review of associated health benefits. Sports Medicine, 40(12), 1019–1035. https://doi.org/https://doi.org/10.2165/11536850-000000000-00000
- Migueles, J. H., Cadenas-Sanchez, C., Ekelund, U., Nyström, C. D., Mora-Gonzalez, J., Löf, M., Labayen, I., Ruiz, J. R., & Ortega, F. B. (2017). Accelerometer data collection and processing criteria to assess physical activity and other outcomes: A systematic review and practical considerations. Sports Medicine, 47(9), 1821–1845. https://doi.org/https://doi.org/10.1007/s40279-017-0716-0
- Morgan, P. J., Barnett, L. M., Cliff, D. P., Okely, A. D., Scott, H. A., Cohen, K. E., & Lubans, D. R. (2013). Fundamental movement skill interventions in youth: A systematic review and meta-analysis. Pediatrics, 132(5), 1361–1383. https://doi.org/https://doi.org/10.1542/peds.2013-1167
- Pannekoek, L., Piek, J., and Hagger, M. . (2013). Motivation for physical activity in children: A moving matter in need for study. Human Movement Science, 32(5), 1097–1115. https://doi.org/https://doi.org/10.1016/j.humov.2013.08.004
- Petersen, D. (2015). Power. In T. Miller (Ed.), NSCA’s guide to tests and assessments (pp. 217–252). Human.
- Pham, D. T., Dimov, S. S., & Nguyen, C. D. (2005). Selection of K in K-means clustering. proceedings of the institution of mechanical engineers. Part C: Journal of Mechanical Engineering Science, 219(1), 103–119. https://doi.org/https://doi.org/10.1243/095440605X8298
- Richardson, J. T. E. (2011). Eta squared and partial eta squared as measures of effect size in educational research. Educational Research Review, 6(2), 135–147. https://doi.org/https://doi.org/10.1016/j.edurev.2010.12.001
- Robinson, L. E., Stodden, D. F., Barnett, L. M., Lopes, V. P., Logan, S. W., Rodrigues, L. P., & D’Hondt, E. (2015). Motor competence and its effect on positive developmental trajectories of health. Sports Medicine, 45(9), 1273–1284. https://doi.org/https://doi.org/10.1007/s40279-015-0351-6
- Robinson, L. E. (2011). The relationship between perceived physical competence and fundamental motor skills in preschool children. Child: Care, Health and Development, 37(4), 589–596. https://doi.org/https://doi.org/10.1111/j.1365-2214.2010.01187
- Rumpf, M., Cronin, J., Oliver, J., & Hughes, M. (2011). Assessing youth sprint ability methodological issues, reliability and performance data. Pediatric Exercise Science, 23(4), 442–467. https://doi.org/https://doi.org/10.1123/pes.23.4.442
- Sebire, S. J., Jago, R., Fox, K. R., Edwards, M. J., & Thompson, J. L. (2013). Testing a self-determination theory model of children’s physical activity motivation: A cross-sectional study. International Journal of Behavioral Nutrition and Physical Activity, 10(1), 1–9. https://doi.org/https://doi.org/10.1186/1479-5868-10-111
- Sebire, S. J., Standage, M., & Vansteenkiste, M. (2008). Development and validation of the goal content for exercise questionnaire. Journal of Sport & Exercise Psychology, 30(4), 353–377. https://doi.org/https://doi.org/10.1123/jsep.30.4.353
- Sebire, S. J., Standage, M., & Vansteenkiste, M. (2009). Examining intrinsic versus extrinsic exercise goals: Cognitive, affective, and behavioral outcomes. Journal of Sport & Exercise Psychology, 31(2), 189–210. https://doi.org/https://doi.org/10.1123/jsep.31.2.189
- Staffordshire County Council. (2016). Staffordshire: Locality profile insight, planning & performance team commissioning. p. 4–8.
- Staffordshire County Council. (2018). Locality Profile. p. 29.
- Stodden, D. F., Langendorfer, S. J., Goodway, J. D., Roberton, M. A., Rudisill, M. E., Garcia, C., & Garcia, L. E. (2008). A developmental perspective on the role of motor skill competence in physical activity: An emergent relationship. Quest, 60(2), 290–306. https://doi.org/https://doi.org/10.1080/00336297.2008.10483582
- Teixeira, P. J., Carraça, E. V., Markland, D., Silva, M. N., & Ryan, R. M. (2012). Exercise, physical activity, and self-determination theory: A systematic review. The International Journal of Behavioral Nutrition and Physical Activity, 9(1), 78. https://doi.org/https://doi.org/10.1186/1479-5868-9-78
- Ulrich, D. A. (2017). Introduction to the special section: Evaluation of the psychometric properties of the TGMD-3. Journal of Motor Learning and Development, 5(1), 1–4. https://doi.org/https://doi.org/10.1123/jmld.2017-0020
- Ulrich, D. (2000). Test of gross motor development. 2nd ed Prod Ed Publishers p. 1 - 60.
- Vandorpe, B., Vandendriessche, J., Vaeyens, R., Pion, J., Matthys, S., Lefevre, J., Philippaerts, R., & Lenoir, M. (2012). Relationship between sports participation and the level of motor coordination in childhood: A longitudinal approach. Journal of Science and Medicine in Sport, 15(3), 220–225. https://doi.org/https://doi.org/10.1016/j.jsams.2011.09.006
- WHO (2020). Guidelines on physical activity and sedentary behavior. Geneva, WHO.
- Wickham, H. (2009). Ggplot2: Elegant graphics for data anaylsis. Springer.