
 ?Mathematical formulae have been encoded as MathML and are displayed in this HTML version using MathJax in order to improve their display. Uncheck the box to turn MathJax off. This feature requires Javascript. Click on a formula to zoom.
Abstract
In our previous animal model study, we found that radiofrequency (RF) ablation of pre-frozen tumor resulted in improved therapeutic effects. To understand the underlying mechanisms and optimize the treatment protocol, the RF heating pattern in pre-frozen tissue was studied in this paper. Both ex vivo and in vivo experiments were conducted to compare the temperature profiles of RF heating with or without pre-freezing. Results showed that the heating rate of in vivo tissues was significantly higher with pre-freezing. However, little difference was observed in the heating rate of ex vivo tissues with or without pre-freezing. In the histopathologic analysis of in vivo tissues, both a larger ablation area and a wider transitional zone were found in the tissue with pre-freezing. To investigate the cause for the enhancement in RF heating, the parameters affecting the tissue temperature rise were studied. It was found that the electrical conductivity of in vivo tissue with pre-freezing was much higher at low frequencies, but little difference was found at the 460 kHz frequency commonly used in clinical applications. A finite element model for RF heating was developed and validated to fit the thermal conductivity of in vivo tissue including effects of pre-freezing and the associated blood perfusion rate. Results showed that the enhancement of the heating rate was primarily attributed to the decreased blood perfusion rate in the tissue with vascular damage caused by pre-freezing. The ablation volume was increased by 104% due to the reduced heat dissipation.
1. Introduction
Minimally invasive thermal ablation of tumors is gaining attention along with the development of modern imaging and computerized surgical guidance techniques for probe insertion. Percutaneous radiofrequency ablation (RFA) is one of the thermal modalities that have been accepted as an alternative to surgical resection for hepatocellular carcinoma treatment [Citation1–3]. During RFA treatment, high-frequency alternating current induces frictional heating when ions and polar molecules oscillate in the electro-magnetic field, resulting in temperature increases above 60 °C in tissue. These high temperatures cause denaturation of the proteins and nucleus, inducing either direct necrosis or apoptosis of the tumor cells. In contrast to the RFA, cryotherapy ablates tumors through deep freezing of the targeted tissue (i.e., <–40 °C), resulting in direct cell death by either intracellular ice formation or significant cellular dehydration. Disruption of blood flow and damage of tumor vasculature induced by freezing could further damage the targeted tissue [Citation3].
However, there are still some concerns associated with these therapies in clinic application. Cryotherapy use is limited due to high rates of both serious hemorrhage and local recurrence [Citation4–6]. For RFA, its therapeutic efficacy decreases with targeted tumor volume. Because, the RF energy is concentrated at the probe tip, continuing to increase the applied energy to treat larger volumes results in local tissue carbonization that blocks RF conduction and limits heating [Citation7,8]. Moreover, some researchers have found that incomplete ablation existed at the tumor edge due to cooling of blood perfusion [Citation9–11].
New strategies have been proposed to enhance the effects of thermal ablation. In our previous animal model study, we have found that RFA in pre-frozen tumor achieved a better therapeutic outcome. Pre-freezing tissue followed by RF heating treatment not only directly killed the tumor cells, but the tumor associated immune-suppression environment was also altered and anti-tumor immunity was stimulated [Citation12–14]. Takahashi et al. [Citation15] have also found improved ablation using similar combination therapies. Further, heating of the pre-frozen tissue caused much greater injury to tumor microvasculature, as reported by Shen et al. [Citation16,17]. Hachisuka et al. [Citation18] have combined cryosurgery with radiofrequency treatment for un-resectable breast cancer skin metastases that were resistant to chemotherapy and radiotherapy.
The thermal damage in tissue is closely related to temperature transients, namely the thermal history experienced by the tissue. The pre-freezing significantly changes tissue properties that would influence the temperature rise in tissue during the RF heating. Thus, it is essential to study the tissue property changes and temperature transients that occur during the thermal treatment, for the purpose of more effective surgical planning in clinical applications. In this study, both ex vivo and in vivo experiments were performed to compare the heating patterns in tissues with or without pre-freezing. Histopathological analysis of in vivo tissue was carried out to observe the ablation volume and the histological changes. To investigate the main cause of the heating pattern change, three parameters closely related to the RF heating were studied, namely the electrical conductivity, thermal conductivity, and perfusion [Citation19,20]. The electrical conductivity was experimentally measured. A finite element model was developed to numerically study both the thermal conductivity and blood perfusion rate. The spatial and temporal temperature profiles of RF heating pattern in in vivo tissue undergone pre-freezing process were obtained and the volume of the heated tissue quantified.
2. Materials and methods
2.1. RF heating experiment
Both ex vivo and in vivo experiments were performed to compare the temperature transients during the RF heating processes. Three freshly excised porcine livers were prepared for ex vivo RF heating experiments. Two locations near the center, but sufficiently spatially separate to have no effect on each other, were selected in each porcine liver for two different treatments: (a) RF heating without pre-freezing and (b) RF heating with pre-freezing. For the treatment of RF heating without pre-freezing, a commercial RF bipolar probe (Olympus-Celon, Germany) and an in-house RF generator [Citation13,14] were used. The bipolar RF probe has an active length of 2 cm. Four thermocouples were inserted to record temperatures at different locations in tissue during RF heating. To fix the relative positions of the thermocouples and RF probe, we designed and fabricated a fixture with channels. The middle channel was for the RF probe insertion, and the others for the thermocouples. As shown in , the four thermocouples were 4, 5, 8, and 10 mm apart from the RF probe, respectively. The insertion depth of the RF probe was 2 cm, and the tips of thermocouples were 1 cm above. The voltage supplied to the RF probe was controlled at a constant level of 30 V at 460 kHz, and the heating duration was 3 min. For the treatment of RF heating with pre-freezing, the liver was first frozen with a cryosurgery system developed in our laboratory consisting of a cryoprobe, a control panel, a vacuum pump (VP0125, NITTO) and a liquid nitrogen tank as shown in [Citation21]. The cryoprobe was designed with a cylinder-shaped tip of 10 mm in diameter, which was made of medical stainless steel. To pre-freeze the tissue, it was attached to the liver surface, and liquid nitrogen was delivered from liquid nitrogen tank to the cryoprobe through vacuum pump. The power of the pump was set at 15 W to maintain a constant liquid nitrogen flow rate. The temperature of the probe surface in contact with tissue was measured by a thermocouple located in between. Freezing stopped when the diameter of the ice area on the tissue surface reached 2.5 cm. The total freezing time was about 8 min. After freezing, a thawing time of 15 min was allowed to ensure the tissue temperature return to the room temperature. The RF probe and thermocouples were then inserted into the center of the pre-freezing area and a similar RF heating process as mentioned above followed.
Figure 1. (a) The bipolar RF probe and the four thermocouples fixed together by the supporting structure; (b) the cryoprobe with a cylinder shaped tip of 10 mm in diameter; (c) schematic of the RF probe and the four thermocouples inserted inside the liver tissue; (d) illustration of the freezing process by the cryoprobe. The cryoprobe directly touched the liver, and liquid nitrogen was transported to the tip of the probe via the control system; (e) illustration of the electrical conductivity measurement experiments. The electrodes 1, 2,3, 4 contacted the surface of the measuring tissue. An alternated electrical current with different frequency was input to the electrode 1 and back through the electrode 4. The voltage difference between the electrode 2 and 3 was recorded.
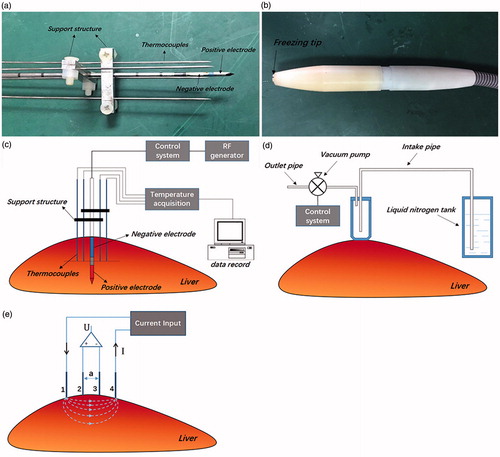
For in vivo experiments, three New Zealand white rabbits were used. The weight of each rabbit was 2–3 kg. A 22-G × 1-inch IV catheter was inserted into the dorsal ear vein and an intravenous injection of 1 ml/kg of a 3% of sodium pentobarbital solution was made for anesthesia. In the experiment, the rabbit was placed in the supine position, and a midline laparotomy incision was performed to expose the liver. Among the three lobes of liver in a rabbit, the two most proximal lobes to the incision were chosen for the experiments. The RF heating without pre-freezing was performed in one lobe, and the treatment with pre-freezing was followed in the other lobe. Since, the experiments were carried out on different lobes, these were considered as independent measurements. The treatment protocols were similar to those of ex vivo experiments described above, except that the voltage applied to the RF probe was set at 28.5 V to avoid dehydration and carbonization in the smaller volume of liver tissue.
All animal experiments were approved by the Animal Welfare Committee of Shanghai Jiao Tong University and experimental methods were performed in accordance with institutional guidelines.
2.2. Histopathology
Typical paraffin sectioning method was used for histological analysis of the lesions from different treatment conditions [Citation22–24]. Immediately after the treatments, the lesions were dissected from the livers and fixed in 10% neutral buffered formalin. After being fixed, each specimen was divided into two halves through a cross-sectional incision (perpendicular to the RF probe). Then, the divided parts were embedded in paraffin with the incision surface face down. Subsequent slicing of the tissue starts from the incision face. The slices were stained with hematoxylin and eosin for light microscopy observation.
2.3. Parametric analysis
2.3.1. Electrical conductivity measurements
As change of the electrical conductivity would strongly influence the energy distribution within the tissue and thus the extent of the thermal lesion caused by RFA [Citation25], experiments were designed to measure the electrical conductivities of tissues under different conditions. The four-electrode method [Citation26,27] was used, and the impedance of the liver tissue between the electrodes was measured, and the electrical conductivity was calculated from the impedance measurement. As shown in , an in-house four-electrode probe calibrated by standard KCl solution was in contact with the tissue surface, where the distance between two adjacent electrodes was 5 mm. Electrodes 1 and 4 were used for current input, while electrodes 2 and 3 used for voltage measurement by the impedance analyzer (Agilent, E4980A). Between electrodes 1 and 4, an alternating current (root mean square value of 20 mA) at frequencies ranging from 1 kHz to 2 MHz was applied. Thus, the tissue impedance at different frequencies was obtained and described by an imaginary number
. The impedance analyzer directly read the magnitude
and the phase
of the complex impedance. Another three rabbits were used for the electrical conductivity measurements. First, a laparotomy was performed to expose the liver. The four-electrode probe was placed in the same location on the middle region of the liver. In each rabbit, one lobe of the liver was selected, and the measurement process was carried out in tissue under three different conditions: (a) normal; (b) pre-freezing; and (c) after heating with pre-freezing. Before any thermal treatment, the impedance Z(ω) was recorded under condition (a). Then, the tissue was frozen using the same protocol as described above. After thawing, the second measurements were carried out under condition (b). Subsequently, the pre-frozen zone was subjected to the RF heating at the voltage of 22.5 V at 460 kHz for 30 s. Lower voltage and shorter heating time were used here to induce thermal stress rather than tissue coagulation. When the heating completed, the tissue was allowed to cool back to the normal body temperature. Then, the third measurements were made under condition (c). Impedance measurements were repeated for each of these conditions using different RF frequencies. Impedance data were collected over a time period of more than 30 s for each measurement, and the median was taken as the measurement value under each condition.
As the tissue thickness was much larger than the distance between the electrodes used, according to Steendijk et al.’s study [Citation26], the tissue can be assumed to be a semi-infinite conductor, and the frequency-dependent electrical conductivity was calculated as [Citation26] follows:
(1)
(1)
where
is the distance between two adjacent electrodes (a = 5 mm) and
is the equivalent resistance of tissue.
Considering tissue as a parallel circuit of resistance and capacitance, the equivalent resistance of tissue was calculated from its impedance as [Citation27] follows:
(2)
(2)
(3)
(3)
2.3.2. Thermal conductivity and blood perfusion rate simulation
Blood perfusion rate and the thermal conductivity were two important thermal properties determining heat transfer in biological systems [Citation28]. Both the freezing and heating processes can have significant influence on the local blood supply in tissue [Citation29,30]. A finite element model was developed and used to fit the measured temperature transients for the blood perfusion rate and thermal conductivity analyses.
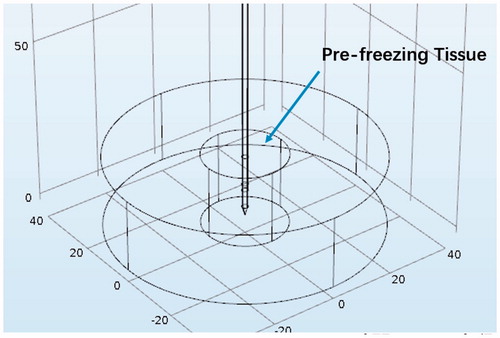
The rabbit liver was modeled as a cylinder with a diameter of 8 cm and a height of 2.25 cm as shown in . The frozen region was considered as a smaller cylinder with a diameter of 2.5 cm and the height of 2.25 cm. For the RF heating without pre-freezing, the whole cylinder model was assumed to have the properties of normal liver tissue.
Figure 2. Illustration of the computational domain. The large cylinder was the edge of the surrounding tissue, while the small cylinder was the region that had been frozen.
As the RF frequency used was 460 kHz, the wavelength was much larger than the tissue dimension. Thus, a quasi-static approximation was used to simulate the electric field [Citation31,32]:
(4)
(4)
where V and σ are the voltage and the electrical conductivity, respectively.
The boundary conditions for the electrical field were as follows:
(5)
(5)
(6)
(6)
EquationEquation (5)(6)
(6) describes a constant voltage applied between two electrodes, while EquationEquation (6)
(7)
(7) is the Neumann boundary condition used at the air-tissue interface for all models.
The specific heat absorption rate () was calculated as follows:
(7)
(7)
The tissue heat transfer was described by the Pennes’ bioheat transfer equation [Citation32]:
(8)
(8)
where ρ is the mass density, c the specific heat capacity, T the tissue temperature, k the thermal conductivity, and
the blood perfusion rate. The metabolic rate was considered negligible due to its minimal effect during heating:
[Citation32].
A natural convection boundary condition was used for the outer surfaces exposed to air:
(9)
(9)
where
was set at 25
, and
= 25 °C as measured during the experiments. The initial temperatures of tissue and blood were set at 37.5 °C.
The properties of rabbit liver used in the numerical model are shown in . The electrical conductivities of the normal and frozen tissue were obtained from the above-mentioned measurement. The thermal conductivity of normal liver tissue has been reported to be 0.49 (W/m·K) in literature [Citation33–35]. For the frozen tissue in vivo, blood flow fully ceased, which changed the apparent thermal conductivity of tissue. The thermal conductivity of the frozen tissue was fitted from the experimental data. For the blood perfusion rate, some previous work has been done to identify changes in blood flow induced by freezing. Schüder et al. [Citation30] reported that freezing of liver tissue to temperatures less than 0 °C could cause complete perfusion failure lasting for an extended period of time. Shen et al. [Citation16,17] has also claimed that the process of freezing followed by heating resulted in severe vascular injury due to the thermal stress. Thus, the blood perfusion rate of the pre-frozen tissue was set to be zero. Meanwhile, the blood perfusion rate of normal liver tissue could be substantially affected by the tissue temperature during the RF heating, and the reported data in the literature are quite variable [Citation36,37]. Thus, the enhanced blood perfusion rate of tissue without pre-freezing also needed to be determined and was obtained by fitting with the measured temperature profiles in the in vivo experiments using the least-squares method. All the simulations were carried out in COMSOL Multiphysics 5.2.
Table 1. The electrical and thermophysical properties used in numerical model.
Table 2. The electrical conductivity measured for the in vivo liver tissue after different treatments at three selected frequencies.
2.4. Prediction of 3D thermal range
The model developed was further used to compare the 3D thermal fields of these two treatment modalities and obtain the corresponding spatial and transient temperature profiles during the heating processes. The geometry shown in was modified to illustrate the entire temperature distribution on the scale of the human liver, where the diameter and height of the outer cylinder were changed to 10 cm corresponding to the liver, and the inner cylinder 5 cm corresponding to the pre-frozen region where the tumor is located. The theoretical model was the same as the previous listed in Section 2.3.2, except for the RF heating protocols. Due to changes in patient impedance during clinical use, power control is more stable and mostly used for RFA. Therefore, the power was set at a constant of 5 W, as recommended by the clinical handbook for the Olympus-Celon system [Citation38].
2.5. Statistical analysis
Temperature and impedance measurements were recorded and expressed as means with standard deviations. Electrical conductivity was calculated from the impedance. Statistical significance was established using the two-tailed Student’s t-test at p < .05. The mean values of temperature recorded of in vivo tissues were used in the simulations. OriginPro 2015 (OriginLab, Northampton, MA) was used for all analyses.
3. Results
3.1. RF heating experiments
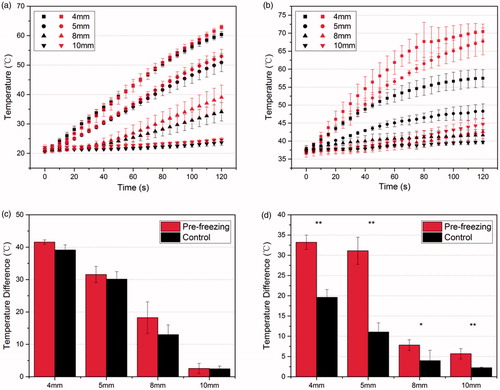
The temperature transients at the points (as shown in ) were recorded by the thermocouples. When freezing, the lowest temperature recorded on the cryoprobe surface in contact with tissue was –110 °C. shows the temperature increases during the RF heating for the ex vivo and in vivo experiments, respectively. The red symbols correspond to the group receiving RF heating with pre-freezing, and the black symbols are for the group with RF heating applied without pre-freezing. The total duration of RF heating was 3 min, and significant dehydration and carbonization took place in the in vivo tissue after 2 min of heating with pre-freezing, and the temperature curve becomes irregular. Therefore, we only used the temperature data in the first 2 min for all analyses and subsequent simulation studies. It could be seen that for the in vivo experiments (), the rate of temperature elevation in the tissue with pre-freezing was significantly higher than that in tissue without pre-freezing. In 2 min of RF heating, the highest temperature recorded was more than 70 °C in tissue for the RF heating with pre-freezing, but less than 60 °C in tissue without pre-freezing. While, for the ex vivo experiments (), there was very little difference found in temperature elevation rates between the two conditions. shows the magnitudes of temperature elevation at each measurement point after 2 min. In the in vivo experiments, there was a significant difference in the magnitude at each measurement point between the two conditions (p < .05). However, the results of the ex vivo experiments showed no statistically significant difference.
Figure 3. (a,b) Temperature developments at different points in the tissue by RF heating with (red marks) or without (black marks) pre-freezing; (c,d) the magnitude of temperature rising at each measurement point after 2 min; (a,c) ex vivo experiments. The voltage applied was 30 V; (b,d) in vivo experiments. The voltage applied was 28.5 V. Data shown as means with standard deviations (n = 3, *p < .05, **p < 01).
3.2. Histopathology
In , histology images from the rabbit liver are shown for the lesions caused by RF heating with and without pre-freezing. Histologic slices were obtained approximately perpendicular to the RF probe. Surrounding the RF probe track (the hollow portion in ), a distinct thermal lesion is seen under both treatment conditions. In , rows H1, H2, and H3 show images of three distinct histologic zones. The central region of the lesion (zone H1) contains enlarged sinusoids and preserved hepatocytes that are shrunken in volume (). In most of the cells, the nuclei are smaller and somewhat pyknotic, and the cytoplasm shows evidence of contraction band necrosis or coagulative necrosis. More distal from the lesion center, there is a transition zone (zone H2) filled with red cells and more extracellular space than normal liver tissue (zone H3), where the cell nuclei are also smaller and somewhat pyknotic. Compared with the RF heating without pre-freezing, more red cells and more fragmented tissue structures are found in zone H2 treated by RF heating with pre-freezing.
Figure 4. H&E stain images of in vivo tissue. (a) Overall view of the ablated tissue treated by RF heating only. Three distinct zones are identified; (b–d) the enlarged view of zone H1/H2/H3 from (a); (e) overall view of the ablated area treated by RF heating with pre-freezing with the zones specified; (f–h) the enlarged view of zone H1/H2/H3 from (e). The center of the ablation area is the necrosis coagulation zone (H1). The middle zone (H2) is the transition zone, with interstitial infiltration of red blood cells. The outermost zone (H3) is the normal tissue.
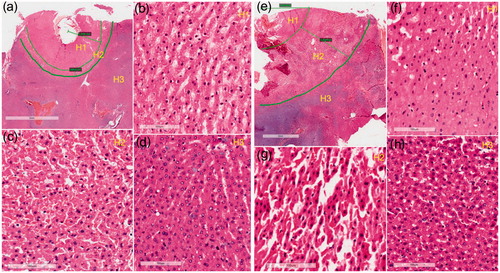
Statistically (n = 3), for the RF lesions without pre-freezing, the bandwidths of zone H1 and zone H2 were and
, respectively. For the RF lesions with pre-freezing, the bandwidths of zone H1 and zone H2 were
and
. Therefore, both H1 and H2 zone were considerably enlarged (p < .05 and p < .01, respectively) for the pre-freezing case.
3.3. Parametric analyses
3.3.1. Electrical conductivity
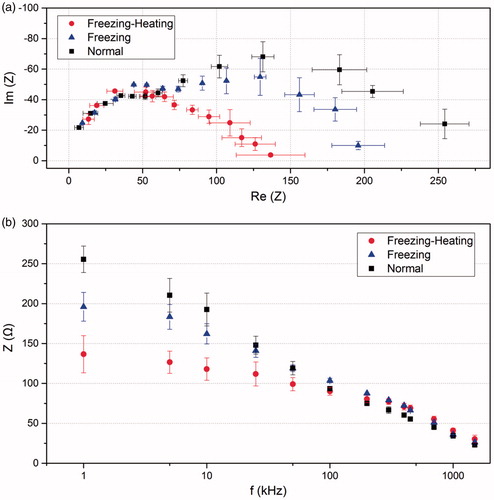
The measured impedance Z() in rabbit liver under three different conditions (normal, heated with pre-freezing, and heated without pre-freezing) are plotted in as a Cole-Cole plot with the horizontal coordinate being the real part of the impedance and the vertical coordinate being the imaginary part. From the right-most data point to the far-left data point, the frequency applied increases from 1 kHz to 2 MHz. At lower frequencies, the data points under the three conditions show substantial scatter. However, as the frequency increases, these data points gradually converge. shows the modulus of impedance as a function of the frequency. At lower frequencies, the value of impedance modulus for the pre-freezing-heating group is much smaller than that of the other two groups. With increasing frequency, the modulus of impedance decreases and the gap between different conditions diminishes. Data gradually converge when the frequency is larger than 100 kHz.
Figure 5. (a) Comparison of the complex impedance of the in vivo rabbit liver at different frequencies (from the right-most to the far-left: 1, 5, 10, 25, 50, 100, 200, 300, 400, 460, 700, 1000, 1500 kHz) in different groups; (b) the modulus of the impedance at different frequencies for tissue in different groups. Data shown as means with standard deviations (n = 3).
Based on EquationEquations (1)(2)
(2) and Equation(3)
(4)
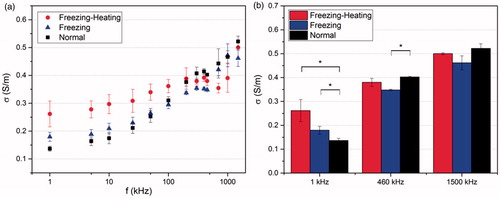
(4) , the electrical conductivities were calculated. shows the electrical conductivity as a function of frequency under the three conditions. At lower frequencies, the electrical conductivity of the normal tissue is smaller than that of the other two groups. As the frequency increasing, the electrical conductivity shows a rising trend, and the electrical conductivity of normal tissue increases the most. Three representative frequencies 1 kHz, 460 kHz and 1500 kHz were selected for analysis as shown in and . At 1 kHz, the electrical conductivity of freezing-heating group was nearly double that of the normal tissue. However, at the frequency of 460 and 1500 kHz, the electrical conductivity of freezing-heating group was slightly smaller than that of the normal tissue with no significant difference.
Figure 6. (a) Electrical conductivity of in vivo rabbit liver changing with frequency; (b) electrical conductivity at three selected frequency. Data shown as means with standard deviations (n = 3, *p < .05, **p < .01).
3.3.2. Thermal conductivity and blood perfusion rate
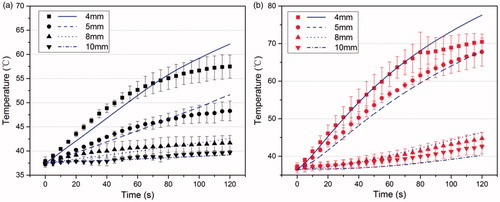
According to the above experimental studies, the electrical conductivity in the model was set at 0.402 S/m for the normal tissue and 0.380 S/m for the pre-frozen tissue. The least squares method was used to fit the blood perfusion rate of the in vivo tissue during the RF heating without pre-freezing at given thermal conductivity, and the thermal conductivity of the in vivo tissue during the RF heating with pre-freezing at zero blood perfusion. shows the temperature profiles of the simulated data using the fitted properties (blue lines) and experimental results (black or red symbols), where is for the RF heating without and with pre-freezing, respectively. The fitted thermal conductivity of the pre-freezing tissue was 0.47 W/m·K, representing the apparent or effective thermal conductivity, which was close to the reported data for normal liver tissue [Citation33–35]. The fitted blood perfusion rate of normal tissue during the RF heating process was 0.053 l/s, which was greater than that reported in the literature [Citation39,40].
Figure 7. The transient temperature at different points obtained by simulations (lines) and experiments (marks) in the living tissue. (a) RF heating without pre-freezing. The perfusion rate of normal tissue is simulated to be 0.053 (l/s); (b) RF heating with pre-freezing. The thermal conductivity of pre-frozen tissue is simulated to be 0.47 (W/m?K).
3.4. RF heating ablation volume prediction
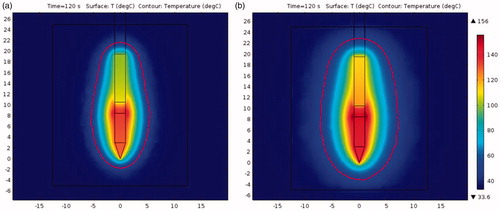
With the above obtained properties (the electrical conductivity and blood perfusion rate of normal tissue were 0.402 S/m and 0.053 l/s, respectively, and the electrical conductivity and thermal conductivity of pre-freezing tissue were 0.38 S/m and 0.47 W/m·K, respectively), the model was further used to simulate the volume of the RF ablation zone with pre-freezing. compares the temperature distributions of the RF heating for 2 min in tissue with and without pre-freezing. The volume enclosed by the 50 °C isothermal surface, represented by the red line, was used to define in vivo lesion volume. It is obvious that the area surrounded by the isotherm is much larger in tissue with pre-freezing. The ablation volume (above 50 °C) was about with RF heating alone, while it was about
in tissue subjected to pre-freezing, an increase of 104% in volume.
Figure 8. Simulated temperature distribution inside the tissue after being heated for 2 min at the power of 5 W. The red line represents the isotherm of 50 °C. (a) RF heating without pre-freezing; (b) RF heating with pre-freezing.
4. Discussion
Evidences show that RFA combined with cryosurgery has better therapeutic outcome in comparison to either ablation method alone and could even stimulate antitumor immunity [Citation12–14]. Few articles have explained the essence of the enhancement of thermal ablation effects from the perspective of thermal physics. To better understand the mechanisms and optimize the treatment protocol of the combined treatment, this study explored the nature of the enhanced RF heating effects caused by the pre-freezing from the view of temperature transients, histopathology, and physical properties.
The recorded temperatures in ex vivo experiments showed that there was little difference in the temperature profiles between the two groups. While in in vivo experiments, the rate of temperature increase in tissue subjected to pre-freezing was significantly higher than that in tissue without pre-freezing. This suggests that the pre-freezing process in living tissue significantly changes the RF heating pattern. This phenomenon can be attributed to the role of blood flow, which is the major difference between these two conditions. According to Shen et al. [Citation16,17], the vessel wall is subjected to intense thermal stress in living tissue undergoing alternating freezing and heating processes, with the blood leaking through the wall into the extravascular space, which significantly changed the heating pattern. From , at the point 4 mm away from the RF probe, the temperature of the pre-freezing group continued to rise during the first 100 s and reached a plateau later. This was due to the dehydration and carbonization of the tissue adjacent to the probe.
Moreover, in the histopathology results, we have found three zones in heated tissue, both with and without pre-freezing. The center is the coagulative necrosis zone (H1). The middle zone is the transition zone (H2), with interstitial infiltration of red blood cells. And, the outermost zone (H3) is normal tissue. Many studies investigating ablation lesions have reported that tissue sections after thermal ablation present three or more distinct regions, which were very similar to our findings [Citation22–24]. In addition, the tissue sections treated by RF heating with pre-freezing had larger zones H1 and H2, especially zone H2, which was more than six times greater in width than that of the heated tissue without pre-freezing. The degree of bleeding and tissue fragmentation in sections treated by RF heating with pre-freezing also appeared to have increased. According to our previous studies, the initiation mechanism of the immune response caused by RF heating with pre-freezing was due to the thermal and shear stress generated during the alternating freezing and heating, resulting in tumor cell rupture and exposure of internal antigens. The histological findings in this study also demonstrated that the method could achieve more severe cell breakage compared to individually heating, potentially causing a large amount of antigen release to stimulate anti-tumor immunity.
The four-electrode method and semi-infinite modeling were applied to the measurement of impedance and calculation of electrical conductivity. Results showed that the modulus of the impedance of the tissue subjected to freezing followed by heating was significantly smaller than that of the tissue under the other two conditions (normal and pre-freezing only) at lower frequencies, and the magnitude of electrical conductivity was larger. At lower frequencies, the electrical conductivity is mainly determined by the resistance to free-moving ions. The breakage of both cells and blood vessels by freezing may have released more free-moving ions, which could lead to a dramatic decrease of the impedance magnitude. As the frequency increased, the data began to converge. At higher frequencies, the electrical properties are controlled mainly by the polarization of cellular membranes and protein and other organic macromolecules [Citation41,42]. The significant difference in impedance and electrical conductivity at lower frequencies in the three groups suggest that it could be used as a potential detection method for in vivo tissue bleeding or cellular breakage, as more free ions are released in such situations. However, the small difference in the electrical conductivity between the normal tissue and freezing-heating tissue at the frequencies of 460 and 1500 kHz (a range used clinically) eliminated the possible contribution of the electrical conductivity change to the enhanced RF heating rate in the in vivo tissue after freezing. Meanwhile, the electrical conductivity of the freezing group had a lower value compared to the normal and freezing-heating group, which could be attributed to the uneven distribution of ion concentration due to ice formation [Citation43]. Moreover, the measured electrical conductivity of normal tissues was also close to those found in the literature [Citation44].
The fitted thermal conductivity of pre-freezing tissue was 0.47 W/m·K, representing the apparent or effective thermal conductivity, very close to the reported data for tissue without any thermal treatment [Citation33–35]. This is to be expected since the tissue composition has not been changed by the pre-freezing process. The blood perfusion rate of the in vivo liver in the physiological state is quite different, ranging from 0.0064 l/s to 0.016 l/s [Citation39,40]. The fitted blood perfusion rate of normal tissue during the RF heating process was 0.053 l/s, which was greater than that reported in the literature. The increased local blood perfusion rate could be induced by the early stage of temperature increases [Citation29]. Sturesson et al. [Citation45] measured the increase of liver perfusion in rat liver at temperatures of 41 and 44 °C. An increase in liver perfusion up to 33% was found at the local tissue temperature of 41 °C, whereas blood flow decreased continuously during and after heating to 44 °C. The increase of blood perfusion rate caused by initial tissue temperature rise should be considered in the simulation. Therefore, it can be concluded that for the treatment of RF heating with pre-freezing, the cessation of blood flow leads to a significant reduction in its heat-sink effect, which greatly increased the heating rate.
In our previous studies, pre-freezing at the temperature of −20 °C for 5 min followed by rapid RF heating at the temperature of 50 °C for 10 min achieved a good prognosis in animal tumor models [Citation12–14]. Considering the patient’s tolerance, a rapid heating can ensure sufficient thermal dose for tumor cell killing within the same operating time. Under the condition of a constant power input, more RF energy could be focused into the targeted region given less heat dissipation in the pre-freezing tissue and a larger ablation volume created within the same duration. This clearly indicates that the combined therapy effectively overcomes the heat sink effect of the blood flow and greatly improves the RFA range. Currently in clinic application, the lethal temperatures for thermal ablation of tumor cells are below –40 °C for cryosurgery and above 60 °C for the RF heating [Citation3]. It is clear that the combined treatment of RF heating with pre-freezing studied here utilizes more a moderate temperature range to ablate tumors more effectively and to protect the surrounding tissue structures, especially in sensitive locations. The clinical application could be achieved through precise control of dynamic thermal energy deposition (dose) via a novel thermal treatment system under development in our laboratory.
In this article, the simulation model did not consider the tissue properties changing with temperature, and the geometric model was simplified. For future study, when more accurate prediction of temperature is needed, the real human tumor and relevant tissue geometry can be obtained through CT, US or MRI imaging, and temperature dependent properties can also be considered in the model.
5. Conclusions
In this article, the RF heating of tissue with pre-freezing has been studied based on the principles of thermal physics. It has been found that the RF heating rate and ablation area were significantly enhanced in the living tissue if a pre-freezing was imposed. The results of parametric analysis showed that the electrical conductivity of the living tissue with pre-freezing was much higher than that without pre-freezing at low frequencies, but similar at 460 kHz normally used in clinic. Based on simulation, the improvement in heating of tissue was primarily attributed to the complete elimination of blood flow heat-sink effect through the synergy of pre-freezing and rapid heating. Furthermore, the new model can be used for surgical planning and providing the temperature transients during RF heating with pre-freezing.
Acknowledgments
We would like to thank Prof. J. Brian Fowlkes for his assistance in improving the English of this article.
Disclosure statement
No potential conflict of interest was reported by the authors.
Additional information
Funding
References
- Tatli S, Tapan U, Morrison PR, et al. Radiofrequency ablation: technique and clinical applications. Diagn Interv Radiol. 2012;18:508–516.
- Lencioni R, Crocetti L. Local-regional treatment of hepatocellular carcinoma. Radiology. 2012;262:43.
- Chu KF, Dupuy DE. Thermal ablation of tumours: biological mechanisms and advances in therapy. Nat Rev Cancer. 2014;14:199–208.
- Aghayev A, Tatli S. The use of cryoablation in treating liver tumors. Expert Rev Med Devices. 2014;11:41–52.
- Joosten J, Jager G, Oyen W, et al. Cryosurgery and radiofrequency ablation for unresectable colorectal liver metastases. Eur J Surg Oncol. 2005;31:1152–1159.
- Bhardwaj N, Gravante G, Strickland AD, et al. Cryotherapy of the liver: a histological review. Cryobiology. 2010;61:1–9.
- Shady W, Petre EN, Gonen M, et al. Percutaneous radiofrequency ablation of colorectal cancer liver metastases: factors affecting outcomes – a 10-year experience at a single center. Radiology. 2016;278:601–611.
- Ayav A, Germain A, Marchal F, et al. Radiofrequency ablation of unresectable liver tumors: factors associated with incomplete ablation or local recurrence. Am J Surg. 2010;200:435–439.
- Mulier S, Ni Y, Jamart J, et al. Local recurrence after hepatic radiofrequency coagulation: multivariate meta-analysis and review of contributing factors. Ann Surg. 2005;242:158–171.
- Kunzli BM, Abitabile P, Maurer CA. Radiofrequency ablation of liver tumors: actual limitations and potential solutions in the future. World J Hepatol. 2011;3:8–14.
- Zhang B, Moser M, Zhang E, et al. Radiofrequency ablation technique in the treatment of liver tumours: review and future issues. J Med Eng Technol. 2013;37:150–159.
- Lisa X, Aili Z, Ping L, et al. Energy-based diagnostic and treatment techniques. IEEE Eng Med Biol Mag. 2008;27:72–77.
- Zhu J, Zhang Y, Zhang A, et al. Cryo-thermal therapy elicits potent anti-tumor immunity by inducing extracellular Hsp70-dependent MDSC differentiation. Sci Rep. 2016;6:27136.
- He K, Liu P, Xu LX. The cryo-thermal therapy eradicated melanoma in mice by eliciting CD4+ T-cell-mediated antitumor memory immune response. Cell Death Dis. 2017;8:e2703–e270e.
- Takahashi D, Nakamura H, Shinoda K, Fukumoto I. A study of the heating effect on mouse liver after cryosurgery. In: Magjarevic R, Nagel JH, editors. World congress on medical physics and biomedical engineering 2006; 2007; IFMBE Proceedings, vol 14. Berlin, Heidelberg: Springer; 3358–3361.
- Shen Y, Liu P, Zhang A, et al. Study on tumor microvasculature damage induced by alternate cooling and heating. Ann Biomed Eng. 2008;36:1409–1419.
- Shen Y, Zhang A, Xu LX. A study on mechanical damage of tumor microvasculature induced by alternate cooling and heating. J Thermal Sci Eng Appl. 2009;1:031002.
- Hachisuka J, Doi K, Furue M. Combination cryosurgery with hyperthermia in the management of skin metastasis from breast cancer: a case report. Int J Surg Case Rep. 2012;3:68–69.
- Ahmed M, Liu Z, Humphries S, et al. Computer modeling of the combined effects of perfusion, electrical conductivity, and thermal conductivity on tissue heating patterns in radiofrequency tumor ablation. Int J Hyperthermia. 2008;24:577.
- Ng EYK, Jamil M. Parametric sensitivity analysis of radiofrequency ablation with efficient experimental design. Int J Thermal Sci. 2014;80:41–47.
- Sun J, Zhang A, Xu LX. Evaluation of alternate cooling and heating for tumor treatment. Int J Heat Mass Transfer. 2008;51:5478–5485.
- Breen MS, Lazebnik RS, Fitzmaurice M, et al. Radiofrequency thermal ablation: correlation of hyperacute MR lesion images with tissue response. J Magn Reson Imaging. 2004;20:475–486.
- Onishi H, Matsushita M, Murakami T, et al. MR appearances of radiofrequency thermal ablation region: Histopathologic correlation with dog liver models and an autopsy case1. Acad Radiol. 2004;11:1180–1189.
- Raman SS, Lu DS, Vodopich DJ, et al. Creation of radiofrequency lesions in a porcine model: correlation with sonography, CT, and histopathology. Am J Roentgenol. 2000;175:1253.
- Liu Z, Lobo SM, Humphries S, et al. Radiofrequency tumor ablation: insight into improved efficacy using computer modeling. Am J Roentgenol. 2005;184:1347–1352.
- Steendijk P, Mur G, Vdv E, et al. The four-electrode resistivity technique in anisotropic media: theoretical analysis and application on myocardial tissue in vivo. IEEE Trans Biomed Eng. 1993;40:1138–1148.
- Kinouchi Y, Iritani T, Morimoto T, et al. Fast in vivo measurements of local tissue impedances using needle electrodes. Med Biol Eng Comput. 1997;35:486–492.
- Trujillo M, Berjano E. Review of the mathematical functions used to model the temperature dependence of electrical and thermal conductivities of biological tissue in radiofrequency ablation. Int J Hyperthermia. 2013;29:590–597.
- Rossmann C, Haemmerich D. Review of temperature dependence of thermal properties, dielectric properties, and perfusion of biological tissues at hyperthermic and ablation temperatures. Crit Rev Biomed Eng. 2014;42(6):467–492.
- Schüder G, Pistorius G, Fehringer M, et al. Complete shutdown of microvascular perfusion upon hepatic cryothermia is critically dependent on local tissue temperature. Br J Cancer. 2000;82:794.
- Plonsey R, Heppner DB. Considerations of quasi-stationarity in electrophysiological systems. Bull Math Biophys. 1967;29:657–664.
- Berjano EJ. Theoretical modeling for radiofrequency ablation: state-of-the-art and challenges for the future. Biomed Eng Online. 2006;5:24.
- Duck FA. Physical properties of tissue: a comprehensive reference book. London: Academic Press; 1990.
- Valvano JW, Cochran JR, Diller KR. Thermal conductivity and diffusivity of biomaterials measured with self-heated thermistors. Int J Thermophys. 1985;6:301–311.
- Grayson J. Internal calorimetry in the determination of thermal conductivity and blood flow. J Physiol (Lond). 1952;118:54–72.
- Blomley MJ, Coulden R, Dawson P, et al. Liver perfusion studied with ultrafast CT. J Comput Assist Tomogr. 1995;19:424.
- Brace CL. Radiofrequency and microwave ablation of the liver, lung, kidney, and bone: what are the differences? Curr Probl Diagn Radiol. 2009;38:135.
- Di Nardo W, Scorpecci A, Giannantonio S, et al. Safe use of bipolar radiofrequency induced thermotherapy (RFITT) for nasal surgery in patients with cochlear implants. Auris Nasus Larynx. 2011;38:739–742.
- Ebbini ES, Umemura S, Ibbini M, et al. A cylindrical-section ultrasound phased-array applicator for hyperthermia cancer therapy. IEEE Trans Ultrason Ferroelect Freq Contr. 1988;35:561.
- Zhang B, Moser MA, Zhang EM, et al. A new approach to feedback control of radiofrequency ablation systems for large coagulation zones. Int J Hyperthermia. 2016;33:367–377.
- Schwan HP. Electrical properties of tissue and cell suspensions. Adv Biol Med Phys. 1957;5:147.
- Damez JL, Clerjon S, Abouelkaram S, et al. Dielectric behavior of beef meat in the 1-1500kHz range: simulation with the fricke/cole-cole model. Meat Sci. 2007;77:512–519.
- Pegg DE. Mechanisms of freezing damage. Symp Soc Exp Biol. 1987;41:363–378.
- Zurbuchen U, Holmer C, Kai SL, et al. Determination of the temperature-dependent electric conductivity of liver tissue ex vivo and in vivo: importance for therapy planning for the radiofrequency ablation of liver tumours. Int J Hyperthermia. 2010;26:26–33.
- Sturesson C, Ivarsson K, Andersson-Engels S, et al. Changes in local hepatic blood perfusion during interstitial laser-induced thermotherapy of normal rat liver measured by interstitial laser Doppler flowmetry. Lasers Med Sci. 1999;14:143–149.