
 ?Mathematical formulae have been encoded as MathML and are displayed in this HTML version using MathJax in order to improve their display. Uncheck the box to turn MathJax off. This feature requires Javascript. Click on a formula to zoom.
Abstract
Background: Accurate lesion visualization after microwave ablation (MWA) remains a challenge. Computed tomography perfusion (CTP) has been proposed to improve visualization, but it was shown that different perfusion-models delivered different results on the same data set.
Purpose: Comparison of different perfusion algorithms and identification of the algorithm enables for the best imaging of lesion after hepatic MWA.
Materials and methods: 10 MWA with consecutive CTP were performed in healthy pigs. Parameter-maps were generated using a single-input-dual-compartment-model with Patlak’s algorithm (PM), a dual-input-maximum-slope-model (DIMS), a dual-input-one-compartment-model (DIOC), a single-(SIDC) and dual-input-deconvolution-model (DIDC). Parameter-maps for hepatic arterial (AF) and portal venous blood flow (PF), mean transit time, hepatic blood volume (HBV) and capillary permeability were compared regarding the values of the normal liver tissue (NLT), lesion, contrast- and signal-to-noise ratios (SNR, CNR) and inter- and intrarater-reliability using the intraclass correlation coefficient, Bland-Altman plots and linear regression.
Results: Perfusion values differed between algorithms with especially large fluctuations for the DIOC. A reliable differentiation of lesion margin appears feasible with parameter-maps of PF and HBV for most algorithms, except for the DIOC due to large fluctuations in PF. All algorithms allowed for a demarcation of the central necrotic zone based on hepatic AF and HBV. The DIDC showed the highest CNR and the best inter- and intrarater reliability.
Conclusion: The DIDC appears to be the most feasible model to visualize margins and necrosis zones after microwave ablation, but due to high computational demand, a single input deconvolution algorithm might be preferable in clinical practice.
Introduction
Microwave ablation is a thermoablative procedure, which induces coagulation necrosis through microwave-induced heat [Citation1]. A frequent field of application is the ablation of liver tumors [Citation1]. To monitor success, each ablation is followed by imaging. However, several previous studies have shown that the exact representation of the necrosis zone remains challenging [Citation1–5]. Also, histologic analyses of liver lesions demonstrated that vital tissue may still be present in the marginal areas of an ablation, posing a risk of tumor recurrence [Citation6]. Therefore, an accurate visualization of the lesion margins and complete demarcation of the necrotic zones would be highly desirable.
Currently, contrast-enhanced MRI, performed a day after the ablation, is considered the image modality of choice to visualize lesions after MWA, as it enables display of residual tumor tissue [Citation7,Citation8]. However, due to the time delay, no immediate correction of the ablation can be performed, and the patient would have to undergo another procedure, if residual tumor tissue was detected in the MRI examination. As MWA is often performed under CT guidance, improvement of CT imaging of the ablation zones may be beneficial in clinical practice. Previous studies have shown, that computed tomography perfusion (CTP) might be used to improve visualization of lesions in post-interventional imaging, as it allows for a basic delineation of lesion morphology [Citation5,Citation9]. However, as could be shown by previous studies, the different measurements for the same tissues by different perfusion models remain a challenge for CTP [Citation10–13]. Notably, these studies evaluated CTP for stroke or renal tumors. The different performance of the perfusion models is based on the fact, that the algorithms weigh the input perfusion parameters differently and make varying assumptions about tissue composition and contrast agent behavior. In order to increase the reliability of CTP, prior research recommended to use a uniform algorithm for CTP evaluation [Citation10]. Plenty of studies have already evaluated different perfusion algorithms in the liver. For example, Guyennon et al. utilized a single input deconvolution model and a bi-compartment model to examine perfusion characteristics of liver metastases [Citation14]. Thieme et al. evaluated the performance of a maximum slope algorithm and bi-compartment model in displaying lesions after hepatic radiofrequency ablation [Citation5]. However, to our knowledge, to date, no study compared the performance of different algorithms.
Thus, the aim of the present study was to compare different perfusion methods and to identify the algorithm, which allows the best visualization of lesion after hepatic microwave ablation for future research. In addition to the comparison of the absolute perfusion values, signal and contrast-to-noise ratios (SNR and CNR) will be calculated to evaluate the image quality of the parameter-maps. Furthermore, the inter- and intrarater reliability will be assessed to determine the overall reliability of the measurements.
Methods
Animals, housing and care
Ten MWA with consecutive CTP was performed in domestic pigs at our institution. All animals were held under controlled conditions, as demanded by the local guidelines and according to the rules for the implementation of the Animal Welfare Act. The study was carried out in accordance with the guidelines and rules of the Federation of Laboratory Animal Science Associations (FELASA) and was approved by the National Office for Health and Social Affairs.
Prior to the procedure, the animals were narcotized, and median laparotomy was performed. Following the ablation, the pigs were transferred to the surgical theater, where the liver was explanted for preparation of macroscopic sections and after which the pigs were euthanized.
Anesthesia protocol
Anesthesia was introduced through intramuscular injection of a weight-adapted dose of ketamine (24 mg/kg, Ursotamin, Serumwerk Bernburg, Bernburg, Germany), azaperone (180 mg, Stresnil, Janssen Animal Health, Beerse, Belgium), xylazine (2.7 mg/kg, Rompun, Bayer Vital GmbH, Leverkusen, Germany) and atropine (0.01 mg/kg, Atropinsulfat, B. Braun, Melsungen, Germany). During the procedure, xylazine and ketamine (ratio 1.0/2.8) were continuously injected with a rate of 8.4–8.9 ml/h to preserve anesthesia. Heart rate, oxygenation and urine production were closely monitored, and fluids were replaced intravenously with saline solution. Analgesia was obtained through injection of a bodyweight-adapted fentanyl dose (2 μg/kg fentanyl, Rotexmedica GmbH, Trittau, Germany).
Microwave ablation
We used CT guidance for placement of the microwave ablation electrodes (AveCure, MedWaves Incorporated, San Diego, USA). After the liver was exposed through median laparotomy, one electrode was placed centrally in a hepatic lobe and ablation was performed with a power of 100 W, over a mean duration of 15:15 ± 3:01 min, delivering a target energy of 24 kJ to achieve a spherical lesion with 5 cm in diameter. The procedure was repeated for each lobe, resulting in 3–4 ablations performed per animal, depending on the size of the four liver lobes.
CT-Perfusion
After the ablations, CTP was performed with an 80 slice CT-scanner (Aquilion PRIME, Canon Medical Systems Cooperation, Otawara, Japan), under respiratory arrest. The scan parameters were as follows: 100 kV, 200 mA, 0.35 s/rotation and 1 mm slice thickness. Perfusion was performed in shuttle-mode, which enabled a coverage of the entire liver (16 cm) through constant bidirectional helical table movement with a temporal resolution of 3 s. During CTP, a total of 40 ml iomeprol with an iodine concentration of 400 mg/ml (Imeron® 400, Bracco Imaging, Milan, Italy) was injected with a speed of 5 ml/s, resulting in an iodine-delivery rate of 2 g/s in each pig. In total 40 volumes with a resolution of 512 × 512 px with a spacing of 0.843 mm were acquired and reconstructed using convolution kernel FC11.
Data pre-processing
Data was sent to a dedicated workstation (Research PC, Software Version V6.0 SP 0500E WiP, Canon Medical Systems Cooperation). Reconstruction data were time corrected in-between two helical runs (in-between caudal direction and back cranial direction) to achieve time information for the perfusion analysis itself. Afterwards, all available data were co-registered using a non-rigid algorithm to reduce motion [Citation15].
Data analysis
Prior to the calculation of parameter-maps, regions of interest (ROI) were placed into the aorta, the portal vein, the normal liver tissue (NLT) as well as the spleen and into the lesion. Parameter-maps were then calculated through a dual input maximum slope method (DIMS), a dual-input one-compartment model (DIOC), a single-input double compartment model using Patlak’s algorithm (PM), a distributed parameter deconvolution model (SIDC) and a dual input deconvolution model (DIDC) using the Research PC, Software Version V6.0 SP 0500E WiP, (Canon Medical Systems Cooperation). For an in-depth explanation of the different perfusion algorithms please refer to the Supplementary Appendix. The longest computational time for the different algorithms was 1:05 min (DIMS), 4:30 min (DIOC), 1:50 min (PM), 3:20 min (SIDC), 90 min (DIDC). For an in-depth explanation of the different perfusion algorithms please refer to the Supplementary Appendix. After generating all parameter-maps, data were sent to a Vitrea Workstation (Vital Images, Minnetonka, USA) for further data readout. In particular, dual-input algorithms were chosen because may be better suited to the dual blood supply of the liver compared to single-input algorithms [Citation16]. The single input algorithm PM has the advantage of being able display tissue permeability and, finally, the SIDC was chosen for performance reasons because the long calculation time of the DIDC was prior known.
For comparison of the different algorithms, the lesion was first identified in the CTP source images showing the maximal arterial enhancement and then angulated orthogonal to the lesion’s longitudinal axis through multiplanar reconstruction. We placed circular ROIs with a diameter of 10 mm in the NLT and smaller ROIs with a diameter of 5 mm in the lesion. For each reconstruction, a slice thickness of 5 mm was used. To minimize the scattering of values, a total of two ROIs was drawn for each measurement, and the pooled values were used for later analysis. Since histological analyses showed a subdivision of the MWA lesions into a central white zone, which almost exclusively consisted of dead tissue, and a peripheral red zone, in which vital tissue can still be detected, we placed two ROIs in the central zone and two in the peripheral area to cover both zones. To ensure proper placement of the ROIs in the respective lesion zones, we used previously prepared histologic sections of the lesions for guidance. Therefore, the plane representing the histologic slice was chosen for the evaluation. For each region, we noted the mean and maximum values as well as the standard deviation. Upon evaluation of the different parameter maps, the exact same placement of the ROIs as in the CTP source images was ensured through automatic positioning by of the software, Thus, once defined, no manual adjustment of the ROIs had to be performed in the parameter maps, potentially reducing bias from different positioning between observers.
Not all methods could show the same perfusion parameters. Parameter-maps for hepatic arterial flow (AF) were provided by all methods, except the dual compartment model using Patlak’s algorithm (PM). Portal venous flow (PF), the hepatic perfusion index and the tissues total perfusion could be calculated by the dual input models. The blood volume could be provided by all models except for the maximum slope method. Mean transit time was provided by DIOC and both deconvolution models. The PM model as the only dual compartment model also exclusively allowed calculation of parameter-maps for capillary permeability. Since the majority of the models provided parameter-maps for AF/PF, mean transit time and hepatic blood volume, the models were mainly compared with regard to these parameters. To assess interrater reliability, two observers with three (KKB) and 16 years (SMN) of experience in CT imaging and interventions, independently performed placement of the ROIs and measurements of all the lesions. Measurements were repeated after four weeks for assessment of intrarater reliability. During further analysis, the values were pooled. Additionally, the two observers segmented the lesion areas in the DICOM images using ITK-Snap as well as in the histologic images using ImageJ [Citation17–19].
Signal and contrast-to-Noise-Ratios
For an objectifiable assessment of image quality, we used both CNR and SNR. We calculated CNRs between the outer part of the lesion and the liver parenchyma as well as between the inner and outer part of the lesion in each parameter-map and SNRs for the normal liver tissue and both lesion zones. While we use SNRs to evaluate the general quality of the presentation of perfusion values, with a low SNR indicating an inhomogeneous presentation of the area, CNRs were used to assess how well the different areas may be distinguished from each other. We calculated SNR as the mean signal intensity (µ) of the ROIs divided through the standard deviation (σ) and the CNR by dividing the difference of intensities in two different areas (µ1 and µ2) by the square root of the sum of the associated squared standard deviations (σ1 and σ2, see formulas A and B).
Statistical analysis
Statistical analysis was performed using ‘R’ statistical software (Version 3.4.0–The R Foundation for Statistical Computing) including the package ‘ggplot2’ for graphical display [Citation20,Citation21]. Variables were expressed as means ± standard deviation, if normally distributed. Mean values of the different maps were displayed through bar plots and with accompanying error bars representing one standard deviation and CNR/SNR solely as bar plots. Interrater agreement was analyzed using the intraclass correlation coefficient (ICC) and visualized through Bland-Altman plots and linear regression graphs. Since the values in the different parameter-maps showed large differences in the minima and maxima, all values were standardized to a minimum of −1 and a maximum of 1 prior to Bland Altman and regression analysis. For this the following formula (formula C) was used, outliers were not excluded.
ICC values of less than 0.5 were considered as poor agreement, values between 0.5–0.75 as moderate, 0.75 – 0.9 as good and above 0.9 as excellent [Citation22]. Student’s t-test was used to identify significant differences between interval or ratio scaled variables. Significance levels are indicated as p < .05, p < .01, and p < .001. Additionally, the Jaccard-index, which is defined as the coefficient in size of overlapping areas divided by the size of the union of the two areas, was calculated for the inter- and intraobserver agreement on CTP source images, as manual ROI placement was only performed in these images, and for the agreement between CTP source images and histologic sections. Shape similarity was assessed through calculating the absolute and relative difference between lesion areas, with the relative difference being defined as the absolute difference in area between the histology and CTP source images divided by the area in histology. We also calculated the relative differences in lesion size, defined as the difference between measured area in histology and CT source images divided through the area in histology [Citation4,Citation23].
Results
Overall, 10 lesions were evaluated. An overview of the mean values sorted by algorithm and parameter-map is provided by and Table S1 in the Supplementary Appendix. illustrates examples of lesion visualizations by the different algorithms. For all algorithms, the values measured for AF were significantly lower in the inner lesion zone compared to the outer lesion zone (p < .05 for all) with an up to 50% drop in flow rates. However, only parameter-maps created by the DIDC and DIMS showed a significantly stronger arterial perfusion for the outer lesion zone compared to the NLT (p = .002 for dual input deconvolution, p = .026 for DIMS). Also, the mean values for AF differed between the models, with the SIDC showing the highest value for all measured zones. Regarding PF, an overall decrease of flow values could be observed in the ablated areas, which was significant in parameter-maps provided by the DIDC and DIMS (p < .001), but not in the DIOC maps, where the flow values for the NLT fluctuated widely, as displayed by the large standard deviations. Consistently, total/combined arterial and portal venous perfusion showed the highest flow rates in the NLT, strongly decreased values for the outer lesion zone and further decreased values for the central parts. Differences were significant for the dual input deconvolution and maximum slope models (p < .001 for both). For the mean transit time, the three different models produced partially opposite values. While in all parameter-maps a general reduction of the mean transit time could be observed for the outer zone, only the two deconvolution models showed a further reduction of the times centrally, whereas DIOC calculated a higher mean transit time (p = .68). However, the values produced by DIOC also showed strong fluctuations. In the calculation of the blood volume, PM calculated distinctly lower values than the other algorithms. Also, the proportion of the values measured in the NLT and ablation differed. Only PM calculated a higher HBV in the peripheral parts of the lesion than in the NLT, while all other algorithms showed a decrease. Nonetheless, the changes of hepatic blood volume in the compared to NLT and between the central necrosis and outer lesion zone were statistically significant (PM p = .014, SIDC and DIDC p < .001, DIOC p = .016). PM further demonstrated a decrease in capillary permeability by approximately a half each between NLT and outer ablation zone, as well as outer and inner ablation zone (p < .001).
Figure 1. Shows the mean values for the different parameter-maps with corresponding standard deviations. Certain parameter-maps, which could not be generated by some algorithms were marked as not available (n.a.). Statistical significance between two means is annotated as *if p > .05. **if p > .01. ***if p > .001 and left blank if no significant difference was observed. Horizontal error bars indicate whether the significance level accounts for all three measured zones or only for two (normal liver tissue/outer zone of lesion or outer/inner zone of lesion). The HBV seems to be most suitable for the display of both the lesion boundaries and the necrosis zone, since all differences in perfusion values were significant. Regarding the different algorithms, DIMS, DIDC and SIDC were found to be the most suitable for visualization of the lesions. The differences in perfusion values reached the highest significance levels in the deconvolution models (DIDC, SIDC).
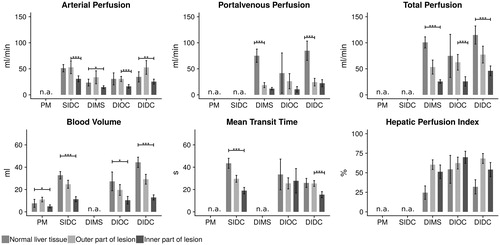
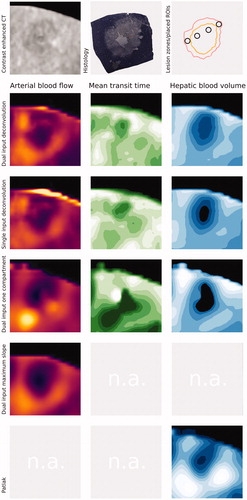
Figure 2. Shows an example ablation and presentation of the lesion by different perfusion algorithms. In the first row, on the left side, the lesion is displayed by contrast-enhanced computed tomography as reference (20 s post injection). Furthermore, the corresponding histologic section and a drawing of the borders of the inner necrotic zone (orange) as well as the outer lesion border (light red) as defined by the histologic section are provided. Example ROI placements are also illustrated (dark grey). In the second row, the dual input deconvolution model parameter-maps are displayed, the third row shows the corresponding example for the single input deconvolution model and the fourth row demonstrates an example for the dual input one compartment. Since no mean transit time or hepatic blood volume can be calculated from the dual input maximum slope model and no arterial blood flow or mean transit time can be obtained from the single input dual compartment model (Patlak), these parameters were marked as not available (n.a.) in the sixth and seventh row.
Contrast- and signal-to-noise ratios
A detailed listing of the CNR and SNR is provided by and . The overall lowest signal and CNR were observed for the DIOC. There was no model consistently showing the highest CNR for all values provided. Instead, this was dependent on the parameter-map evaluated. Regarding the AF, the CNR between NLT and outer lesion zone were considerably low, with the highest ratios for the dual input deconvolution model being 1.1, and the lowest being 0.01 for DIOC, however DIOC also showed the highest ratios between the inner and outer lesion zones with 2.36 and DIDC the second highest with 1.94. The highest CNR in maps of hepatic blood volume could be observed for the DIDC with 3.28 between the inner and outer lesion zones and 2.39 between NLT and the outer lesion zone. Regarding MTT, the SIDC showed the highest CNR between the NLT and outer lesion zone (2.54) and the DIDC yielded the highest CNR for differentiation of the inner and outer parts of the lesion (2.67). The SNRs were generally higher than the CNRs, however, the proportions between the individual algorithms and parameter-maps appeared similar.
Figure 3. Provides the CNR and SNR ratios for the different algorithms, broken down by the respective parameter-maps. If a certain parameter-map could not be provided by the respective algorithm, the space was left blank. CNR values were overall lower than SNR values. For the demarcation of the outer lesion border, the highest CNR values were achieved in the DIMS and DIDC, most notably in the parameter-maps for portal venous flow. For the demarcation of the necrotic core, the SIDC and DIDC showed the highest CNR values, most notably in parameter-maps of hepatic blood volume.
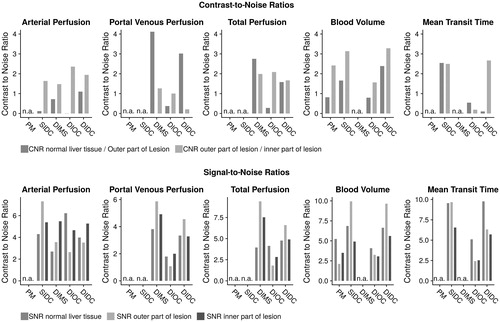
Table 1. An overview of the calculated CNR and SNR values of each algorithm, subdivided for each parameter-map.
Inter- and intrarater assessment
A detailed overview of the intraclass correlation coefficients for inter- and intrarater agreement is provided by and an overview of the different measurements of the two observers can be accessed in . Both inter- and intrarater assessment varied between the different algorithms, although in general, the intrarater agreement was better than the interrater agreement. The Jaccard-index for the overlap in CTP source images was 84.7 ± 4.1% between the two observers and 88.8 ± 6.8% for repeated measurements for the same observer. Overlap of segmented lesion size between the histologic sections and CTP source images was 74.0 ± 7.8%, while the relative difference was 0.13 ± 0.08. The highest values for the intraclass correlation coefficient for the outer lesion zone could be observed for the DIDC with 0.89 CI: 0.82–0.93, followed by PM (ICC = 0.8 CI: 0.56–0.92), DIMS (ICC = 0.77 CI: 0.6–0.87), the SIDC (ICC 0.69 CI: 0.45–0.84) and DIOC (ICC = 0.73 CI: 0.59–0.83). For the inner zone, again the DIDC showed the best ICC (ICC = 0.9 CI: 0.84–0.94), followed by the SIDC (ICC = 0.86 CI: 0.73–0.93), DIMS (ICC = 0.88 CI: 0.79–0.94), DIOC (ICC = 0.81 CI: 0.7–0.88) and PM (ICC = 0.81 CI: 0.59–0.92). After standardization of the observed values, Bland-Altman-analysis showed a mean ratio of −0.05 (CI: −0.52–0.42) for PM, 0.01 (CI: −0.43–0.45) for the SIDC, 0.07 (CI: −0.38–0.53) for DIMS, 0.07 (CI: −0.39–0.53) for DIOC and 0.01 (CI: −0.32–0.34) for the DIDC. Regarding intrarater assessment, PM showed the highest agreement for the outer zone and DIMS and PM for the inner zone.
Table 2. The intraclass correlation coefficients (ICC) with corresponding 95% Confidence Intervals (CI) for the different algorithms, subdivided into the three measured zones (normal liver tissue, outer part of lesion, inner part of the lesion).
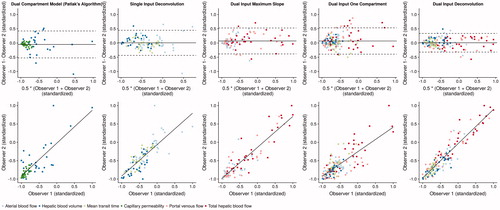
Figure 4. Visualizes the interrater agreement for the five different perfusion algorithms. For better comparability, observed values were standardized to a new minimum of −1 and a new maximum of 1. In the first line. Bland Altman plots are given with the mean of the two observers and a corresponding 95% confidence interval indicated by the dotted lines. The ratios were −0.05 (CI: −0.52–0.42) for PM. 0.01 (CI: −0.43–0.45) for the SIDC. 0.07 (CI: −0.38–0.53) for DIMS. 0.07 (CI: −0.39–0.53) for DIOC and 0.01 (CI: −0.32–0.34) for the DIDC. The bottom line shows linear regression graphs for the different algorithms. Since different parameter-maps were evaluated for the different algorithms with a different number of values included in the analysis, the parameter-maps are color-coded. The best agreement could be observed for the DIDC with the smallest 95% confidence intervals in the Bland-Altman analysis. The other algorithms showed a similar scattering of values between the two observers with similar sized confidence intervals.
Discussion
This study aimed to identify the CT perfusion algorithm, which allows for the best visualization of hepatic lesions after microwave ablation. To this end, we compared five different perfusion algorithms regarding the calculated perfusion values, the CNR and SNR values as well as intra- and interrater reliability. Overall, based on CNR/SNR and differences in absolute perfusion values, the deconvolution models proved to be superior, with the dual input model yielding the best results, but at the expense of long computing time. In clinical practice, the single input deconvolution model ought thus to be preferred due to a significantly faster performance with only a small loss of accuracy.
The values for AF varied between the parameter-maps. This was partly to be expected, as variations between the algorithms are already described in the literature, although previous research focused on cerebral or renal tissue [Citation10,Citation11,Citation13]. At least partly, the lower values computed by DIMS might result from the injection rate of the contrast agent. Since venous elimination is not considered by the maximum slope methods, higher injection rates of 15–20 ml/s would be optimal; however, this is not clinically practicable [Citation13,Citation24–26]. Still, all algorithms might allow for a discrimination of the necrotic lesion parts through AF, since they showed a similar decrease of flow values within the lesion. The observed CNR values were best for DIOC and DIDC, suggesting a superior discrimination. Conversely, delineation of the outer lesion borders to the NLT does not seem to be reliable based on AF due to the overall low CNR values. Especially for DIOC, the CNR values were close to zero, which suggests only slight differences in perfusion values accompanied by high image-noise. Generally, the arterial blood supply appeared to be more resistant to heat exposure, as there was a significant reduction of parameter values in all parameter-maps only for the center of the lesion. The portal venous blood supply also significantly decreased in the outer zone, where heat damage is not as severe, and showed no further significant decrease in the central parts. As liver tumors often show a predominantly arterial blood supply, this should be accounted for in planning the ablation [Citation27].
All algorithms depicted a strong decrease in HBV for the central parts of the lesion, but only PM showed a relative increase in the outer lesion zone compared to the NLT, while the others demonstrated a moderate decrease. Also, the PM algorithm produced significantly lower values for the HBV (p < .001). The basic assumption of the PM model is, that contrast medium diffuses from the arterial space into the interstitium and will remain there for the duration of the measurement [Citation24,Citation25,Citation28]. Thus, not considering the portal venous blood supply could lead to lower observed values for HBV in the PM model. PM’s considerably lower values for hepatic blood volume in the NLT might possibly also be explained by this, as a significantly larger proportion of the NLT blood supply is provided by the portal vein compared to the ablated areas, while, upon inspection, the lesions appeared to show a predominant arterial blood supply (see also the hepatic perfusion index in ).
The CNRs and SNRs also showed the overall highest values for HBV, which may lead to the conclusion that HBV might be preferable to visualize the lesions and especially the central necrosis, as the perfusion-differences between the areas may be optimally visualized. Even though visual delimitation of the lesion borders was still possible in low CNR images (e.g., CECT), the exact demarcation of the border between the lesion and the surrounding tissue became more difficult/unreliable with decreasing CNR.
Regarding mean transit time, we expected that the central necrotic parts of the lesion would show the lowest values, analogous to stroke imaging, while the outer parts, which still contain viable tissue, would present values between NLT and the necrotic central region [Citation14,Citation25]. Interestingly, only DIOC showed elevated duration for the ablated areas with the highest values in the central area of lesion, while the two deconvolution models revealed opposite results. However, as DIOC showed large variations in the measured values, as seen by high standard deviations and low CNR values, the results may not be tenable. Also, the high heat potentially damaged the capillary system and liver sinusoids, hindering contrast agent diffusion from the vascular to the extravascular space. Therefore, the one-compartment-assumption of the DIOC might not be fulfilled inside the lesion, corrupting computations in the single compartment model. The latter, however, would be in contradiction to the observed reduction in capillary permeability calculated by PM.
Altogether, considering the display of absolute values, CNRs, SNRs and inter/intrarater reliability, the DIDC delivered the most reliable parameter-maps and the highest CNRs for discrimination of the outer lesion border and the central necrotic zone, with the SIDC and DIMS models to be placed second. However, considering, that calculation and analysis of parameter-maps through the DIDC takes roughly two hours, it would not yet be feasible in clinical routine, were swift decision for or against re-ablation must be made, even though it might become clinically feasible with increasing computational power. The SIDC and DIMS are both significantly faster (both about 13 min), but the deconvolution model only requires the placement of two ROIs, while the DIMS requires placement of four ROIs and intact splenic perfusion. It might therefore be more prone to calculation errors in patients with portal hypertension, where arterial and portal venous perfusion is more difficult to separate [Citation29].
Limitations
There are several limitations to be observed: First, the pig liver differs from the human liver in its structure, since thicker interlobar septa are present with a potential influence on the heat distribution during MWA [Citation30]. Second, although all perfusion evaluations were carried out with the same specifications to enable comparability, results might change if the range for analysis, e.g., manual specification of CT value range or noise reduction level, differs for each algorithm, when set manually. Still, we choose this approach, to minimize any investigator-dependent influences. Third, we performed a shuttle perfusion with bidirectional table movement, resulting in a time delay of 3.8 s between the upper and lower end of the investigated region. Therefore, some rapidly changing parameters, such as the peak arterial enhancement might be displayed partially incorrect which could falsify the calculated perfusion parameters. However, this could be avoided by using a scanner with a wider detector [Citation31]. ROIs were used for analysis, which does not represent the lesion’s entire parameter-map and may lead to the following biases: As two observers manually placed the ROIs in the CT source images, it is possible that they were placed in different lesion areas, leading to a bias in the following data analysis, as the automatic placement of the following ROIs in the parameter maps would also be misplaced. However, the misplacement would be evident in all parameter maps and, although biasing the overall results, would probably not lead to a false preference of one algorithm. Secondly, even though we performed a correlation with histologic sections to ensure right ROI placement, the Jaccard-index of CTP source images and histologic sections showed that CTP source images could not provide a reliable representation of all lesions. This was partly to be expected, as CTP source images are similar to normal contrast-enhanced CT images. However, this complicates the correlation with histology for ROI placement, and possibly, ROIs might be misplaced in the wrong lesion zone, despite appearing correct in the CTP source images. Thirdly, the previous mentioned limitations can lead to a bias in the intraclass-correlation coefficient, which was used in addition to the Jaccard-index for assessment of inter- and intrarater agreement. It may thus not be excluded, that two ROIs show good ICC values despite of being placed in different lesion areas. It is also possible, that the different algorithms provide a varying visualization of the ablation zone, e.g., an asymmetrical expansion of in the border areas, which might not be reflected by the ROIs. However, to conduct a shape similarity analysis, prior definition of appropriate cut-off values for the display of the transitional lesion zone and central necrotic parts is required. Therefore, further research will be needed, which could include a complete co-registration of histology with the corresponding CT images, preferably using a deconvolution algorithm and an in-depth analysis of the shape of the lesions as displayed by perfusion imaging, contrast-enhanced CT and histology. As we used algorithms provided by Canon Medical Systems Cooperation, results may alter if algorithms from other vendors are used. Also, the DIDC is not yet commercially available.
Conclusion
Perfusion values vary between different algorithms. In clinical practice, for the task of visualizing hepatic lesions after MWA, deconvolution models seem to be preferable for future studies.
Supplemental Material
Download PDF (153.7 KB)Disclosure statement
B. Hamm has received research grants for the Department of Radiology, Charité-Universitätsmedizin Berlin from the following companies: (1) Abbott, (2) Actelion Pharmaceuticals, (3) Bayer Schering Pharma, (4) Bayer Vital, (5) BRACCO Group, (6) Bristol-Myers Squibb, (7) Charite Research Organisation GmbH, (8) Deutsche Krebshilfe, (9) Dt. Stiftung für Herzforschung, (10) Essex Pharma, (11) EU Programmes, (12) FibrexMedical Inc, (13) Focused Ultrasound Surgery Foundation, (14) Fraunhofer Gesellschaft, (15) Guerbet, (16) INC Research, (17) lnSightec Ud, (18) IPSEN Pharma, (19) Kendlel MorphoSys AG, (20) Lilly GmbH, (21) Lundbeck GmbH, (22) MeVis Medical Solutions AG, (23) Nexus Oncology, (24) Novartis, (25) Parexel Clinical Research Organisation Service, (26) Perceptive, (27) Pfizer GmbH, (28) Philipps, (29) Sanofis-Aventis S.A., (30) Siemens, (31) Spectranetics GmbH, (32) Terumo Medical Corporation, (33) TNS Healthcare GMbH, (34) Toshiba, (35) UCB Pharma, (36) Wyeth Pharma, (37) Zukunftsfond Berlin (TSB), (38) Amgen, (39) AO Foundation, (40) BARD, (41) BBraun, (42) Boehring Ingelheimer, (43) Brainsgate, (44) PPD (Clinical Research Organisation), (45) CELLACT Pharma, (46) Celgene, (47) CeloNova Bio-Sciences, (48) Covance, (49) DC Deviees, Ine. USA, (50) Ganymed, (51) Gilead Sciences, (52) GlaxoSmithKline, (53) ICON (Clinical Research Organisation), (54) Jansen, (55) LUX Bioseienees, (56) MedPass, (57) Merek, (58) Mologen, (59) Nuvisan, (60) Pluristem, (61) Quintiles, (62) Roehe, (63) SehumaeherGmbH (Sponsoring eines Workshops), (64) Seattle Geneties, (65) Symphogen, (66) TauRx Therapeuties Ud, (67) Accovion, (68) AIO: Arbeitsgemeinschaft Internistische Onkologie, (69) ASR Advanced sleep research, (70) Astellas, (71) Theradex, (72) Galena Biopharma, (73) Chiltern, (74) PRAint, (75) lnspiremd, (76) Medronic, (77) Respicardia, (78) Silena Therapeutics, (79) Spectrum Pharmaceuticals, (80) St Jude, (81) TEVA, (82) Theorem, (83) Abbvie, (84) Aesculap, (85) Biotronik, (86) Inventivhealth, (87) ISATherapeutics, (88) LYSARC, (89) MSD, (90) Novocure, (91) Ockham Oncology, (92) Premier-Research, (93) Psi-cro, (94) Tetec-ag, (95) Winicker-Norimed, (96) Achaogen Inc, (97) ADIR, (98) AstraZenaca AB, (99) Demira Inc, (100) Euroscreen S.A., (101) Galmed Research and Development Ltd, (102) GETNE, (103) Guidant Europe NV, (104) Holaira Inc, (105) Immunomedics Inc, (106) Innate Pharma, (107) Isis Pharmaceuticals Inc, (108) Kantar Health GmbH, (109) MedImmune Inc, (110) Medpace Germany GmbH (CRO), (111) Merrimack Pharmaceuticals Inc, (112) Millenium Pharmaceuticals Inc, (113) Orion Corporation Orion Pharma, (114) Pharmacyclics Inc, (115) PIQUR Therapeutics Ltd, (116) Pulmonx International Sárl, (117) Servier (CRO), (118) SGS Life Science Services (CRO), and (119) Treshold Pharmaceuticals Inc. The funding had no role in the study design, data collection and analysis, decision to publish, or preparation of the manuscript. The remaining authors declare that they have no conflicts of interest and did not receive any funds. There are no patents, products in development, or marketed products to declare.
Additional information
Funding
References
- Simon CJ, Dupuy DE, Mayo-Smith WW. Microwave ablation: principles and applications. RadioGraphics. 2005;25(suppl_1):S69–S83.
- Marin D, Cappabianca S, Serra N, et al. CT appearance of hepatocellular carcinoma after locoregional treatments: a comprehensive review. Gastroenterol Res Prac. 2015;2015:1.
- Moon S, Park S, Lee S-K, et al. Comparison of elastography, contrast-enhanced ultrasonography, and computed tomography for assessment of lesion margin after radiofrequency ablation in livers of healthy dogs. Am J Veter Res. 2017;78(3):295–304.
- DeWall RJ, Varghese T, Brace CL. Visualizing ex vivo radiofrequency and microwave ablation zones using electrode vibration elastography. Med Phys. 2012;39(11):6692–6700.
- Thieme SF, Vahldiek JL, Tummler K, et al. Value or waste: perfusion imaging following radiofrequency ablation – early experience. Clin Hemorheol Microcirc. 2015;61(2):323–331.
- Gemeinhardt O, Poch FG, Hiebl B, et al. Comparison of bipolar radiofrequency ablation zones in an in vivo porcine model: correlation of histology and gross pathological findings. Clin Hemorheol Microcirc. 2017;64(3):491–499.
- Braga L, Semelka RC, Pedro MS, et al. Post-treatment malignant liver lesions: MR imaging. Magn Reson Imaging Clin N Am. 2002;10(1):53–73.
- Puijk RS, Ruarus AH, Scheffer HJ, et al. Percutaneous liver tumour ablation: image guidance, endpoint assessment, and quality control. Can Assoc Radiol J. 2018;69(1):51–62.
- Ippolito D, Bonaffini PA, Capraro C, et al. Viable residual tumor tissue after radiofrequency ablation treatment in hepatocellular carcinoma: evaluation with CT perfusion. Abdom Imaging. 2013;38(3):502–510.
- Kudo K, Sasaki M, Ogasawara K, et al. Difference in tracer delay–induced effect among deconvolution algorithms in CT perfusion analysis: quantitative evaluation with digital phantoms. Radiology. 2009;251(1):241–249.
- Kudo K, Sasaki M, Yamada K, et al. Differences in CT perfusion maps generated by different commercial software: quantitative analysis by using identical source data of acute stroke patients. Radiology. 2010;254(1):200–209.
- Sanelli PC, Lev MH, Eastwood JD, et al. The effect of varying user-selected input parameters on quantitative values in CT perfusion maps1. Acad Radiol. 2004;11(10):1085–1092.
- Deniffel D, Boutelier T, Labani A, et al. Computed tomography perfusion measurements in renal lesions obtained by Bayesian estimation, advanced singular-value decomposition deconvolution, maximum slope, and Patlak models: intermodel agreement and diagnostic accuracy of tumor classification. Invest Radiol. 2018;53(8):477–485.
- Guyennon A, Mihaila M, Palma J, et al. Perfusion characterization of liver metastases from endocrine tumors: computed tomography perfusion. World J Radiol. 2010;2(11):449.
- Piper J, Ikeda Y, Fujisawa Y, et al. Objective evaluation of the correction by non-rigid registration of abdominal organ motion in low-dose 4D dynamic contrast-enhanced CT. Phys Med Biol. 2012;57(6):1701–1715.
- Lell MM, Wildberger JE, Alkadhi H, et al. Evolution in computed tomography: the battle for speed and dose. Invest Radiol. 2015;50(9):629–644.
- Yushkevich PA, Piven J, Hazlett HC, et al. User-guided 3D active contour segmentation of anatomical structures: significantly improved efficiency and reliability. Neuroimage. 2006;31(3):1116–1128.
- Abràmoff MD, Magalhães PJ, Ram SJ. Image processing with ImageJ. Biophotonics international. 2004;11(7):36–42.
- Schmid B, Schindelin J, Cardona A, et al. A high-level 3D visualization API for Java and ImageJ. BMC bioinformatics. 2010;11(1):274.
- R Core Team. 2017. [cited 2019 Oct 25]. Accessed at http://www.R-project.org/.
- Wickham H. ggplot2: elegant graphics for data analysis. New York: Springer; 2016.
- Koo TK, Li MY. A guideline of selecting and reporting intraclass correlation coefficients for reliability research. J Chiroprac Med. 2016;15(2):155–163.
- Wu P-H, Borden Z, Brace CL. Ablation zone visualization enhancement by periodic contrast-enhancement computed tomography during microwave ablation. Med Phys. 2017;44(6):2132–2140.
- Kim SH, Kamaya A, Willmann JK. CT perfusion of the liver: principles and applications in oncology. Radiology. 2014;272(2):322–344.
- Lui YW, Tang ER, Allmendinger AM, et al. Evaluation of CT perfusion in the setting of cerebral ischemia: patterns and pitfalls. Am J Neuroradiol. 2010;31(9):1552–1563.
- Winterdahl M, Sørensen M, Keiding S, et al. Hepatic blood perfusion estimated by dynamic contrast-enhanced computed tomography in pigs: limitations of the slope method. Invest Radiol. 2012;47(10):588–595.
- Liu Y, Matsui O. Changes of intratumoral microvessels and blood perfusion during establishment of hepatic metastases in mice. Radiology. 2007;243(2):386–395.
- Ng CS, Chandler AG, Wei W, et al. Effect of dual vascular input functions on CT perfusion parameter values and reproducibility in liver tumors and normal liver. J Comp Assist Tomography. 2012;36(4):388–393.
- Talakić E, Schaffellner S, Kniepeiss D, et al. CT perfusion imaging of the liver and the spleen in patients with cirrhosis: is there a correlation between perfusion and portal venous hypertension? Eur Radiol. 2017;27(10):4173–4180.
- Swindle MM, Makin A, Herron AJ, et al. Swine as models in biomedical research and toxicology testing. Vet Pathol. 2012;49(2):344–356.
- Wu D, Tan M, Zhou M, et al. Liver computed tomographic perfusion in the assessment of microvascular invasion in patients with small hepatocellular carcinoma. Invest Radiol. 2015;50(4):188–194.