
ABSTRACT
This paper gives an overview of recent progress in microstructure-specific hydrogen mapping techniques. The challenging nature of mapping hydrogen with high spatial resolution, i.e. at the scale of finest microstructural features, led to the development of various methodologies: thermal desorption spectrometry, silver decoration, the hydrogen microprint technique, secondary ion mass spectroscopy, atom probe tomography, neutron radiography, and the scanning Kelvin probe. These techniques have different characteristics regarding spatial and temporal resolution associated with microstructure-sensitive hydrogen detection. Employing these techniques in a site-specific manner together with other microstructure probing methods enables multi-scale, quantitative, three-dimensional, high spatial, and kinetic resolution hydrogen mapping, depending on the specific multi-probe approaches used. Here, we present a brief overview of the specific characteristics of each method and the progress resulting from their combined application to the field of hydrogen embrittlement.
This paper is part of a thematic issue on Hydrogen in Metallic Alloys
Introduction
Microstructure-specific hydrogen mapping has been recognised as the most important challenge on the pathway towards a better understanding of the nature of hydrogen embrittlement in metallic alloys, specifically in steels. Local presence of hydrogen is challenging to map due to its low mass, huge embrittling effect already at low concentrations, and high diffusivity in presence of compositional, thermal and mechanical gradients. For instance, the average hydrogen content in steels is of the order of 10−1 to 100 mass ppm, and some of the hydrogen is diffusible even at room temperature – an effect further enhanced in the presence of stress localisation effects. These complications render conventional chemically and spatially sensitive mapping methods such as energy dispersive X-ray spectroscopy or wavelength dispersive X-ray spectroscopy not readily applicable in the context of hydrogen embrittlement.
To enable both, spatially resolving and microstructure-sensitive hydrogen mapping, various approaches have been used, e.g. autoradiography [Citation1–3], scanning photoelectrochemical microscopy [Citation4–6], scanning electrochemical microscopy [Citation7,Citation8], secondary ion mass spectroscopy (SIMS) [Citation9–12], silver reduction and decoration [Citation13–17], the hydrogen microprint technique (HMT) [Citation18–21], scanning Kelvin probe force microscopy (SKPFM) [Citation22–26], atom probe tomography (APT) [Citation27–30], prompt γ activation analysis [Citation31], proton–proton (pp) scattering [Citation32–34], and neutron radiography [Citation35–39]. Additionally, a quantitative method for determining the hydrogen content at specific microstructural constituents with a characteristic trapping depth such as dislocations is available in terms of thermal desorption spectrometry (TDS) [Citation40–42]. Although this method does not provide spatially resolving mapping, hydrogen desorption rate profiles detected by TDS are microstructure-sensitive.
Initial efforts were devoted to achieving spatially resolved hydrogen mapping to correlate hydrogen segregation with specific microstructural characteristics, defect sites and fracture surface features. Since hydrogen-assisted cracking has been demonstrated to occur along internal interfaces such as phase and grain boundaries, the detection of localised hydrogen at such microstructural sites provided an explanation for the occurrence of hydrogen embrittlement even at very low average hydrogen content [Citation17,Citation43]. With the recent advances in highly defect-specific microstructure probing techniques, the request for corresponding progress also in highly spatially resolving hydrogen mapping has gained momentum. Regarding the spatial resolution necessary for correlating local hydrogen accumulation with specific phenomena such as interface decohesion, cracking, void formation and localised plasticity effects, ‘multi-scale’ hydrogen probing concepts have become important [Citation11]. This means that the transport and trapping of hydrogen has to be conducted over several microstructural scales in the same material. An atomic-scale example is the future challenge of mapping hydrogen trapping phenomena for instance at point or line defects e.g. occurring in the form of vacancy decoration or hydride formation at dislocations. Larger scale effects such as void and crack formation at hetero-interfaces, grain boundaries or triple interface junctions ranging over sub-μm to μm scales represent more collective decoration phenomena. At mesoscopic strain-localisation zones such as shear bands, hydrogen accumulation extends over a few tens to hundreds of μm. Regarding yet larger scales, hydrogen also segregates at the tips of stress concentration sources such as cracks and notches or surface reaction zones between the material surface and its environment which can even extend over sub-mm to mm regimes. Consequently, a corresponding demand for improved mechanism-sensitive, multi-probe and multi-scale hydrogen mapping protocols enabling micro- to mesoscopic hydrogen mapping has grown in recent years.
In addition to enhancing spatial resolution, quantification of local hydrogen content is another important goal of hydrogen mapping. A phenomenological relationship between the average hydrogen content and fracture strength has been well established [Citation44–46]. Yet, the capability of elucidating the underlying damage mechanisms behind this relationship requires experimental means that allow us to relate the hydrogen to its effects on specific microstructure features [Citation47,Citation48]. A crucial reason for the pronounced microstructure dependence of hydrogen embrittlement is the difference in the degree of hydrogen trapping and localisation. For predicting hydrogen embrittlement susceptibility in a comprehensive fashion, it is indispensable to reveal the quantitative relationships between specific microstructure features and the associated local hydrogen content. However, only a few prior works succeeded so far in applying such spatially highly resolved hydrogen mapping routines for quantifying the local hydrogen content in a microstructure-sensitive fashion. Therefore, an increasing number of studies has been recently devoted to the quantification of the local hydrogen content at microstructural resolution [Citation28,Citation49,Citation50].
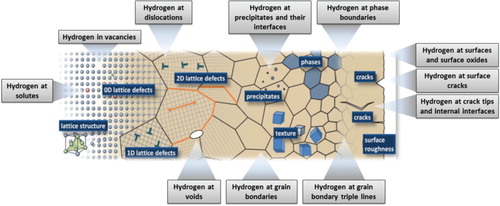
Another equivalently essential recent challenge lies in microstructure-sensitive hydrogen mapping with kinetic resolution. Kinetic hydrogen tracking is essential since the associated embrittlement phenomena are all characterised by pronounced strain rate [Citation46,Citation51,Citation52] and hydrogen exposure time dependences [Citation53–55]. The latter dependence is known as hydrogen-induced delayed fracture [Citation53,Citation54,Citation56]. It can be principally understood in terms of the permanent diffusion and redistribution of hydrogen inside materials with their wide range of potential trapping sites such as vacancies, dislocations, precipitates, grain boundaries, phase interfaces, triple points, micro- and nanocracks, voids and other defects that bind hydrogen and/or accelerate its transport, . Yet, to understand the specific underlying mechanisms that lead not only to the trapping of hydrogen but actually to time-dependent fracture, kinetic analysis of local hydrogen is also required, at best combined with spatial, i.e. microstructure-sensitive resolution.
Figure 1. Hydrogen can get trapped and transported at various types of lattice defects such as vacancies and certain solutes, dislocations, grain boundaries, phase interfaces, triple points, precipitates, micro- and nanocracks, surface steps, voids and also inside the surface oxide layers. The main challenge in identifying the governing mechanisms behind hydrogen embrittlement lies in mapping hydrogen trapping and kinetics with microstructural sensitivity.
Furthermore, three-dimensional characterisation of hydrogen distribution is another important challenge, since the hydrogen segregation behaviour depends also on stress triaxiality, distance from inner and outer surfaces, and microstructure features that are hidden underneath a specific target location. For instance, the effect of stress triaxiality has been recognised to assist hydrogen-related failure in notched specimens [Citation57–59]. In addition, effects associated with hydrogen diffusion to a probed surface from microstructures that are hidden underneath a specific target location may lead to misleading conclusions when only mapped in two-dimensions. These examples underscore the wide variety in methods, scales and goals associated with the mapping of hydrogen developed in recent years. Hence, in this paper, we review the recent progress made on microstructure-specific hydrogen detection methods enabling quantitative, three-dimensional, high spatial resolution, multi-scale, and kinetically resolved hydrogen mapping.
Quantification of local hydrogen content
The global hydrogen content, yet, energetically resolved as pertaining to specific types of lattice defects through their associated characteristic trapping energy, can be quantified through TDS. More specifically, TDS measurements conducted at different heating rates enable the determination of the activation energy of de-trapping from each type of lattice defect by analysing the resulting hydrogen desorption rate profiles [Citation40–42]. Accordingly, the cumulative hydrogen content associated with each of the TDS peaks that is characterised by a specific activation energy of the underlying trapping mechanism gives the local hydrogen content at each of these lattice defect traps. This approach depends on the assumption that the hydrogen trapping energies and the associated hydrogen escape kinetics do not overlap [Citation60]. Specifically, when the activation energy of hydrogen diffusion in the matrix is high, a corresponding trapping energy analysis cannot be properly applied. An important problem is for instance the analysis of hydrogen trapped at very weakly bonded trap sites in BCC steels which are characterised by an intrinsically high lattice diffusivity of hydrogen. The weakly trapped hydrogen can be desorbed even under cryogenic temperature conditions as schematically shown in (a). To solve this problem and better understand hydrogen captured in weak traps, cryogenic TDS (C-TDS) has been developed [Citation61,Citation62]. By initiating the TDS measurement at cryogenic temperatures, the full configuration of the TDS profile is obtained without losing the otherwise non-measurable, weakly trapped and diffusible hydrogen in the analysis. Accordingly, accurate and trap-specific activation energies and the corresponding trapped hydrogen content are acquired by such C-TDS experiments. In addition, C-TDS measurements are capable of uncovering new types of hydrogen desorption behaviour such as the recently discovered carbon effect on hydrogen desorption discussed below [Citation61]. An example of the C-TDS profile is shown in (b). This result indicates that an earlier undiscovered hydrogen desorption peak exists in the cryogenic temperature region as outlined by the red broken lines. Moreover, carbon addition of only 0.005 wt-% shifted the position of the main peak from ambient temperature to 0°C. These features could not have been revealed when subjecting hydrogen-decorated samples to conventional TDS analysis.
Figure 2. (a) Schematic of a hydrogen desorption profile together with indication of the corresponding trap sites. (b) Example of an experimentally obtained cryogenic TDS profile in two different Fe-C alloys with different carbon contents [Citation61]. ‘Reproduced with permission from Mater. Sci. Tech. (MS&T) 2011, 1279 (2011). Copyright 2011, Wiley-TMS’. The region emphasised in terms of the red box shows an example where a characteristic hydrogen trapping peak observe in an alloy with 6 mass ppm C has been shifted to much higher temperatures in an alloy with 50 mass ppm C.
![Figure 2. (a) Schematic of a hydrogen desorption profile together with indication of the corresponding trap sites. (b) Example of an experimentally obtained cryogenic TDS profile in two different Fe-C alloys with different carbon contents [Citation61]. ‘Reproduced with permission from Mater. Sci. Tech. (MS&T) 2011, 1279 (2011). Copyright 2011, Wiley-TMS’. The region emphasised in terms of the red box shows an example where a characteristic hydrogen trapping peak observe in an alloy with 6 mass ppm C has been shifted to much higher temperatures in an alloy with 50 mass ppm C.](/cms/asset/06a25cfb-9fb3-4d94-be38-4212790772a4/ymst_a_1299276_f0002_c.jpg)
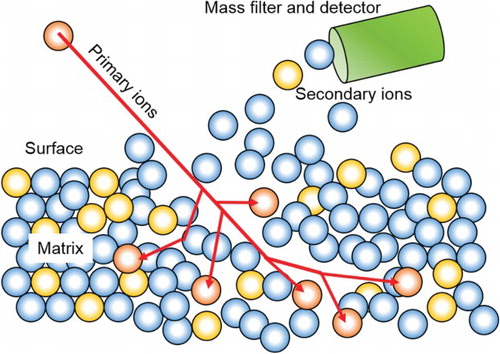
A next step in the microstructure-sensitive probing of hydrogen lies in using SIMS maps. A schematic of the SIMS technique is illustrated in . Spatially resolved SIMS that can detect the ion intensity of hydrogen or respectively deuterium has been studied as a quantitative mapping methodology for hydrogen that is trapped inside a specimen, as opposed to hydrogen that diffuses out towards the surface. Important aspects that may affect and even reduce the sensitivity of hydrogen detection by SIMS are as follows, in addition to other more minor experimental factors that were discussed in previous papers [Citation10,Citation63].
Hydrogen emission from moisture and adsorbed hydrocarbons deposited on the sample surface which alter the results.
Background hydrogen in the atmosphere of the SIMS chamber since hydrogen exists even under excellent ultra high vacuum (UHV) conditions.
Diffusion and desorption of hydrogen during the measurement in steels.
Effects associated with sputter direction, crystallographic texture and surface topology (also referred to as matrix effects).
Figure 3. SIMS is a surface sensitive chemical probing method. The material is kept under UHV. An ion beam is used to bombard the sample surface with high energy ions of an element not present in the sample. These ions sputter surface material off and a mass spectrometer is then used to analyse the mass of the so removed species, providing the elemental composition of the sputtered volume.
Further, yet minor factors affecting SIMS results are specimen edge effects and an influence of friction heat during mechanical polishing [Citation10]. Several measures have been suggested to reduce errors arising from these effects: The hydrogen emission from sources on the sample surface can be reduced by sputtering silicon onto an area surrounding the observation region [Citation10]. The use of high-purity sputtered silicon inhibits hydrogen emission. Reducing the background hydrogen existing in practically every SIMS chamber can be realised by a cold trap method using liquid nitrogen [Citation10]. Effects associated with surface roughness, sputter direction and texture can be reduced by carefully mapping these features and probing their specific influence on the results. Suited counter-measures include excellent surface preparation and representative selection of crystallographic orientations. As a result, a quantitative relationship between hydrogen content and hydrogen ion intensity was obtained successfully in a type 304 austenitic steel as shown in (a). Moreover, SIMS enables spatially resolved hydrogen mapping along the depth direction from the specimen surface as shown in (b) owing to its through thickness serial sectioning enabled by continuing sputtering. Such a depth profile was indeed obtained on a type 304 austenitic steel with Al and Fe–Al surface coating layers that prevented hydrogen uptake into the base material region of interest. Here, it was clearly demonstrated that hydrogen segregates to the interface of the Al/Fe–Al layers. In addition, hydrogen in a ferritic steel could be detected by SIMS measurements at 83 K [Citation64]. This successful example of a cryogenic SIMS measurement will be most likely further exploited and enhanced in the future to enable quantification of the hydrogen content in materials where it has high diffusivity such as in ferritic steels.
Figure 4. An example of SIMS analysis: hydrogen mapping from the Al-based layer-coated surface of a type 304 austenitic stainless steel. (a) Quantitative relationship between ion intensity and hydrogen content. TDA: thermal desorption analysis [Citation65]. cps: count per second. IHN: net intensity of hydrogen. (b) Depth profile of ion intensity [Citation49]. Hydrogen segregates at the Al/Al-Fe interface. ‘Reproduced with permission from Int. J. Hydrogen Energy, 38, 10152 (2013) and 40, 10336 (2015). Copyright 2013&2015, Elsevier’.
![Figure 4. An example of SIMS analysis: hydrogen mapping from the Al-based layer-coated surface of a type 304 austenitic stainless steel. (a) Quantitative relationship between ion intensity and hydrogen content. TDA: thermal desorption analysis [Citation65]. cps: count per second. IHN: net intensity of hydrogen. (b) Depth profile of ion intensity [Citation49]. Hydrogen segregates at the Al/Al-Fe interface. ‘Reproduced with permission from Int. J. Hydrogen Energy, 38, 10152 (2013) and 40, 10336 (2015). Copyright 2013&2015, Elsevier’.](/cms/asset/9563586b-8c24-4380-a0ec-d6fd9862fe26/ymst_a_1299276_f0004_c.jpg)
Recently, the scanning Kelvin probe (SKP) approach has received attention as an alternative approach to determine local hydrogen content quantitatively owing to its potential to resolve hydrogen both with high spatial microstructural resolution on the micro- and even submicroscale as well as with temporal resolution, i.e. it also reveals the permeation and release kinetics at high spatial resolution [Citation24,Citation50,Citation66]. shows a schematic illustration of a SKP analysis. Under certain conditions, such as when a palladium detection layer is used [Citation24,Citation66] (see also Section ‘Multi-scale and high spatial resolution hydrogen mapping’), the probed surface potential of a sample can be calibrated to provide direct correlation with the local hydrogen concentration. In such as case SKP mapping is capable of revealing the hydrogen distribution on sample surfaces. More specifically, the surface potential decreases with increasing hydrogen content [Citation66]. Also the potential mapping directly on the passive film of steels or aluminium provides information about hydrogen distribution inside the material. For instance, the hydrogen distribution in the vicinity of a pit formed in an MgCl2 droplet in a UNS S46500 precipitation-hardened stainless steel could be resolved with high spatial resolution as shown in . Since the potential around the pit is locally low as shown in (b), this result indicates that the MgCl2 droplet enabled formation of hydrogen during the pitting.
Figure 5. A schematic illustration of a setup for scanning Kelvin probe (SKP) mapping [Citation22]. KP: Kelvin probe. Uext: applied external bias. Iac: ac-current resulting from harmonic modulation of the capacitance. : difference between Volta potentials of the KP and the sample. ‘Reproduced with permission from Electrochem. Acta, 53, 290 (2007). Copyright 2007, Elsevier’.
![Figure 5. A schematic illustration of a setup for scanning Kelvin probe (SKP) mapping [Citation22]. KP: Kelvin probe. Uext: applied external bias. Iac: ac-current resulting from harmonic modulation of the capacitance. : difference between Volta potentials of the KP and the sample. ‘Reproduced with permission from Electrochem. Acta, 53, 290 (2007). Copyright 2007, Elsevier’.](/cms/asset/33d359ae-4cc5-4983-a6eb-08cd92c6ed69/ymst_a_1299276_f0005_b.gif)
Figure 6. Diffusible hydrogen distribution at a pit visualised by SKP [Citation50]. (a) The schematic shows a droplet pre-exposure on a surface with the location of the cross-section cut depicted in (b). (b) SKP potential map obtained on a UNS S46500 precipitation-hardened stainless steel. The SKP measurement was carried out on a cross-sectional area of the specimen containing the pit as shown in (a). ‘Reproduced with permission from Electrochem. Comm., 63, 6-7 (2016). Copyright 2016, Elsevier’.
![Figure 6. Diffusible hydrogen distribution at a pit visualised by SKP [Citation50]. (a) The schematic shows a droplet pre-exposure on a surface with the location of the cross-section cut depicted in (b). (b) SKP potential map obtained on a UNS S46500 precipitation-hardened stainless steel. The SKP measurement was carried out on a cross-sectional area of the specimen containing the pit as shown in (a). ‘Reproduced with permission from Electrochem. Comm., 63, 6-7 (2016). Copyright 2016, Elsevier’.](/cms/asset/f64e76ea-d8f1-491f-a3e0-7abb413a4c55/ymst_a_1299276_f0006_c.jpg)
Multi-scale and high spatial resolution hydrogen mapping
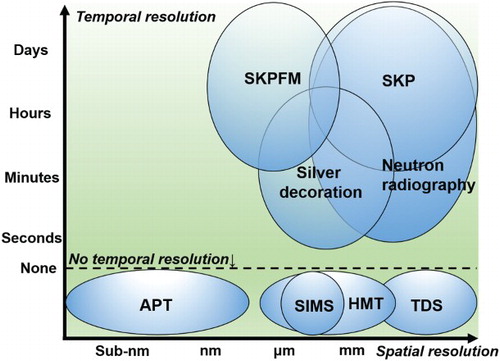
A wide range of spatial resolution regimes has become accessible through the use of various types of hydrogen mapping techniques as shown in . To realise even nm-scale microstructural hydrogen mapping, atomic force microscopy-based SKPFM has been applied instead of SKP [Citation11,Citation23,Citation25,Citation67]. Since SKPFM is not equipped with a reference electrode and switching to a suitable reference is difficult to achieve during scanning a given area of the investigated sample, the values obtained are not calibrated. This prevents exact hydrogen quantification, as it is possible when conducting SKP on Pd coated samples (see [Citation24,Citation66]). However, the potential contrast within the scanned area and the relative changes in that contrast can provide valuable information about the locally evading hydrogen. In a recent study involving SKPFM, a pronounced improvement in hydrogen detection was accomplished by coating the specimen surface with a thin 100-nm palladium layer serving as a buffer and storage material as schematically shown in (a–c). The two main aspects that are currently under investigation concerning the use of the atomic force microscopy-based SKPFM in conjunction with the use of a palladium coating are as follows:
The chemical potential of hydrogen in palladium is much lower than that in steel. Therefore, the palladium stores the hydrogen that diffuses out of the steel microstructure and serves, hence, as a detection or respectively buffer layer. This effect still allows visualisation of the location of the hydrogen accumulation even after larger time delays, as lateral diffusion of hydrogen inside the Pd layer is inhibited as consequence of its nano-crystalline fcc structure [Citation24].
The microstructure-dependent formation of locally different oxide films on the surface of the sample under inspection complicates establishing the relationship between the surface potential detected by atomic force microscopy SKPFM and the resulting hydrogen concentration values. This was up to now a critical problem for corresponding Kelvin probe hydrogen probing techniques but the use of palladium coatings has resolved this problem as its buffer effect collects the locally evading hydrogen independent of the nature of the underlying oxide, reliably accumulating it over a certain time constant [Citation24].
Figure 7. The specimen is (a) first mechanically polished and (b) subsequently hydrogen-charged. (c) The scanning Kelvin probe force microscopy (SKPFM) is carried out after the palladium coating [Citation25]. ‘Reproduced with permission from J. Electrochem. Soc., 160, C643 (2015). Copyright 2015, The Electrochemical Society’.
![Figure 7. The specimen is (a) first mechanically polished and (b) subsequently hydrogen-charged. (c) The scanning Kelvin probe force microscopy (SKPFM) is carried out after the palladium coating [Citation25]. ‘Reproduced with permission from J. Electrochem. Soc., 160, C643 (2015). Copyright 2015, The Electrochemical Society’.](/cms/asset/c9cdf2b1-6312-4da8-b8f3-0da86f92ea2f/ymst_a_1299276_f0007_c.jpg)
Table 1. Summary of specifications of currently used hydrogen mapping methods.
As a result, the use of SKPFM enables measurement of hydrogen down to a scale below 0.01 atomic ppm at a spatial resolution of several tens of nanometres [Citation25]. (a) shows an example of a SKPFM measurement in an austenite/α′-martensite dual-phase microstructure. Here, low-potential regions appear in the α′-martensite. Moreover, additional low-potential regions are observed at the martensite–martensite grain boundaries as indicated by arrows. Hence, hydrogen localises on the martensite–martensite grain boundaries. Correspondingly, hydrogen-assisted damage was observed at the martensite–martensite grain boundaries [Citation17].
Figure 8. Multi-scale, multi-kinetics and multi-probe visualisation of interfacial hydrogen segregation through an optimised silver reduction and decoration method coupled with SKPFM in a Fe–32Ni–0.2C austenite/α′-martensite dual-phase alloy (wt-%) covered by a palladium protective surface layer [Citation17]. (a) Scanning Kelvin probe force micrograph taken after an exposure time of 5 h in nitrogen gas atmosphere. (b) Optical and (c) scanning electron micrographs. The white and yellow arrows in Figs. 8a and 8c, respectively, indicate the matching observation of interfacial segregation of hydrogen. ‘Reproduced with permission from Mater. Corros., DOI: 10.1002/maco.201609104, Copyright 2016 WILEY-VCH Verlag GmbH & Co. KGaA’.
![Figure 8. Multi-scale, multi-kinetics and multi-probe visualisation of interfacial hydrogen segregation through an optimised silver reduction and decoration method coupled with SKPFM in a Fe–32Ni–0.2C austenite/α′-martensite dual-phase alloy (wt-%) covered by a palladium protective surface layer [Citation17]. (a) Scanning Kelvin probe force micrograph taken after an exposure time of 5 h in nitrogen gas atmosphere. (b) Optical and (c) scanning electron micrographs. The white and yellow arrows in Figs. 8a and 8c, respectively, indicate the matching observation of interfacial segregation of hydrogen. ‘Reproduced with permission from Mater. Corros., DOI: 10.1002/maco.201609104, Copyright 2016 WILEY-VCH Verlag GmbH & Co. KGaA’.](/cms/asset/1bb3ce06-dfe7-4fb7-b036-a3b431a1b4f1/ymst_a_1299276_f0008_c.jpg)
The silver reduction and decoration technique schematically shown in is helpful as a more qualitative hydrogen detection method to supplement the quantitative SKPFM results for the following reasons: Silver decoration is a technique that utilises a hydrogen-driven reduction reaction of silver ions from a potassium silver cyanide aqueous solution on the specimen surface, which easily enables multi-scale observation of hydrogen distribution from microstructure-interfacial segregation to sub-mm-scale hydrogen partitioning. This approach is particularly helpful when aiming at first identifying preferred hydrogen storage positions in the microstructure which then can be subjected to higher locally resolving or more quantitative probing methods. (b) shows an optical micrograph of the same steel microstructure as in (a). In the optical micrograph, silver particles appear as black (in this case, diffusible hydrogen localises inside the α′-martensite), visualising hydrogen partitioning. Further magnification of the image using scanning electron microscopy indicates hydrogen segregation on martensite/martensite grain boundaries as indicated by the yellow arrows in (c). In such cases the silver decoration technique can be coupled with SKPFM, since both methods allow to detect hydrogen that evades from the surface with high microstructural sensitivity. Regarding kinetic resolution, it should be noted that the silver decoration technique is capable of detecting diffusible hydrogen also at high effusion rates already at early stages immediately after hydrogen charging. In contrast, the SKPFM is preferentially suited for studying lower effusion rates at later stages, as it takes some time before the first measurement can be started. Therefore, a combined use of silver decoration and SKPFM enables ‘multi-time and multi-scale’ hydrogen mapping with complementary information regarding effusion kinetics.
Figure 9. Mechanically polished specimens for the silver reduction and decoration method are immersed into a chemical solution containing silver ions [Citation11]. In a redox reaction the silver ions are then locally replaced by evading hydrogen atoms so that Ag is deposited, thereby marking the regions of enhanced hydrogen concentration. ‘Reproduced with permission from Acta Mater., 109, 69 (2016). Copyright 2016, Elsevier’.
![Figure 9. Mechanically polished specimens for the silver reduction and decoration method are immersed into a chemical solution containing silver ions [Citation11]. In a redox reaction the silver ions are then locally replaced by evading hydrogen atoms so that Ag is deposited, thereby marking the regions of enhanced hydrogen concentration. ‘Reproduced with permission from Acta Mater., 109, 69 (2016). Copyright 2016, Elsevier’.](/cms/asset/3b140882-93db-41d1-90c9-cf1b26ce4106/ymst_a_1299276_f0009_c.jpg)
The maximum attainable spatial and chemical resolution for resolving the position of hydrogen can be achieved by APT (). This method combines well-controlled field evaporation and ionisation of surface atoms layer-wise from a tip-shaped specimen in combination with time of flight mass-to-charge spectroscopy and a position-sensitive detector. Field evaporation is triggered by exposing the positively biased tip-shaped specimen to a combination of a permanent high electrical field and either additional ultra-fast voltage pulses for local field enhancement or additional ultra-fast laser pulses for local temperature increase. The specimen apex has typically a radius of curvature of 60–100 nm. The time of flight serves for chemical analysis though mass-to-charge spectroscopy and the impact regions on the position-sensitive multi-channel detector serve for the determination of the original position of the field-evaporated ions within the sample. A three-dimensional elemental map can thus be reconstructed from the collected data, applying an inverse projection of the detector coordinates to the tip surface. Depth-scaling is done taking into account the sequence and volumes of the detected ions. Typical dimensions of the analysed volume can comprise up to one billion atoms on current state of the art instruments [Citation68–70].
Figure 10. APT enables three-dimensional elemental mapping with near atomic resolution [Citation71]. By applying either ultra-fast high voltage or laser pulses to a positively biased tip-shaped specimen, surface atoms are layer-wise field-evaporated. They get ionised and accelerated towards a position-sensitive detector that records their time of flight (for chemical analysis) and impact positions (for determination of the original position within the sample). A three-dimensional elemental map can be reconstructed from the collected data, applying an inverse projection of the detector coordinates to the tip surface. Depth-scaling is done taking into account the sequence and volumes of detected atoms [Citation68–70]. ‘Reproduced with permission from Ultramicroscopy, 111, 1619–1624 (2011). Copyright 2011, Elsevier’.
![Figure 10. APT enables three-dimensional elemental mapping with near atomic resolution [Citation71]. By applying either ultra-fast high voltage or laser pulses to a positively biased tip-shaped specimen, surface atoms are layer-wise field-evaporated. They get ionised and accelerated towards a position-sensitive detector that records their time of flight (for chemical analysis) and impact positions (for determination of the original position within the sample). A three-dimensional elemental map can be reconstructed from the collected data, applying an inverse projection of the detector coordinates to the tip surface. Depth-scaling is done taking into account the sequence and volumes of detected atoms [Citation68–70]. ‘Reproduced with permission from Ultramicroscopy, 111, 1619–1624 (2011). Copyright 2011, Elsevier’.](/cms/asset/a30f0d89-15a5-43cf-aa1b-44b17117b755/ymst_a_1299276_f0010_c.jpg)
As an example, (a) shows deuterium segregation at a vanadium carbide (VC) precipitate observed by APT. Here, to distinguish hydrogen in the specimen from background hydrogen, deuterium was introduced instead of hydrogen. The deuterium distribution at VC precipitates is stable during the measurement at 50–70 K, since VC precipitates act as hydrogen trap sites [Citation72]. The atomistic visualisation is helpful as a direct evidence of hydrogen traps at a specific microstructural feature. Since hydrogen is present even in ultrahigh vacuum environments deuterium charging is typically more suited for revealing specific microstructure features and decoration sites, (b).
Figure 11. (a) APT revealing the deuterium distribution at a VC precipitate [Citation28]. (b) Comparison of deuterium and hydrogen distributions in Ag, revealing that deuterium is more indicative when aiming to reveal microstructure-related effects [Citation29]. Hydrogen is ubiquitous in any ultrahigh vacuum system, hence, APT experiments are better conducted using deuterium charging. ‘Reproduced with permission from Scripta Mater., 67, 215 (2012). Copyright 2012, Elsevier and Int. J. Hydrogen Energy, 39, 12225 (2014). Copyright 2014, Elsevier’.
![Figure 11. (a) APT revealing the deuterium distribution at a VC precipitate [Citation28]. (b) Comparison of deuterium and hydrogen distributions in Ag, revealing that deuterium is more indicative when aiming to reveal microstructure-related effects [Citation29]. Hydrogen is ubiquitous in any ultrahigh vacuum system, hence, APT experiments are better conducted using deuterium charging. ‘Reproduced with permission from Scripta Mater., 67, 215 (2012). Copyright 2012, Elsevier and Int. J. Hydrogen Energy, 39, 12225 (2014). Copyright 2014, Elsevier’.](/cms/asset/b3ead937-8630-45aa-b253-05fc2fb32fdd/ymst_a_1299276_f0011_c.jpg)
Three-dimensional hydrogen mapping
From a viewpoint of tomographic hydrogen mapping at microstructure scales, APT provides the most precise access to imaging hydrogen in three dimensions at highest, namely near-atomic spatial resolution as mentioned above. In addition, conducting SIMS mappings in conjunction with through thickness serial sectioning enabled by continuing material removal via sputtering is expected to also map hydrogen in three dimensions at a wider field of view than APT. These techniques are both powerful and promising as destructive methods for the three-dimensional microstructure-specific hydrogen mapping.
As non-destructive approaches to the microstructure-specific three-dimensional mapping of hydrogen, the proton–proton-scattering method in conjunction with split field magnetic detectors and the related neutron radiography have been developed. In particular, the neutron radiography has been applied successfully to the detection of hydrogen in iron [Citation38]. shows a schematic image of the setup used for the tomographic analysis of hydrogen via neutron radiography. Neutrons interact with protons, i.e. with the cores of hydrogen. Since the degree of the interaction between the incoming neutrons and the protons is higher than that between neutron and isotopes of iron, a clear contrast between hydrogen-enriched and hydrogen-depleted regions appears on the neutron intensity map. Through a scintillator, the neutron intensity map can be visualised as an optical image. The images are taken along different orientations for obtaining a corresponding reconstructured tomographic characterisation. This is achieved by rotating the sample stepwise through an angular range of 360°. This method enables a full scale three-dimensional mapping of the hydrogen distribution in a specimen including the tomographic imaging of hydrogen-related cracks and voids. An example for the case of hydrogen in ARMCO iron is demonstrated in . (a) exhibits the specimen surface with blisters after electrochemical hydrogen-charging. The corresponding cracks are observed in (b). The three-dimensionally mapping reveals that hydrogen segregates at blisters on the specimen surface.
Figure 12. A schematic showing the setup used for tomographic analysis by neutron radiography [Citation38]. ‘Reproduced with permission from Acta Mater., 78, 14 (2014). Copyright 2014, Elsevier’.
![Figure 12. A schematic showing the setup used for tomographic analysis by neutron radiography [Citation38]. ‘Reproduced with permission from Acta Mater., 78, 14 (2014). Copyright 2014, Elsevier’.](/cms/asset/460f39e6-609b-4a09-95a8-886f3aa1d57f/ymst_a_1299276_f0012_c.jpg)
Figure 13. A three-dimensional hydrogen map of a hydrogen-charged ARMCO iron sample taken by neutron radiography [Citation38]. (a) Surface region with blisters. (b) Crack distribution inside the sample. (c) Hydrogen distribution. ‘Reproduced with permission from Acta Mater., 78, 14 (2014). Copyright 2014, Elsevier’.
![Figure 13. A three-dimensional hydrogen map of a hydrogen-charged ARMCO iron sample taken by neutron radiography [Citation38]. (a) Surface region with blisters. (b) Crack distribution inside the sample. (c) Hydrogen distribution. ‘Reproduced with permission from Acta Mater., 78, 14 (2014). Copyright 2014, Elsevier’.](/cms/asset/e7d0918c-075f-4689-a15d-566f1d216109/ymst_a_1299276_f0013_b.gif)
Kinetically resolved hydrogen mapping
The temporal resolution column given in provides a comparison among the different hydrogen mapping methods in terms of their respective capability to reveal hydrogen release kinetics. shows that a substantial advantage of the SKP and SKPFM approaches lies in their accessibility of kinetic release data. shows the surface potential change as a function of time in an austenitic twinning-induced-plasticity steel [Citation25]. The specimen surface was coated with palladium. The low-potential regions appear in the form of a platelike morphology, here visible as dark regions. The platelike low-potential regions correspond to the locations of deformation twins. In particular, a clear contrast change was observed in the outlined region that contains fairly thick deformation twins. The contrast in the outlined region is not distinct at first ((a)); but upon continuing probing the changing contrast reveals increasingly clearly the preferred hydrogen release from the deformation twins ((b)). The released hydrogen is reshuffling from the specimen interior into the palladium layer where it is accumulated and detected upon release. After prolonged probing time (300 h), the contrast disappears again because of the gradually completed hydrogen desorption ((c)), i.e. the source that causes the potential change that is being exploited as signal indicative of the presence of hydrogen becomes exhausted. The sequential change in the local hydrogen release signal with time is shown in the form of variations of the corresponding line profiles in (d). This result indicates that deformation twins play an important role in hydrogen segregation, and the hydrogen atoms at deformation twins are diffusible at ambient temperature. This kinetic approach offered by the SKPFM has also been successfully applied to revealing also other hydrogen trap sites such as at inclusions [Citation24] and second phases [Citation23,Citation26] in steels.
Figure 14. Time-dependent variation of the hydrogen distribution analysed by SKPFM in a Fe–18Mn–1.2C twinning-induced-plasticity steel (wt-%) covered with a palladium buffer layer [Citation25]. Surface potential images taken at exposure times of (a) 6, (b) 67, (c) 300 h, respectively. (d) Line profiles of the detected surface potential corresponding to the white lines in (a–c). The black arrows indicate hydrogen segregation at deformation twins. ‘Reproduced with permission from J. Electrochem. Soc., 160, C643 (2015). Copyright 2015, The Electrochemical Society’.
![Figure 14. Time-dependent variation of the hydrogen distribution analysed by SKPFM in a Fe–18Mn–1.2C twinning-induced-plasticity steel (wt-%) covered with a palladium buffer layer [Citation25]. Surface potential images taken at exposure times of (a) 6, (b) 67, (c) 300 h, respectively. (d) Line profiles of the detected surface potential corresponding to the white lines in (a–c). The black arrows indicate hydrogen segregation at deformation twins. ‘Reproduced with permission from J. Electrochem. Soc., 160, C643 (2015). Copyright 2015, The Electrochemical Society’.](/cms/asset/569813de-c2e2-41cd-ae36-9dc1eec591cd/ymst_a_1299276_f0014_c.jpg)
Kinetic analysis of the microstructural hydrogen distribution has been also attempted through different other approaches in recent years. For instance, the exposure-time dependence of the mapped hydrogen distribution was analysed through an in situ silver decoration technique [Citation73]. shows the evolution of the silver decoration with time during hydrogen permeation in an annealed pure iron specimen. In this experiment, the top surface of the specimen was immersed in a potassium silver cyanide aqueous solution. Hydrogen was introduced by electrochemical charging on the bottom surface of the specimen at ambient temperature. A hydrogen-driven redox reaction occurs when hydrogen permeates through the specimen. An optical lens with a long focal length was used for the optical microscope to enable in situ observations of the specimen surface without contacting the potassium silver cyanide aqueous solution. Silver deposition occurred preferentially at grain boundaries, and the occupation fraction of silver particles on the grain boundaries increased with time. A time-dependent variation of the evading hydrogen flux along the grain boundaries was revealed through this methodology. When coupled with electron backscatter diffraction (EBSD) analysis, this experiment also revealed that the hydrogen flux at low-angle grain boundaries is lower than that at high-angle grain boundaries.
Figure 15. Results of the in situ optical microscopy observations of Ag deposition during the hydrogen permeation testing at (a) 0, (b) 55, (c) 90 min in an annealed pure iron specimen [Citation73]. ‘Reproduced with permission from Scripta Mater., 129, 49 (2017). Copyright 2017, Elsevier’.
![Figure 15. Results of the in situ optical microscopy observations of Ag deposition during the hydrogen permeation testing at (a) 0, (b) 55, (c) 90 min in an annealed pure iron specimen [Citation73]. ‘Reproduced with permission from Scripta Mater., 129, 49 (2017). Copyright 2017, Elsevier’.](/cms/asset/83a10193-c4d2-430a-b8ad-9d14961d7d4f/ymst_a_1299276_f0015_b.gif)
In addition to these effects, the influence of residual elastic stresses has recently been suggested to explain the strain rate dependence associated with the steel’s hydrogen embrittlement susceptibility. Characterisation of the effects of stresses on hydrogen mapping has been carried out through HMT probing [Citation74,Citation75]. The basic procedure of the HMT is demonstrated in . In a recent work, a slow strain rate test was carried out in a specimen in conjunction with an HMT emulsion containing AgBr. shows a set of results obtained from a HMT experiment conducted on a martensitic steel. A HMT result without any mechanical loading is shown in (a) for reference. This image demonstrates that no specific hydrogen segregation occurs when the specimen is not mechanically stressed. In contrast, as shown in (b), the HMT result obtained after the slow strain rate test that was conducted until fracture at a strain rate of 8.3 × 10⁻⁶ s−1 demonstrates that hydrogen segregates along grain boundaries. More specifically, when coupled with an EBSD analysis as shown in (c), preferential hydrogen segregation occurs along the prior austenite grain boundaries, but not on packet boundaries or any other of the characteristic martensite boundaries such as lath interfaces (please see references for the microstructure features of lath martensite [Citation76,Citation77]). In fact, fracture at the here imposed low strain rate occurred already when the sample was loaded only into the elastic regime, and such hydrogen segregation was not observed when the specimen was fractured at a high strain rate (8.3 × 10⁻¹ s−1). Accordingly, the intergranular fracture was observed when deforming at a low strain rate, and the brittle features disappeared when the sample was deformed at a high strain rate. These observations indicate the essential role of mapping both, stress and time in concert with a microstructure-sensitive and spatially resolving signal associated with hydrogen segregation as well as with the resulting microstructural hydrogen embrittlement features.
Figure 16. A schematic of the basic procedure used for the HMT [Citation20]. ‘Reproduced with permission from Metallogr. Microstruct. Anal., 1, 79 (2012). Copyright 2012, Springer’.
![Figure 16. A schematic of the basic procedure used for the HMT [Citation20]. ‘Reproduced with permission from Metallogr. Microstruct. Anal., 1, 79 (2012). Copyright 2012, Springer’.](/cms/asset/9d54564d-1548-4e0c-893f-cf586fd2baac/ymst_a_1299276_f0016_b.gif)
Figure 17. HMT results obtained on a 0.2 wt-%C martensitic steel. (a) HMT without any mechanical loading. (b) HMT after slow strain rate testing at an initial strain rate of 8.3 × 10⁻⁶ s−1 revealing that the prior austenite grain boundaries get decorated by hydrogen. (c) Corresponding inverse pole figure map. The slow strain rate test was carried out on a specimen coated with a AgBr emulsion for the HMT [Citation75]. ‘Reproduced with permission from Mater. Today, 2S, 737 (2015). Copyright 2015, Elsevier’.
![Figure 17. HMT results obtained on a 0.2 wt-%C martensitic steel. (a) HMT without any mechanical loading. (b) HMT after slow strain rate testing at an initial strain rate of 8.3 × 10⁻⁶ s−1 revealing that the prior austenite grain boundaries get decorated by hydrogen. (c) Corresponding inverse pole figure map. The slow strain rate test was carried out on a specimen coated with a AgBr emulsion for the HMT [Citation75]. ‘Reproduced with permission from Mater. Today, 2S, 737 (2015). Copyright 2015, Elsevier’.](/cms/asset/38e59d5a-1829-40d5-9012-8f7b2118f533/ymst_a_1299276_f0017_c.jpg)
Detection of dynamic hydrogen desorption associated with martensitic transformation
In the previous sections, we introduced recent hydrogen mapping experiments demonstrating hydrogen localisation behaviour under static or quasi-static conditions. Another crucial factor affecting the hydrogen distribution is the martensitic transformation itself. Since hydrogen solubility and diffusivity both strongly depend on crystal structure, the dynamic change in crystal structure occurring upon martensitic transformations must necessarily affect the hydrogen re-distribution in metastable steels. With these considerations in mind, a C-TDS process accompanied by cooling was utilised to detect the dynamic hydrogen desorption during martensitic transformation [Citation78]. shows the hydrogen desorption profile observed in a hydrogen-charged Fe–31 wt-%Ni metastable austenitic alloy during cooling and subsequent heating. Initially the alloy was in fully austenitic phase state. Then, the austenite started to transform into α′-martensite when reaching the transformation start temperature Ms upon cooling. Accordingly, hydrogen desorption occurred at the Ms temperature as shown in . This observation indicates that hydrogen desorption occurs when α′-martensite is induced even at cryogenic temperatures. Factors causing the hydrogen desorption associated with martensitic transformations are considered to be (1) hydrogen-decorated motion of misfit dislocations that are associated with the transformation and (2) a change in local diffusivity because of the crystallographic transition. Since the heating process without the transformation also displays similar hydrogen desorption behaviour, the major reason for the transformation-induced hydrogen desorption was attributed to a change in local diffusivity caused by the transition from a close-packed structure (FCC) to a non-close-packed structure (BCC). The same experiment was also performed for an ε-martensitic transformation which has practically the same packing density as the FCC phase. In the case of ε-martensitic transformation, the peak intensity of the hydrogen desorption rate was relatively small compared to the case of the α′-martensitic transformation, but it was still readily observed [Citation78]. This technique will be helpful as an important tool to enable a more quantitative understanding of hydrogen embrittlement susceptibility of transformation-induced-plasticity (TRIP) steels.
Figure 18. Cooling-induced hydrogen desorption associated with the α′-martensitic transformation in the Fe − 31 wt-%Ni alloy [Citation78]. ‘Reproduced with permission from Scripta Mater., 122, 52 (2016). Copyright 2017, Elsevier’.
![Figure 18. Cooling-induced hydrogen desorption associated with the α′-martensitic transformation in the Fe − 31 wt-%Ni alloy [Citation78]. ‘Reproduced with permission from Scripta Mater., 122, 52 (2016). Copyright 2017, Elsevier’.](/cms/asset/aac30f03-92cc-44c0-9a4e-25936ed2aa44/ymst_a_1299276_f0018_c.jpg)
Summary and outlook
Here we reviewed recently developed and matured methods for the microstructure-sensitive mapping of hydrogen. More specifically, we discussed TDS, silver reduction and decoration, the HMT, SIMS, APT, neutron radiography, and the scanning Kelvin probe methods (SKP and SKPFM). The specifications of the respective methods were summarised in and .
Figure 19. Overview diagram of different types of hydrogen mapping techniques plotted against their respective temporal and spatial resolution regimes. Note that the temporal resolution ranges during SKPFM and SKP probing are seconds, but they can usually start only after 1 h from hydrogen charging.
We have shown results that demonstrate how suited combinations of these methods can help to satisfy recent demands regarding better multi-scale, multi-probe and multi-kinetics hydrogen mapping. For instance, a combination of silver decoration and SKPFM enables multi-scale and kinetically resolved hydrogen mapping. A combination of SKP and SKPFM enables quantitative mapping with high spatial resolution of several tens of nanometres. SIMS coupled with TDS allows for quantitative mapping of local hydrogen in a specimen with microstructural resolution with particular focus on the roles of interfaces and second phases. Possibly, APT coupled with SIMS and neutron radiography will enable multi-scale three-dimensional hydrogen mapping. However, for future lines of research, there are still important challenges remaining: these are the quantification of SIMS data in ferritic steels, visual detection of plastic-deformation-induced hydrogen desorption, atomistic or near atomistic observation of diffusible and weakly trapped hydrogen and improved direct correlations between hydrogen and single lattice-defects and their change upon mechanical loading. Addressing, improving and finally solving these challenges opens a pathway towards elucidating hydrogen segregation-related mechanisms of hydrogen embrittlement in steels.
Disclosure statement
No potential conflict of interest was reported by the author(s).
ORCiD
Motomichi Koyama http://orcid.org/0000-0002-5006-9976
Eiji Akiyama http://orcid.org/0000-0001-6916-3703
Additional information
Funding
References
- Aasaoka T, Lapasset G, Aucouturier M, et al. Observation of hydrogen trapping in Fe-0.15 Wt% Ti alloy by high resolution autoradiography. Corrosion. 1978;34:39–47. doi: 10.5006/0010-9312-34.2.39
- Hanada H, Otsuka T, Nakashima H, et al. Profiling of hydrogen accumulation in a tempered martensite microstructure by means of tritium autoradiography. Scr Mater. 2005;53:1279–1284. doi: 10.1016/j.scriptamat.2005.07.031
- Otsuka T, Tanabe T. Hydrogen diffusion and trapping process around MnS precipitates in αFe examined by tritium autoradiography. J Alloy Compd. 2007;446–447:655–659. doi: 10.1016/j.jallcom.2007.02.005
- Razzini G, Maffi S, Mussati G, et al. The scanning photoelectrochemical microscopy of diffusing hydrogen into metals. Corros Sci. 1995;37:1131–1141. doi: 10.1016/0010-938X(95)00020-K
- Razzini G, Cabrini M, Maffi S, et al. Photoelectrochemical visualization in real-time of hydrogen distribution in plastic regions of low-carbon steel. Corros Sci. 1999;41:203–208. doi: 10.1016/S0010-938X(98)00140-1
- Guedes FMF, Maffi S, Razzini G, et al. Scanning photoelectrochemical analysis of hydrogen permeation on ASTM A516 grade60 steel welded joints in a H2S containing solution. Corros Sci. 2003;45:2129–2142. doi: 10.1016/S0010-938X(03)00033-7
- Fushimi K, Lill KA, Habazaki H. Heterogeneous hydrogen evolution on corroding Fe–3 at.% Si surface observed by scanning electrochemical microscopy. Electrochim Acta. 2007;52:4246–4253. doi: 10.1016/j.electacta.2006.12.006
- Schaller RF, Thomas S, Birbilis N, et al. Spatially resolved mapping of the relative concentration of dissolved hydrogen using the scanning electrochemical microscope. Electrochem Commun. 2015;51:54–58. doi: 10.1016/j.elecom.2014.12.004
- Takai K, Seki J, Yamauchi G, et al. Observation of trapping sites of hydrogen and deuterium in high-strength steels by using secondary ion mass spectrometry, materials transactions. JIM. 1995;36:1134–1139.
- Awane T, Fukushima Y, Matsuo T, et al. Highly sensitive detection of net hydrogen charged into austenitic stainless steel with secondary ion mass spectrometry. Anal Chem. 2011;83:2667–2676. doi: 10.1021/ac103100b
- Tarzimoghadam Z, Rohwerder M, Merzlikin SV, et al. Multi-scale and spatially resolved hydrogen mapping in a Ni–Nb model alloy reveals the role of the δ phase in hydrogen embrittlement of alloy 718. Acta Mater. 2016;109:69–81. doi: 10.1016/j.actamat.2016.02.053
- Sobol O, Holzlechner G, Nolze G, et al. Time-of-Flight secondary Ion mass spectrometry (ToF-SIMS) imaging of deuterium assisted cracking in a 2205 duplex stainless steel micro-structure. Mater Sci Eng: A. 2016;676:271–277. doi: 10.1016/j.msea.2016.08.107
- Schober T, Dieker C. Observation of local hydrogen on nickel surfaces. Metall Trans A. 1983;14:2440–2442. doi: 10.1007/BF02663321
- Yao J, Cahoon JR. The use of silver decoration technique in the study of hydrogen transport in metallic materials. Metall T A. 1990;21:603–608. doi: 10.1007/BF02671932
- Sundararajan T, Akiyama E, Tsuzaki K. Hydrogen mapping across a crevice: effect of applied potential. Scr Mater. 2005;53:1219–1223. doi: 10.1016/j.scriptamat.2005.08.016
- Koyama M, Tasan CC, Nagashima T, et al. Hydrogen-assisted damage in austenite/martensite dual-phase steel. Philos Mag Lett. 2016;96:9–18. doi: 10.1080/09500839.2015.1130275
- Nagashima T, Koyama M, Bashir A, et al. Interfacial hydrogen localization in austenite/martensite dual-phase steel visualized through optimized silver decoration and scanning Kelvin probe force microscopy. Mater Corros. 2016.
- Luppo MI, Ovejero-Garcia J. The influence of microstructure on the trapping and diffusion of hydrogen in a low carbon steel. Corros Sci. 1991;32:1125–1136. doi: 10.1016/0010-938X(91)90097-9
- Ovejero-García J. Hydrogen microprint technique in the study of hydrogen in steels. J Mater Sci. 1985;20:2623–2629. DOI: 10.1007/BF00556094.
- Ronevich JA, Speer JG, Krauss G, et al. Improvement of the hydrogen microprint technique on AHSS steels. Metallogr Microst Anal. 2012;1:79–84. doi: 10.1007/s13632-012-0015-y
- Ichitani K, Kuramoto S, Kanno M. Quantitative evaluation of detection efficiency of the hydrogen microprint technique applied to steel. Corros Sci. 2003;45:1227–1241. doi: 10.1016/S0010-938X(02)00218-4
- Rohwerder M, Turcu F. High-resolution Kelvin probe microscopy in corrosion science: scanning Kelvin probe force microscopy (SKPFM) versus classical scanning Kelvin probe (SKP). Electrochim Acta. 2007;53:290–299. doi: 10.1016/j.electacta.2007.03.016
- Senöz C, Evers S, Stratmann M, et al. Scanning Kelvin probe as a highly sensitive tool for detecting hydrogen permeation with high local resolution. Electrochem Commun. 2011;13:1542–1545. doi: 10.1016/j.elecom.2011.10.014
- Evers S, Senöz C, Rohwerder M. Hydrogen detection in metals: a review and introduction of a Kelvin probe approach. Sci Technol Adv Mater. 2013;14:014201. doi: 10.1088/1468-6996/14/1/014201
- Koyama M, Bashir A, Rohwerder M, et al. Spatially and kinetically resolved mapping of hydrogen in a twinning-induced plasticity steel by use of scanning Kelvin probe force microscopy. J Electrochem Soc. 2015;162:C638–C647. doi: 10.1149/2.0131512jes
- Wang G, Yan Y, Yang X, et al. Investigation of hydrogen evolution and enrichment by scanning Kelvin probe force microscopy. Electrochem Commun. 2013;35:100–103. doi: 10.1016/j.elecom.2013.08.006
- Takahashi J, Kawakami K, Kobayashi Y, et al. The first direct observation of hydrogen trapping sites in TiC precipitation-hardening steel through atom probe tomography. Scr Mater. 2010;63:261–264. doi: 10.1016/j.scriptamat.2010.03.012
- Takahashi J, Kawakami K, Tarui T. Direct observation of hydrogen-trapping sites in vanadium carbide precipitation steel by atom probe tomography. Scr Mater. 2012;67:213–216. doi: 10.1016/j.scriptamat.2012.04.022
- Haley D, Merzlikin SV, Choi P, et al. Atom probe tomography observation of hydrogen in high-Mn steel and silver charged via an electrolytic route. Int J Hydrogen Energy. 2014;39:12221–12229. doi: 10.1016/j.ijhydene.2014.05.169
- Gemma R, Al-Kassab T, Kirchheim R, et al. Visualization of deuterium dead layer by atom probe tomography. Scr Mater. 2012;67:903–906. doi: 10.1016/j.scriptamat.2012.08.025
- Révay Z, Belgya T, Szentmiklósi L, et al. In situ determination of hydrogen inside a catalytic reactor using prompt γ activation analysis. Anal Chem. 2008;80:6066–6071. doi: 10.1021/ac800882k
- Reichart P, Dollinger G, Bergmaier A, et al. 3D hydrogen microscopy with sub-ppm detection limit. Nucl Instrum Methods B. 2004;219-220:980–987. doi: 10.1016/j.nimb.2004.01.200
- Peeper K, Moser M, Reichart P, et al. 3D-microscopy of hydrogen in tungsten. J Nucl Mater. 2013;438(Supplement):S887–S890. doi: 10.1016/j.jnucmat.2013.01.192
- Wagner S, Moser M, Greubel C, et al. Hydrogen microscopy – distribution of hydrogen in buckled niobium hydrogen thin films. Int J Hydrogen Energy. 2013;38:13822–13830. doi: 10.1016/j.ijhydene.2013.08.006
- Manke I, Markötter H, Tötzke C, et al. Investigation of energy-relevant materials with synchrotron X-rays and neutrons. Adv Eng Mater. 2011;13:712–729. doi: 10.1002/adem.201000284
- Kardjilov N, Manke I, Hilger A, et al. Neutron imaging in materials science. Mater Today. 2011;14:248–256. doi: 10.1016/S1369-7021(11)70139-0
- Beyer K, Kannengiesser T, Griesche A, et al. Neutron radiography study of hydrogen desorption in technical iron. J Mater Sci. 2011;46:5171–0. doi: 10.1007/s10853-011-5450-7
- Griesche A, Dabah E, Kannengiesser T, et al. Three-dimensional imaging of hydrogen blister in iron with neutron tomography. Acta Mater. 2014;78:14–22. doi: 10.1016/j.actamat.2014.06.034
- Griesche A, Dabah E, Kannengiesser T, et al. Measuring hydrogen distributions in iron and steel using neutrons. Phys Procedia. 2015;69:445–450. doi: 10.1016/j.phpro.2015.07.062
- Choo WY, Lee JY. Thermal analysis of trapped hydrogen in pure iron. Metall Trans A. 1982;13:135–140. doi: 10.1007/BF02642424
- Wei FG, Hara T, Tsuzaki K. Precise determination of the activation energy for desorption of hydrogen in two Ti-added steels by a single thermal-desorption spectrum. Metall Mater Trans B. 2004;35:587–597. doi: 10.1007/s11663-004-0057-x
- Koyama M, Springer H, Merzlikin SV, et al. Hydrogen embrittlement associated with strain localization in a precipitation-hardened Fe–Mn–Al–C light weight austenitic steel. Int J Hydrogen Energy. 2014;39:4634–4646. doi: 10.1016/j.ijhydene.2013.12.171
- Ryu JH, Kim SK, Lee CS, et al. Effect of aluminium on hydrogen-induced fracture behaviour in austenitic Fe–Mn–C steel. Proc R Soc A – Math Phys. 2013;469.
- Enos DG, Scully JR. A critical-strain criterion for hydrogen embrittlement of cold-drawn, ultrafine pearlitic steel. Metall Mater Trans A. 2002;33:1151–1166. doi: 10.1007/s11661-002-0217-z
- Takai K, Watanuki R. Hydrogen in trapping states innocuous to environmental degradation of high-strength steels. ISIJ Int. 2003;43:520–526. doi: 10.2355/isijinternational.43.520
- Wang M, Akiyama E, Tsuzaki K. Effect of hydrogen on the fracture behavior of high strength steel during slow strain rate test. Corros Sci. 2007;49:4081–4097. doi: 10.1016/j.corsci.2007.03.038
- Takagi S, Toji Y, Yoshino M, et al. Hydrogen embrittlement resistance evaluation of ultra high strength steel sheets for automobiles. ISIJ Int. 2012;52:316–322. doi: 10.2355/isijinternational.52.316
- Barnoush A, Vehoff H. Recent developments in the study of hydrogen embrittlement: hydrogen effect on dislocation nucleation. Acta Mater. 2010;58:5274–5285. doi: 10.1016/j.actamat.2010.05.057
- Yamabe J, Awane T, Matsuoka S. Elucidating the hydrogen-entry-obstruction mechanism of a newly developed aluminum-based coating in high-pressure gaseous hydrogen. Int J Hydrogen Energy. 2015;40:10329–10339. doi: 10.1016/j.ijhydene.2015.06.023
- Schaller RF, Scully JR. Spatial determination of diffusible hydrogen concentrations proximate to pits in a Fe–Cr–Ni–Mo steel using the scanning Kelvin probe. Electrochem Commun. 2016;63:5–9. doi: 10.1016/j.elecom.2015.12.002
- Doshida T, Takai K. Dependence of hydrogen-induced lattice defects and hydrogen embrittlement of cold-drawn pearlitic steels on hydrogen trap state, temperature, strain rate and hydrogen content. Acta Mater. 2014;79:93–107. doi: 10.1016/j.actamat.2014.07.008
- Sasaki D, Koyama M, Hamada S, et al. Tensile properties of precracked tempered martensitic steel specimens tested at ultralow strain rates in high-pressure hydrogen atmosphere. Philos Mag Lett. 2015;95:260–268. doi: 10.1080/09500839.2015.1049574
- Nagumo M, Nakamura M, Takai K. Hydrogen thermal desorption relevant to delayed-fracture susceptibility of high-strength steels. Metall Mater Trans A. 2001;32:339–347. doi: 10.1007/s11661-001-0265-9
- Wang M, Akiyama E, Tsuzaki K. Determination of the critical hydrogen concentration for delayed fracture of high strength steel by constant load test and numerical calculation. Corros Sci. 2006;48:2189–2202. doi: 10.1016/j.corsci.2005.07.010
- Kim JS, Lee YH, Lee DL, et al. Microstructural influences on hydrogen delayed fracture of high strength steels. Mater Sci Eng A. 2009;505:105–110. doi: 10.1016/j.msea.2008.11.040
- Koyama M, Akiyama E, Tsuzaki K. Hydrogen-induced delayed fracture of a Fe–22Mn–0.6 C steel pre-strained at different strain rates. Scr Mater. 2012;66:947–950. doi: 10.1016/j.scriptamat.2012.02.040
- Lufrano J, Sofronis P. Enhanced hydrogen concentrations ahead of rounded notches and cracks—competition between plastic strain and hydrostatic stress. Acta Mater. 1998;46:1519–1526. doi: 10.1016/S1359-6454(97)00364-9
- Wang M, Akiyama E, Tsuzaki K. Effect of hydrogen and stress concentration on the notch tensile strength of AISI 4135 steel. Mater Sci Eng A. 2005;398:37–46. doi: 10.1016/j.msea.2005.03.008
- Ayas C, Deshpande VS, Fleck NA. A fracture criterion for the notch strength of high strength steels in the presence of hydrogen. J Mech Phys Solids. 2014;63:80–93. doi: 10.1016/j.jmps.2013.10.002
- Wei FG, Tsuzaki K. Quantitative analysis on hydrogen trapping of TiC particles in steel. Metall Mater Trans A. 2006;37:331–353. doi: 10.1007/s11661-006-0004-3
- Abe N, Suzuki H, Takai K, et al. Identification of hydrogen trapping sites, binding energies, and occupation ratios at vacancies, dislocations and grain boundaries in iron of varying carbon content. Materials Science and Technology Conference and Exhibition 2011, MS and T'11; 2011. p. 1277–1284.
- Koyama M, Tsuzaki K. Ε→γ reverse transformation-induced hydrogen desorption and Mn effect on hydrogen uptake in Fe–Mn binary alloys. ISIJ Int. 2015;55:2269–2271. doi: 10.2355/isijinternational.ISIJINT-2015-215
- Magee CW, Botnick EM. Hydrogen depth profiling using SIMS—problems and their solutions. J Vac Sci Technol. 1981;19:47–52. doi: 10.1116/1.571015
- Nishimoto A, Koyama M, Yamato S, et al. Detection of charged hydrogen in ferritic steel through cryogenic secondary ion mass spectrometry. ISIJ Int. 2015;55:335–337. doi: 10.2355/isijinternational.55.335
- Yamabe J, Matsuoka S, Murakami Y. Surface coating with a high resistance to hydrogen entry under high-pressure hydrogen-gas environment. Int J Hydrogen Energy. 2013;38:10141–10154. doi: 10.1016/j.ijhydene.2013.05.152
- Evers S, Rohwerder M. The hydrogen electrode in the “dry”: A Kelvin probe approach to measuring hydrogen in metals. Electrochem Commun. 2012;24:85–88. doi: 10.1016/j.elecom.2012.08.019
- Evers S, Senöz C, Rohwerder M. Spatially resolved high sensitive measurement of hydrogen permeation by scanning Kelvin probe microscopy. Electrochim Acta. 2013;110:534–538. doi: 10.1016/j.electacta.2013.04.171
- Gault B, Moody MP, Cairney JM, et al. Atom probe microscopy. Springer Science & Business Media; 2012.
- Hono K, Raabe D, Ringer SP, et al. Atom probe tomography of metallic nanostructures. MRS Bull. 2016;41:23–29. doi: 10.1557/mrs.2015.314
- Marquis E, Choi PP, Danoix F, et al. New insights into the atomic-scale structures and behavior of steels. Microsc Today. 2012;20:44–48. doi: 10.1017/S1551929512000387
- Gault B, Loi ST, Araullo-Peters VJ, et al. Dynamic reconstruction for atom probe tomography. Ultramicroscopy. 2011;111:1619–1624. doi: 10.1016/j.ultramic.2011.08.005
- Asahi H, Hirakami D, Yamasaki S. Hydrogen trapping behavior in vanadium-added steel. ISIJ Int. 2003;43:527–533. doi: 10.2355/isijinternational.43.527
- Koyama M, Yamasaki D, Nagashima T, et al. In situ observations of silver-decoration evolution under hydrogen permeation: effects of grain boundary misorientation on hydrogen flux in pure iron. Scr Mater. 2017;129:48–51. doi: 10.1016/j.scriptamat.2016.10.027
- Nagao A, Kuramoto S, Ichitani K, et al. Visualization of hydrogen transport in high strength steels affected by stress fields and hydrogen trapping. Scr Mater. 2001;45:1227–1232. doi: 10.1016/S1359-6462(01)01154-X
- Momotani Y, Shibata A, Terada D, et al. Hydrogen embrittlement behavior at different strain rates in low-carbon martensitic steel. Mater Today: Proc. 2015;2:S735–S738. doi: 10.1016/j.matpr.2015.07.387
- Morito S, Tanaka H, Konishi R, et al. The morphology and crystallography of lath martensite in Fe-C alloys. Acta Mater. 2003;51:1789–1799. doi: 10.1016/S1359-6454(02)00577-3
- Morsdorf L, Tasan CC, Ponge D, et al. 3D structural and atomic-scale analysis of lath martensite: effect of the transformation sequence. Acta Mater. 2015;95:366–377. doi: 10.1016/j.actamat.2015.05.023
- Koyama M, Abe Y, Saito K, et al. Martensitic transformation-induced hydrogen desorption characterized by utilizing cryogenic thermal desorption spectroscopy during cooling. Scr Mater. 2016;122:50–53. doi: 10.1016/j.scriptamat.2016.05.012