
ABSTRACT
Pupil Premium funding has been provided to schools in England since 2011, to reduce socio-economic segregation, and the attainment gap between disadvantaged pupils and their peers. There is little evidence it works. Some stakeholders are now considering whether funding should cease, or have a new objective. Evaluating the impact of such a funding policy is not easy because the relevant outcomes are sensitive to demographic, economic and other concurrent policy changes. These issues are addressed using the National Pupil Database, comparing the poverty gap in primary schools from 2006 to 2019, focusing on pupils who would have attracted Pupil Premium funding, if it existed, in any year and under any economic conditions. After 2010, the segregation of long-term disadvantaged pupils and their peers reduced in Years 1 and 6, and their attainment improved relative to their peers at a ges 7 and 11. However, assessments changed after 2014 and this complicates the pattern. A regression model suggests that relative attainment for poor pupils improved markedly in the Pupil Premium era, even in regions like the North of England which have faced criticism for apparently “failing“ their poor pupils. We argue for retaining the Pupil Premium policy.
Introduction
In 2011, Pupil Premium funding was introduced in England. The funding was given to all state-funded schools in proportion to their intake of disadvantaged pupils, with disadvantage largely defined in terms of eligibility for free school meals (FSM). The money is intended to provide assistance and interventions to improve the attainment of poorer pupils, and so reduce the poverty attainment gap. Nine years later, this paper provides strong evidence of the likely impact of this funding on the socio-economic segregation of poorer pupils between schools, and on the attainment gap. Previous attempts to assess these impacts have been problematic in various ways (Gorard, Siddiqui, and See Citation2019). Here these problems are addressed by incorporating changes in economic indicators over time, using data from well before 2011 up to 2019, and most notably by focusing on long-term disadvantaged pupils who would presumably have attracted Pupil Premium in any era (were it available), and under any economic or policy circumstances.
The paper looks briefly at some of the international evidence on targeted funding intended to improve educational outcomes, and how this is best delivered. It then summarises the Pupil Premium policy in England, the prior attempts to assess its impact, and the various limitations of these. The paper describes the methods used, presents the results, and considers some implications for policy from our new large-scale study.
What is the prior evidence on this approach?
Although the focus of this paper is on poverty, financial poverty is not the only kind of educational disadvantage (Craske Citation2018). And, as this paper shows, poverty is often linked to other indicators of possible disadvantage such as having a special educational need. However, using money to try and improve attainment for poorer pupils is a widespread policy that has been used by governments and other agencies for decades (Children’s World Report Citation2020), where poverty is assumed to be a barrier to the attainment of academic objectives (Rolle, Houck, and McColl Citation2008). There are many variations, with money given to the school system to deploy, or to areas with high levels of disadvantage, to families either for them to deploy or as an incentive (so that parents encourage school attendance, (for example), to teachers, or to the disadvantaged students themselves as an incentive (Toutkoushian and Michael Citation2007).
There is little robust evidence on which, if any, of these approaches is more effective. Large experimental studies suggest that simply paying students to improve does not improve their intrinsic motivation, and does not lead to improved attainment, largely because students say that they do not know how to improve (Fryer Citation2010). Paying students to improve the inputs into education production, such as for attendance or classroom behaviour where students know what to do, might be more effective. In a large experimental study where students were paid for academic achievement in five core subjects, there was only a benefit in maths, not for reading or other subjects (Bettinger Citation2010).
So far, the evidence on paying students directly is not strong, but it might be a better approach than providing the money to teachers. In a large experiment looking at attainment in maths, there was improvement in a treatment group wherein students were paid if they increased their scores, and in a group wherein students, teachers, and school leaders received the incentive, compared to a control group. There was little or no improvement for a group wherein only teachers were paid extra if students improved (Behrman et al. Citation2015). Channelling extra funding to attract and retain teachers in disadvantaged areas and schools has also not been found to be very effective (Clotfelter, Ladd, and Vigdor Citation2005; Feng Citation2014). It generally does not make any difference once the funding ceases (See et al. Citation2020).
What about paying families/parents? Lack of parental engagement in children’s learning and school life is not a major causal factor in equalising the academic outcomes of disadvantaged children. Funding programmes to support parental involvement of disadvantaged children have not shown very promising effects for attainment outcomes (Gorard and See Citation2013). Some evidence comes from Riccio et al. (Citation2010), where low-income families were offered cash rewards for engaging in activities related to children’s education (among a range of other things such as health and employment). There were more than 50 outcomes measures, making the claims for the success for any one outcome very weak. There appeared to be a small benefit for maths scores for one year, and some improvements in attendance.
A large quasi-experiment, with standardised outcome measures, suggested that providing extra resources for the schools themselves led to greater gains than incentives for teachers did (Lavy Citation2002), even though other trials suggest that simply giving extra money to schools has no direct impact on test scores (Mbiti et al. Citation2019). The Pupil Premium is perhaps more like the additional funding that schools in England already received for individual pupils with statements of special educational needs or disability. The evidence on the impact of such funding for pupils facing challenges is mixed but reasonably promising overall (Henry, Fortner, and Thompson Citation2010; Holmlund, McNally, and Viarengo Citation2010). Both PP and SEN funds are intended to assist those pupils facing long-term challenges in accessing the curriculum. However, while SEN funding is largely tied to individual and their identified needs, Pupil Premium funding does not have to be spent on the individual who attracted it.
What is the Pupil Premium intended to achieve?
From April 2011, ‘additional’ Pupil Premium (PP) funding was allocated to publicly-funded schools in England in proportion to their intake of pupils from low-income families known to be eligible for free school meals (FSM), and children who had been looked after by the state continuously for more than six months (Education and Skills Funding Agency Citation2018). There is a smaller premium for pupils having parents in the armed forces, or whose parent(s) had died while in the armed forces (Foster and Long Citation2018). By 2018, PP was funded at £2,300 per looked-after pupil, and £1,320 per pupil ever FSM-eligible at primary school, with schools receiving an average of around £150k per annum.
On average, socio-economically less advantaged students have lower attainment outcomes at school, and poorer opportunities once they have left school (Lessof et al. Citation2018; Gorard and Siddiqui Citation2019; Hanushek et al. Citation2019). Schools are required to use PP funding to support low-income and other target pupils, but they can choose how to do this. Most is spent on interventions to help improve the attainment of low attaining disadvantaged students (Fellows and Barton Citation2018). The reduction of the achievement gap between children coming from richer and poorer families was a key purpose of PP funding (Gov.uk Citation2010), and schools are increasingly judged in terms of their results for Pupil Premium pupils (DfE Citation2019).
Having poorer children clustered in particular schools is potentially damaging in a variety of ways – such as lowering aspiration and participation for individuals, and reducing social and ethnic cohesion (Danhier Citation2018; Hewstone et al. Citation2018; Bhattacharya Citation2021). It is often more damaging for lower-attaining and more disadvantaged pupils (Dickerson, Maragkou, and McIntosh Citation2018). So, another objective of the funding from the outset was to reduce social and economic segregation between school intakes. The funding was devised to ‘act as an incentive for schools to stop cream-skimming children from wealthier areas as they will lose out financially’ (Freedman and Horner Citation2008, 41), and was introduced to help reduce ‘any disincentive that schools might have to recruit such pupils’ (Gov.uk Citation2010).
Reducing the poverty attainment gap and lowering social segregation between schools are the two objectives assessed in this paper.
The prior evidence on Pupil Premium impact
There have been no robust prior studies of the impact of Pupil Premium funding on SES segregation between schools, although Gorard, Siddiqui, and See (Citation2019) present a time series analysis from 1989 to 2018, which suggested an unexpected decline in between school segregation during the Pupil Premium era. But that analysis used only school-level data, and disadvantage was defined as eligibility for FSM in one year, which is unstable and so not really comparable over time. As shown in that study, the proportion of FSM-eligible pupils clearly changed annually with the economic conditions, and this created a confound for the analysis. The proportion of pupils registered as FSM-eligible changed historically from nearly 20% of the school population to just above 11%. When there are more FSM-eligible pupils both segregation and the attainment gap appear to decline in a way that has nothing to do with improved attainment or reduced clustering of the poorest pupils.
Work on the raw-score attainment gap suggests that it has been declining to some extent since 2011, but perhaps no more than it declined before 2011 in some accounts. According to the Education Policy Institute (Citation2017), the gap has been reducing very slowly and erratically since at least 2007, with no clear difference before and after 2011 The Social Mobility Commission (Citation2019) also report that the gap has been falling slowly, but again not necessarily more so since 2011. As with analyses conducted by the DfE, Ofsted, EEF, Demos, and the National Audit Office among others, prior studies have several problems. Some only look at data since 2011 which cannot portray a change since the policy was introduced. For example, DfE (Citation2018c) used a version of the attainment gap that had not been used before 2011, and so any changes they portray cannot be attributed to a policy change in 2011 (there is no counterfactual). Prior studies generally take no account of changes over time in the economy, the legal definitions of indicators of disadvantage, the impact of the incentive to register pupils as FSM-eligible because of the Pupil Premium, or the amount of missing data, and so the prevalence of disadvantage. Analyses are complicated by changes in the metrics used, the curriculum, and in the way attainment has been assessed and scored (see below).
Worse, the length and depth of any indicator of disadvantage is usually ignored and, because such factors are clearly related to attainment and progress (Gorard Citation2018), previous estimates of the attainment gap at any level of aggregation are problematic (e.g. Exley Citation2015; National Audit Office Citation2015; Public Accounts Committee Citation2015; Education Endowment Foundation Citation2017,; DfE Citation2018b). Average attainment is lower for long-term FSM-eligible pupils, and this means that simply computing an attainment gap between Ever- and never-FSM pupils will seriously misrepresent the challenges faced by poorer areas and schools with poorer intakes, and the chances of their pupils making good progress. The problems cannot be avoided by using value-added or Progress 8 scores. Despite value-added being intended to be independent of the underlying raw-scores, it is not (nor is it stable, Gorard Citation2018). The same flaw creates a situation where the only group that has average positive value-added progress in England consists of those pupils who are never eligible for FSM. All groups of pupils ever eligible for FSM for any amount of time have negative progress scores, and these scores are substantially lower for every year that a pupil is known to be eligible. There is no obvious reason why progress scores (as opposed to absolute attainment) should behave like this. The longest term disadvantaged pupils have very low progress scores indeed, and therefore years, areas or schools with proportionately more of this group will appear to have lower progress and higher attainment gaps as well.
Another factor that is ignored in previous presentations of the attainment gap at any level of aggregation over time is the proportion of pupils in any area or year not in state-maintained schools. If the pupils attending private provision are not included in the attainment gap calculation, because it is not clear whether they are FSM-eligible or not, this may distort the result.
A substantial part of the apparent change in the official attainment gap in any year, area or school is therefore linked to factors such as changes in private school attendance, the economy, and the duration of poverty (none of which are strictly anything to do with attainment levels, but which become confounding variables unless accounted for). For a fuller discussion and evidence on these difficult issues see Gorard, Siddiqui, and See (Citation2019).
What we need is a definition of disadvantage that can be used for analysis of cohorts long before and long after 2011, and a dataset that contains common variables and measures available over all of that time. Under current conditions it is not possible to use actual measures of household income (HMRC have repeatedly refused access). We need to identify pupils who would have been eligible for Pupil Premium funding in any era, even when there was no funding, and under any legal, economic, or other conditions (see methods section).
A recent study by Hutchinson, Reader, and Akhal (Citation2020) took our advice, and looked at outcomes for what they called the ‘persistently disadvantaged’ pupils. They compared results for these long-term FSM-eligible pupils with the results of pupils who had never been eligible (excluding from analysis those who had ever been eligible in the past six years, but not persistently so). This is an advance on prior work, but it still has the problem of sensitivity to legal, economic and other changes over time that are nothing to do with schools, teachers, or attainment. As we have shown previously (and again below), the temporarily disadvantaged students are more like the never disadvantaged than like the long-term disadvantaged. Changes in the economy may be more likely to affect them, for example, and so some years will include pupils as never disadvantaged who might have been temporarily so during a recession. It is safer always to compare the stable disadvantaged group (however defined) with the equally stable group of all of the remaining pupils in any cohort (and not have an excluded middle group).
In the same way, Hutchinson, Reader, and Akhal (Citation2020) excluded non-standard schools like Pupil Referral Units (PRUs) from their figures, even though PRUs are part of the Pupil Premium scheme, and numbers in PRUs can also change over time according to policy, practice and prevalence. This affects the apparent attainment gap because potential PRU students tend to have lower average attainment, and are more likely to be disadvantaged. In years when more are in mainstream settings their scores will increase the estimated gap. This issue is of less relevance for primary schools perhaps, but the same kind of thing happens over time with intakes to specials schools, hospitals, and private schools.
National assessments in primary schools
Key Stage 1 (KS1, attainment at age 7) and KS2 (attainment at age 11) outcomes at primary school in England were reported using a standard scale until 2016. This was based on levels 1 to 8, with 2 being the expected level at age 7 KS1, and 4 the expected level at age 11 KS2. Each level was sub-divided into categories a, b and c and each category was given a notional point score, with level 1 c being 7, level 1b is 9, 1 c 11, 2 c 13 and so on.
Since 2005, KS1 levels have been based more on teacher assessment and KS2 levels on statutory tests. In 2016, levels were replaced at KS1 with descriptor categories assessed by teachers for reading, writing and maths (which can be mapped onto the old point scores) and scaled scores from 85 to 115 from tests (with 100 being the expected standard). Pupils who do not achieve the lowest scaled score on the test would be assessed by the teacher using one of the new categories for pre-KS1 standards. Teacher assessment in English was revised for 2018, with new criteria for tasks that pupils have shown that they can do. Teacher assessments for all subjects were revised for 2019. For these reasons, the analysis below presents KS1 scores (not levels) as standardised z-scores, to assist comparisons over time.
There was a widespread boycott of KS2 tests in 2010, and many results are missing nationally. For these reasons, the attainment scores for 2010 should be largely disregarded in what follows, otherwise they may make results after 2010 look misleadingly better. The KS2 curriculum changed in 2014, and the relevant cohort faced new tests in 2016 (DfE Citation2016). In 2016, KS2 students were assessed using scaled scores matched against a new curriculum. These scores range from 80, the lowest possible scaled score, to 120, the highest possible scaled score. A scaled score of 100 or more means that the child has met the expected standard in each KS2 SATs test; a scaled score of 99 or less means they have not reached the expected standard. As with KS1 we present the key results below in terms of z-scores in an attempt to even out these changes in metrics, to some extent.
Methods
The problems outlined above with the existing evidence base means that we need a new and stronger analysis focusing on whether Pupil Premium has made a difference. Here the analyses are based on the idea in Gorard, Siddiqui, and See (Citation2019) of using the most stably disadvantaged group who presumably would have been labelled disadvantaged in any year and under any conditions – the long term FSM-eligible. This group is compared to all of the other pupils in the cohort, including those who had been only temporarily FSM-eligible. In the absence of an RCT or similar, this is perhaps the strongest way to test impact. For comparison we have also run all analyses with disadvantage defined as FSM-eligible in the year of the outcome measure (e.g. Year 6 for KS2), and as ever FSM-eligible (in the six years at primary school). But these analyses are not generally presented in this paper.
The datasets
The data comes from the combined National Pupil Database (NPD) and Census datasets, held by DfE and accessed via ONS, for the Key Stage 2 (KS2) cohorts for school years 2005/6 to 2018/19, with indicators from the previous KS1. All pupils in state-maintained schools at KS2 are included (regardless of school type, including PRUs and special schools), but only those in the correct age band for that school year. And only variables that appear for all year cohorts can be used. For example, in later NPD versions there are variables for pupils living in state care, and those whose parents are in the armed forces. Such information could be used to help define Pupil Premium status more accurately, even though the vast majority of eligibility is based on FSM. However, this cannot be done for earlier cohorts, and to use it for only some cohorts would appear to change the outcomes of the disadvantaged group in a way that was unrelated to Pupil Premium Policy or schools or teaching.
The 2006 primary cohort is the earliest we can use with reasonably complete information about their prior KS1 characteristics and outcomes. Even so, this cohort has incomplete information about their FSM status in the first year. We could ignore this year, and start with 2007. However, given that the 2010 attainment data is affected by the boycott, this would give us only three clear cohorts before 2011 (2007–2009). So, the analysis is from 2006 to 2019, and the headline figures are based on those pupils known to be eligible for at least five years (out of six) while at primary school. All analysis have been run with six years (and not 2006) as well. The results are substantively the same.
New indicators
A new indicator was created registering how many years each pupil had been FSM-eligible for, at each Key Stage, as an indication of that stable subset of pupils living in long-term poverty. Other new indicators were the percentage of all pupils known to be FSM-eligible, and the number missing data on FSM, for each year and KS.
All KS1 and KS2 (average English and maths) points scores were converted to z-scores. Results are presented for both the raw- and standardised z-scores. A simple progress measure was created by regressing individual prior attainment score (KS1 points) on later attainment score (KS2 points). All models predicted later attainment with R of around 0.7 to around 0.8. The residual score (difference between predicted and observed KS2 scores) was saved as a new indicator for each pupil.
A measure of segregation was created for each individual, showing how clustered (or otherwise) their school was in terms of pupil intake known to be eligible for FSM. This segregation residual was computed as the number of FSM-eligible pupils in an individual’s school divided by the number of FSM pupils in the dataset (all maintained schools in England). From this we subtracted the number of all pupils in the schools divided by the number of pupils in all schools (Gorard Citation2015).
From outside the NPD, we added data for each year on GDP and GDP annual growth, as an indicator of economic change over time, and on annual private school attendance from DfE (Citation2020). We also grouped cases into nine official Economic Areas.
Analysis
All 14 datasets for KS2 cohorts were aggregated into one, retaining only those attainment, school, area and background variables common to all. There were 7,956,233 cases. The first step in the analysis was to produce descriptive figures. Pupils missing data on one or more key variables had a new category added for ‘missing’ or, where the variable is a real number, a new flag variable created to mark whether that number is missing or not (and mean score used to replace the missing value). This retains all cases successfully so that all analyses use the same N, while respecting missing data and permitting it to be assessed accurately in the context of each finding (Gorard Citation2020).
Background characteristics such as sex, age-in-year, language, ethnicity, and special educational need status were cross-tabulated with disadvantaged and non-disadvantaged groups, defined in terms of long term FSM-eligibility or not, current FSM-eligibility or not, and ever FSM-eligible or not.
The same disadvantaged categories were used to compare means for attainment, value-added residuals and segregation residuals, and so create ‘effect’ sizes computed as the difference between the means for any disadvantaged group and the rest, divided by their overall standard deviation. To aid comparison, all effect sizes are presented in line graphs as positive (absolute) values. This becomes clearer when explained in the text. Strictly, line graphs are not the most appropriate for 14 years of data points, but they are more readable. Readers just have to remember that the graphs are based on 14 points and are not continuously measured. The underlying exact figures, with their signs, appear in the Appendix. Times series graphs are presented for GDP change over time, the percentage of long-term FSM-eligible pupils, and the percentage in private schools and so excluded from NPD and the official attainment gaps. These are used as context for changes in segregation and the attainment gap.
A simple multiple regression model is also presented, predicting/explaining the attainment gap for each year at KS2. It has two steps. The first step has three predictors to represent economic and related changes – GDP change, percentage of long-term FSM-eligible pupils, and percentage in private schools. The second step uses a flag variable set to 0 if the year is before 2011, and 1 otherwise.
Findings
All KS2 cohorts, 2006 to 2019 combined
Using the overall dataset for years 2006 to 2019, with around 8 million cases, it is clear that the few pupils missing FSM data have attainment more like the majority not-disadvantaged pupils at KS1, and more like the disadvantaged pupils at KS2 (). In fact, their KS2 scores are worse than the disadvantaged groups, forming a kind of super-disadvantaged group, as shown previously at KS4 (Gorard Citation2012). Given that the dataset is based on KS2 cohorts, the missing values at KS1 are most likely for those pupils coming to primary schools in England later, after Year 1, from other home countries, overseas, private schools, or home tutoring. Those missing FSM data at KS2 (but having KS2 scores) may be more mobile pupils such as recent evacuees or from Traveller families.
Table 1. Comparing KS1 and KS2 scores for pupils missing FSM data with the rest.
shows that for each outcome measure there is a worsening trend linked to longer-term disadvantage. The gap between never FSM-eligible pupils and the rest is large, with only the never-eligible group having a positive value-added score for KS2 (i.e. all of the other pupil groups make differentially negative average progress at primary school). Similarly, and not surprisingly, only the never-eligible pupil group generally attend schools with fewer than their fair share of disadvantaged pupils (segregation). However, what has not been so clear until recently is that the picture worsens in all aspects for longer-term disadvantaged pupils. In fact, the gap between pupils only FSM-eligible for one year and those always eligible is usually larger than that between pupils only FSM-eligible for one year and those never eligible. Again this shows why using current FSM status or EverFSM6, as happens in official analyses and even much academic research, does not provide a fair picture of the situation.
Table 2. KS scores, value-added, and segregation linked to length of known disadvantage.
There is a clear difference in the extent to which long-term FSM-eligible pupils (eligible for every year while at primary school) have historically been segregated from their peers (effect size 0.97), and in their attainment at KS1 (effect size of 0.59). There is also a small difference at KS2 both in raw-score and value-added terms (). These attainment differences are smaller than some readers might expect because those pupils FSM-eligible for only five years are included here in the (technically) not long-term disadvantaged group, as are those only eligible for four years and so on. These issues are examined further below.
Table 3. Comparing KS scores, value-added, and segregation between long-term disadvantaged pupils and the rest.
Long-term FSM-eligible pupils are slightly more likely to be non-white (especially black or mixed) in ethnic origin, and/or to have a first language other than English. Long-term FSM-eligible pupils are over twice as likely to be recorded as having a special educational need (SEN) or disability of some kind (). This factor alone could account for a large part of the difference in attainment at KS1 and KS2, and in the attainment gap otherwise apparently related to poverty.
Table 4. Percentage of pupils listed as having SEN, for disadvantaged groups and the rest.
Identifying the comparison group over time
illustrates why, for the purposes of assessing the impact of Pupil Premium funding, the basis for comparison should be the long-term or permanently disadvantaged (the lower line in the graph). They are much less affected by changes in legal definitions of FSM-eligibility and variations in economic conditions, than the temporarily disadvantaged group. The proportion is relatively stable, and we can assume that the vast majority would have been labelled FSM-eligible in any era.
Figure 1. Percentage of long-term and temporary FSM-eligible pupils, by KS2, 2006–2019.
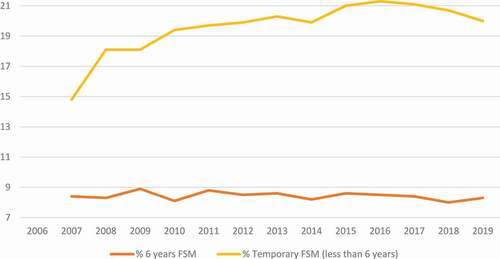
Precise figures appear in the Appendix,
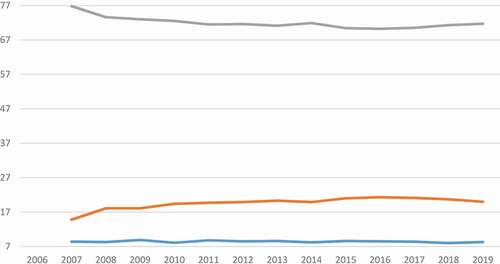
The group representing pupils who had been FSM-eligible for one or more years but not permanently (the top line in ) is much more volatile over time, ranging from under 15% to over 21% of the total. repeats at a different scale, and includes the majority of pupils each year who are never FSM-eligible. Because the long-term FSM-eligible group is so stable, the never eligible group is largely the inverse in shape of the temporarily eligible group. Both are volatile. Comparing the long-term and stable eligible group with either of the others would still lead to results influenced by the prevailing economic and legal conditions. It is not a solution, as Hutchinson et al. (Citation2020) did, to use the never eligible group. However, combining all except the long-term eligible creates a second ‘flat’ group (the changes in the top two lines largely cancel out). This is what is done in this paper.
Figure 2. Percentage of long-term, temporary and never FSM-eligible pupils, KS2, 2006–2019.
Annual changes for KS1 cohorts 2006 to 2019
Looking at pupils known to be eligible for FSM in their first year at primary school, it is clear that the clustering of FSM-eligible pupils within specific schools (socio-economic segregation) was flat from 2006 to 2011, but has declined since 2011 (). There is a strong possibility that this welcome decline in socio-economic segregation between schools is linked to change in the ‘attractiveness’ of disadvantaged pupils when allocating schools places, as planned when Pupil Premium funding was introduced, and as already identified based on a school-level analysis at KS4 (Gorard, Siddiqui, and See Citation2019). The imapct of the funding incentive on Year 1 school places could be immediate. It has been noted before that when a change of policy is linked to changes in segregation, the biggest changes occur while each school is filling up with pupils arriving since the change in policy (Gorard Citation2015). Perhaps something similar is happening here. By 2017, a full six cohorts had arrived in their schools during the Pupil Premium era, and graph shows signs of flattening out.
Figure 3. Change in ‘effect’ size for the gap between FSM-eligible pupils and the rest, FSM Segregation Year 1.
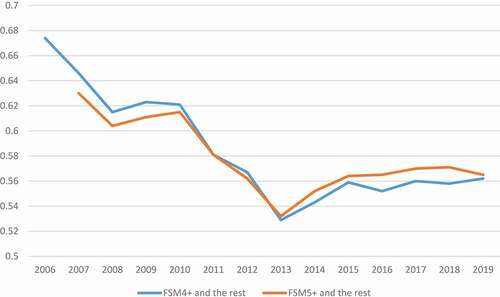
. suggests that the difference in attainment between long-term FSM-eligible pupils and the rest has also declined in the Pupil Premium era. Importantly, this improvement in equity occurred at the same time as an improvement in raw KS1 scores for both groups (see in the Appendix). The figures show a period of volatility from 2006, with no overall pattern until 2011, and then a decrease in the poverty attainment gap for the years following. There was a widespread boycott of KS assessments in 2010, and so the results (a sudden apparent growth in the gap) for this year may not be directly comparable. The changes in assessment from 2015 (see above) may have led to a temporary increase in the gap. By 2019, the gap is at a historic low.
Figure 4. Change in ‘effect’ size for the gap between long-term disadvantaged pupils and the rest, KS1 Points z-scores, 2006–2019.
As would be expected, the gap is lower at every stage between pupils who are EverFSM6 and the rest, then between those FSM-eligible in one year and the rest. The gaps are largest for the long-term disadvantaged, who would presumably have attracted Pupil Premium funding in any era, whatever the conditions in place. Looking at this most disadvantaged group, it is clear not only that their attainment has improved, but also that they are slowly catching up with those pupils who have only been temporarily FSM-eligible and with the pupils never eligible. For KS1 cohorts, it looks as though the Pupil Premium funding era is linked to success in meeting two of its objectives – reduced segregation of school intakes, and a lower poverty attainment gap.
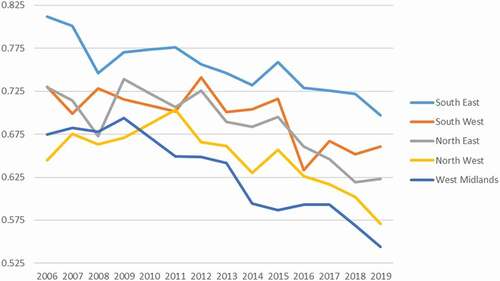
In order to help illustrate these changes, shows the ‘effect’ sizes for the attainment gap between long-term FSM-eligible pupils and the rest, for five Economic Regions of England over time. There is a decline in all areas since 2011. The gap has declined particularly strongly in the North West and West Midlands (and London; the figures for all regions are in Appendix ). These areas are important to note because they have been criticised for overly large poverty gaps, and for, in effect, failing their poor pupils. In fact, it is areas like the South East and South West that have the highest gaps and lowest average attainment for the pupils facing long-term poverty.
Figure 5. Change in ‘effect’ size for the gap between disadvantaged pupils and the rest, KS1 Points z-scores, by Economic Region, 2006–2019.
Annual changes for KS2 cohorts 2006 to 2019
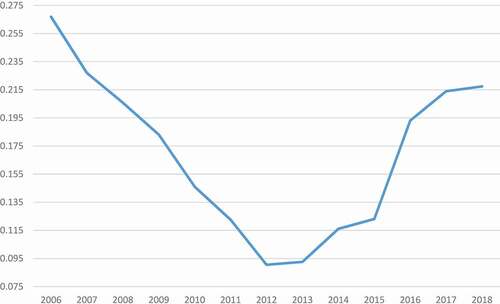
As with pupil intakes in Year 1, socio-economic segregation between primary schools in Year 6 (end of KS2) has declined since 2011, having been flattish since 2006 (). By 2019, the extent to which long-term FSM-eligible pupils are clustered in schools with others like them is at a historic low. This is good news, uniquely associated with the PP era.
Figure 6. Change in ‘effect’ size for the gap between long-term disadvantaged pupils and the rest, FSM Segregation KS2.
The picture for the attainment gap at KS2 is not as clear as for segregation, or for the attainment gap at KS1 (). The attainment gap in 2019 is substantially lower than in 2006, and indeed much lower than in 2010. However, the gap grew in 2014, and then again from 2016 with the changes in KS2 assessment and scoring, and there is no clear ongoing trend of improvement since the introduction of Pupil Premium funding. More research is needed to try and take account of these abrupt changes in assessment, which have not been picked up by prior analysis using the official definition of disadvantage (see above). It is noteworthy that the former permanent secretary at the DfE said that ‘after 2015, the focus on the attainment gap … diminished’. The Conservative government was more focussed on academies, and felt that narrowing the attainment gap was ‘more the contribution of the Lib Dems’ who had formed part of the coalition government in 2010 (Whittaker Citation2021).
Figure 7. Change in ‘effect’ size for the gap between disadvantaged pupils and the rest, KS2 Points.
is based on the approach used by DfE (Citation2014), and subsequently, to overcome abrupt changes (see above) by comparing the average ranking of attainment for disadvantaged pupils and the rest. Their argument is that giving each pupil a national ranked score on any assessment, rather than a points score, makes different assessments and grading systems more comparable over time. shows that this approach does not overcome the change in difficulty in 2014. So it is still not clear what is happening here in relation to Pupil Premium funding.
Figure 8. Change in ranking gap, KS2 Points.
At KS2 it is also possible to consider the progress made by disadvantaged groups between KS1 and KS2. shows the gap in simple value-added residuals between long-term disadvantaged pupils and the rest. The gap was declining until 2013. The changes to assessment in 2014 and again in 2016 are associated with a reversal of this historic trend. Now, the most disadvantaged groups face an increasing attainment gap, with long-term FSM-eligible pupils making less and less relative progress at primary schools. This can explain some of the pattern in . Insofar as value-added scores are meaningful, they suggest that the reforms to scoring for KS2 have disproportionately affected long-term disadvantaged pupils, and undone much of the progress in reducing the attainment gap since 2006. Two policies appear to be working against each other here. By their nature, measured as progress between one KS and the next, these KS2 VA scores may be worsened by the very improvement noted for KS1 in .
Figure 9. Change in ‘effect’ size for the gap between disadvantaged pupils and the rest, KS2 VA Residual.
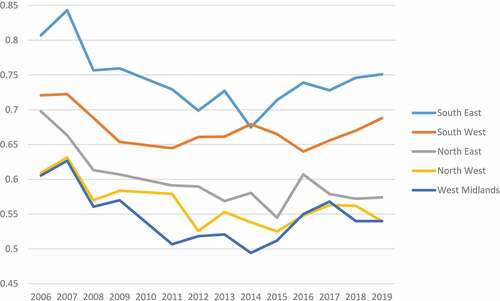
The attainment gap at KS2 is again substantially lower in the North and the West Midlands, and has decreased further since 2010, despite the change in national scoring and value-added since 2014 (). The decrease has been most marked in the North East. These are all notable findings, because these are the areas that policy-makers and other commentators has criticised for having high attainment gaps. As with KS1 it is areas like the South East and South West that have among the highest gaps for long-term disadvantaged pupils, and have shown the least improvement over time.
Figure 10. Change in ‘effect’ size for the gap between disadvantaged pupils and the rest, KS2 Points z-scores, Economic Regions 2006–2019.
The economy
There are reasons, other than Pupil Premium funding and changes in test severity, why the poverty attainment gap may change over time. One of these is changes in the economy. When the economy is weaker there are more FSM-eligible pupils. Length of poverty is linked to lower average attainment, and so these newly eligible pupils will have higher overall attainment. And so the apparent FSM versus non-FSM gap may reduce. Also, in better economic times more students may attend private schools (largely excluded from NPD and official measures of the gap), which could have the same effect by taking somewhat higher attaining scores out of the calculation (Gorard, Siddiqui, and See Citation2019). This is a key reason why the emphasis in this paper is on the long-term FSM-eligible who would have been disadvantaged and not attending private schools in any era under almost any economic circumstances.
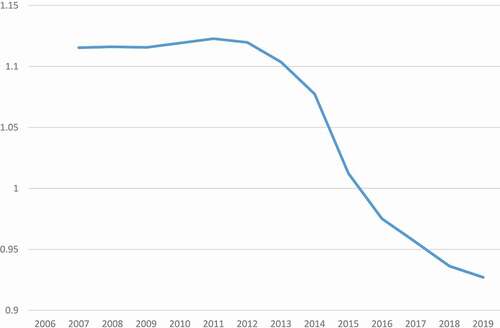
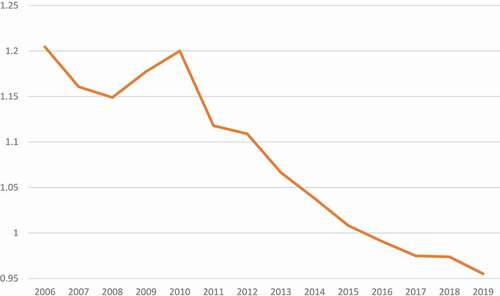
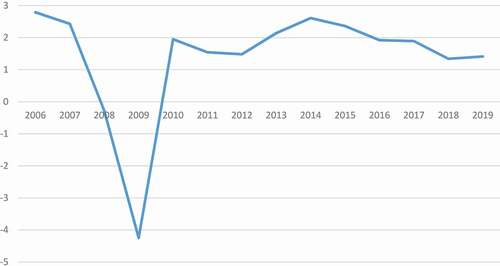
However, there is no clear link between either the attainment and segregation gaps, and changes in GDP 2006–2019 (). All of the economic indicators used here have been converted to z-scores for comparability. For segregation (above), there are indications from 2006 to 2013 that it is partly the inverse of GDP, rising when GPD declines and vice versa. However, from 2013 onwards segregation continues to fall while GDP improves slightly. This suggests that another, non-economic, factor like PP is the cause. There is also no clear link between GDP change and the percentage of long-term FSM-eligible pupils.
Figure 11. Annual changes in GDP, 2006–2019.
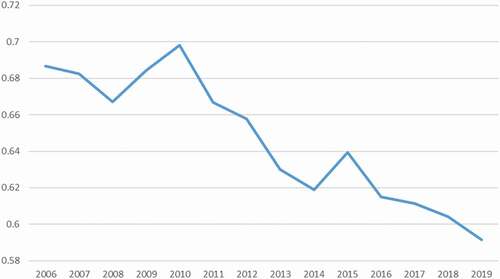
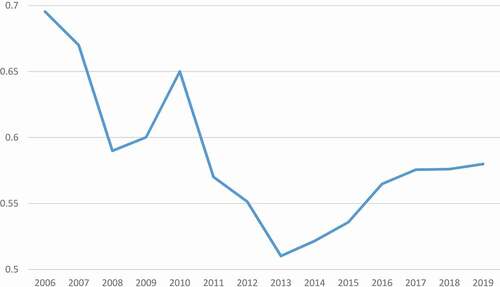
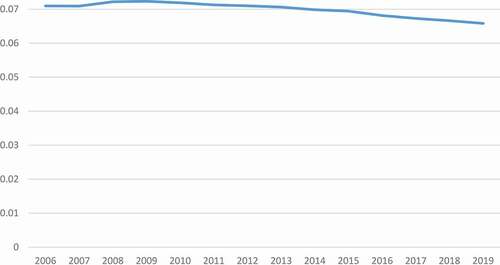
Insofar as we can tell using PISA data, the segregation of the (very few) poorest pupils in private schools has remained relatively static since 2004 (Martínez-Garrido, Siddiqui, and Gorard Citation2020). However, even in PISA the data on private school intakes for England is weak. DfE (Citation2020) figures show that the proportion of pupils in private schools has declined slightly since 2011 (), and the possible impact of this on increasing the attainment gap is investigated in the next section via a regression model.
Figure 12. Percentage of pupils attending private schools, 2006–2019.
Predicting the annual attainment gap
The final stage in the analysis for this paper is a simple regression model, used to predict/explain the national KS2 attainment gaps 2006 to 2019, using economic indicators and a flag representing the Pupil Premium era or not. This makes it possible to consider the potential impact of Pupil Premium funding net of economic changes by looking at the latter first.
shows that it is possible to explain almost 75% of the variation in the attainment gap using only three economic indicators and the Pupil Premium flag, and that the vast majority of the explanation comes from Pupil Premium. Put another way, the attainment gap for the relatively stable group of long-term disadvantaged pupils is slightly affected by economic conditions, but the best single predictor (by far) of the gap in any year is whether it is during or before the Pupil Premium era.
Table 5. Strength of model predicting KS2 attainment over time.
shows the coefficients for all four predictors. All other things being equal, having more pupils in the private sector is associated with an apparent decrease in the attainment gap, and vice versa, as predicted by Gorard, Siddiqui, and See (Citation2019), because those on the margins of private schools will tend to have higher than average attainment. In any year where most of these are in state-funded schools they are included in the NPD gap calculation and so the apparent gap is higher, whereas if they are removed from the calculation the gap is lower. When the economy is better, the gap grows slightly, and also when there are slightly fewer long-term disadvantaged pupils, as there would be when the economy was better. The gap changes with the economy because the temporarily disadvantaged (or advantaged) have somewhat higher average attainment than the permanently disadvantaged (see above).
Table 6. Coefficients for model predicting KS2 attainment over time.
The Pupil Premium era flag has the largest predictive coefficient, and more importantly produces by far the largest increase in R-squared. In the Pupil Premium era, net of other factors included here, the attainment gap is clearly lower. This is not a test of causal influence, and there are many other variables that we might wish to include in the model, but it is clear that something quite remarkable has happened since the advent of Pupil Premium, even for the KS2 attainment gap.
Implications
Some commentators are saying that the Pupil Premium funding is not always used properly by schools, or is otherwise not being effective. They are calling for the money to be used for school general funds (Allen Citation2018; Morris and Dobson Citation2020), or used to recruit, develop and retain teachers (Staufenberg Citation2019). With this kind of uncertainty about the impact and future of the policy, it is important to have good evidence of its effectiveness, and whether it is in need of modification or cancellation.
Unfortunately, from a research perspective, Pupil Premium funding was introduced suddenly and without experimental trial. It was introduced nationally across England, meaning that there is no ‘clean’ comparator. Without robust evaluation it is not possible to say definitively whether the funding is the cause of the improvements noted in this paper, or merely a strong correlate. However, by using the most stable disadvantaged pupil group, the most years of data possible, and factoring in economic and other changes, this paper presents the strongest evidence so far that the Pupil Premium has worked, and is working (2020 data are not available, due to the lockdown).
The evidence presented in this paper is generally positive. Since the extra funding was introduced in 2011, socio-economic segregation between primary schools has declined in a way not predicted by longer term historical figures. This decline is evident both for FSM-eligible pupils when they arrive in Year 1, and for pupils who had been FSM-eligible for five or more years by the end of primary school in Year 6. There is an equivalent drop in the attainment gap at KS1. There was the beginning of a reduction in the attainment gap at KS2, and the gap is still lower than historically. But is has grown again from 2014 onwards, and this is linked to changes in difficulty, scoring, and value-added scores. It seems that the Pupil Premium policy may be being contradicted by other governmental interventions, but has not been picked up in official accounts wherein the attainment gap is strongly affected by changes in the economy and other confounds. Overall though, we can say that the Pupil Premium seems to have worked from the perspective of long-term disadvantaged pupils. They are less clustered in schools, have better KS1 scores, and somewhat better KS2 scores than before 2011.
It would make sense to assume for the present that Pupil Premium should be retained in something like its current form, perhaps with a greater focus on KS1, and calibrated to increase funding for the long-term disadvantaged. It is not like just giving extra money to schools, which prior studies have suggested is less effective, because the funding must be used for the purposes intended, and the government created a parallel programme, including the EEF, to provide guidance to schools on how best to spend it. The policy also differs from one based on giving money to poorer families on condition that their children attend school (Baird, McIntosh, and Özler Citation2011; De Janvry et al. Citation2006; Morley and Coady Citation2003), or to regions, as with the Opportunity Areas (DfE Citation2018a) or Excellence in Cities policies in England, and it differs from a policy based on extra funding for schools themselves that is not tied to their intake, such as the original Specialist Schools and then the Academies programme (Gorard Citation2005).
The paper also shows that areas of England like the North and the Midlands (along with London), with the greatest proportion of long-term disadvantaged pupils, tend to have the lowest attainment gaps and show the greatest improvement over time. If there are lessons to be learned about how to deploy Pupil Premium funding, and so improve life chances for poorer children, these are the areas that policy-makers and other commentators should look at for advice (rather than denigrating).
Acknowledgments
This work contains statistical data from ONS, which is Crown Copyright. The use of the ONS statistical data in this work does not imply the endorsement of the ONS in relation to the interpretation or analysis of the statistical data. This work uses research datasets, which may not exactly reproduce National Statistics aggregates.
Disclosure statement
No potential conflict of interest was reported by the author(s).
Additional information
Notes on contributors
Stephen Gorard
Professor Stephen Gorard is Director of the Durham University Evidence Centre for Education (DECE) https://www.dur.ac.uk/dece/, Professor of Education and Public Policy, and a Fellow of the Academy of Social Sciences. He is passionate about exposing and reducing inequality in education, and improving the quality of education research.
Nadia Siddiqui
Dr Nadia Siddiqui is an Associate Professor at Durham University, leading a British Academy funded study of schooling in Pakistan and India. She is a member of the Cabinet Office What Works Trial Advice panel.
Beng Huat See
Professor Beng Huat See leads an ESRC-funded study of teacher supply. She is a a Fellow of the Academy of Social Sciences, The Higher Education Academy, and the Wolfson Research Institute.
References
- Allen, R. 2018. “The Pupil Premium Is Not Working (Part III): Can Within-classroom Inequalities Ever Be Closed?”, https://rebeccaallen.co.uk/tag/pupil-premium/(accessed 23 October 2020)
- Baird, S., C. McIntosh, and B. Özler. 2011. “Cash or Condition? Evidence from a Cash Transfer Experiment.” The Quarterly Journal of Economics 126 (4): 1709–1753. doi:10.1093/qje/qjr032.
- Behrman, J., S. Parker, P. Todd, and K. Wolpin. 2015. “Aligning Learning Incentives of Students and Teachers: Results from a Social Experiment in Mexican High Schools.” Journal of Political Economy 123 (2): 325–364. doi:10.1086/675910.
- Bettinger, E. 2010. “Paying to Learn: The Effect of Financial Incentives on Elementary School Test Scores”, NBER Working Paper No. 16333: National Bureau of Economic Research; 35pp.
- Bhattacharya, S. 2021. “Intergroup Contact and Its Effects on Discriminatory Attitudes Evidence from India, WIDER Working Paper 2021/42”, WIDER Working Paper 2021/42-Intergroup contact and its effects on discriminatory attitudes: evidence from India (unu.edu)
- Children’s World Report. 2020. https://isciweb.org/wp-content/uploads/2020/07/Summary-Comparative-Report-2020.pdf (Accessed 13 October 2020)
- Clotfelter, C., H. Ladd, and J. Vigdor. 2005. “Who Teaches Whom? Race and the Distribution of Novice Teachers.” Economics of Education Review 24 (4): 377–392. doi:10.1016/j.econedurev.2004.06.008.
- Commission, S. M. 2019. “State of the Nation 2018–19”, https://assets.publishing.service.gov.uk/government/uploads/system/uploads/attachment_data/file/798404/SMC_State_of_the_Nation_Report_2018-19.pdf
- Craske, J. 2018. “‘You Can’t Show Impact with a New Pair of Shoes’: Negotiating Disadvantage through Pupil Premium.” Journal of Education Policy 33 (4): 526–557. doi:10.1080/02680939.2018.1435908.
- Danhier, J. 2018. “How Big Is the Handicap for Disadvantaged Pupils in Segregated Schooling Systems?” British Journal of Educational Studies 66 (3): 341–364. doi:10.1080/00071005.2017.1322682.
- De Janvry, A., F. Finan, E. Sadoulet, and R. Vakis. 2006. “Can Conditional Cash Transfer Programs Serve as Safety Nets in Keeping Children at School and from Working When Exposed to Shocks?” Journal of Development Economics 79 (2): 349–373. doi:10.1016/j.jdeveco.2006.01.013.
- DfE. 2014. Measuring disadvantaged pupils’ attainment gaps over time (updated): Statistical Working Paper, https://assets.publishing.service.gov.uk/government/uploads/system/uploads/attachment_data/file/398657/SFR_40_2014_Measuring_disadvantaged_pupils_attainment_gaps_over_time__updated_.pdf
- DfE. 2016. “Key Stage 2 Assessment and Reporting Arrangements”, https://www.gov.uk/guidance/2016-key-stage-2-assessment-and-reporting-arrangements-ara/section-2-key-changes#:text=2.1%20New%20tests&text=There%20will%20only%20be%201,replaced%20with%20an%20arithmetic%20test
- DfE. 2018a. “Opportunity Area Programme”, https://www.gov.uk/government/publications/opportunity-area-programme-research-and-analysis
- DfE. 2018b. “National Curriculum Assessments at Key Stage 2 in England”, 2018 (revised). https://assets.publishing.service.gov.uk/government/uploads/system/uploads/attachment_data/file/764997/Key_stage_2_text_v7.pdf
- DfE. 2018c “National Curriculum Assessments at Key Stage 2 in England, 2018” (revised), https://assets.publishing.service.gov.uk/government/uploads/system/uploads/attachment_data/file/764135/Key_stage_2_text_v6.pdf
- DfE. 2019 “Pupil Premium: Funding and Accountability for Schools”, https://www.gov.uk/guidance/pupil-premium-information-for-schools-and-alternative-provision-settings?utm_source=2e5c52b2-c00c-4268-82c5-e809ff49194d&utm_medium=email&utm_campaign=govuk-notifications&utm_content=immediate#measuring-the-effectiveness-of-your-approach
- DfE. 2020. “Schools, Pupils and Their Characteristics.” https://explore-education-statistics.service.gov.uk/find-statistics/school-pupils-and-their-characteristics
- Dickerson, A., K. Maragkou, and S. McIntosh. 2018. “The Causal Effect of Secondary School Peers on Educational Aspirations”, CVER Discussion Paper Series, http://cver.lse.ac.uk/textonly/cver/pubs/cverdp017.pdf
- Education and Skills Funding Agency. 2018. “Pupil Premium Grant 2018 to 2019”, https://www.gov.uk/government/publications/pupil-premium-conditions-of-grant-2018-to-2019/pupil-premium-2018-to-2019-conditions-of-grant
- Education Endowment Foundation. 2017. “The Attainment Gap”, https://educationendowmentfoundation.org.uk/public/files/Annual_Reports/EEF_Attainment_Gap_Report_2018_-_print.pdf
- Education Policy Institute. 2017. “Closing the Gap? Trends in Educational Attainment and Disadvantage.”
- Exley, S. 2015. “Pupil Premium ‘Has Failed to Close Attainment Gap’, Thinktank Claims”, Times Educational Supplement, 4/9/15
- Fellows, T., and M. Barton. 2018. “Spotlight on Disadvantage”, National Governance Association, https://www.nga.org.uk/About-Us/Campaigning/Spotlight-on-Disadvantage.aspx
- Feng, L. 2014. “Teacher Placement, Mobility, and Occupational Choices after Teaching.” Education Economics 22 (1): 24–47. doi:10.1080/09645292.2010.511841.
- Foster, D., and R. Long. 2018. “The Pupil Premium, House of Commons Library” Briefing Paper 67007, file:///C:/Users/nbuser/Downloads/SN06700%20(1).pdf
- Freedman, S., and S. Horner. 2008. “School Funding and Social Justice”, Policy Exchange, https://www.policyexchange.org.uk/wp-content/uploads/2016/09/school-funding-and-social-justice-oct-08-3.pdf
- Fryer, R. 2010. “Financial Incentives and Student Achievement: Evidence from Randomized Trials”, NBER Working Paper No. 15898: National Bureau of Economic Research, 107pp
- Gorard, S. 2005. “Academies as the ‘Future of Schooling’: Is This an Evidence-based Policy?” Journal of Education Policy 20 (3): 369–377. doi:10.1080/02680930500117321.
- Gorard, S. 2012. “Who Is Eligible for Free School Meals? Characterising free School Meals as a Measure of Disadvantage in England.” British Educational Research Journal 38 (6): 1003–1017. doi:10.1080/01411926.2011.608118.
- Gorard, S. 2015. “The Complex Determinants of School Intake Characteristics and Segregation, England 1989 to 2014.” Cambridge Journal of Education 46 (1): 131–146. doi:10.1080/0305764X.2015.1045446.
- Gorard, S. 2018. Education Policy: Evidence of Equity and Effectiveness. Bristol: Policy Press.
- Gorard, S. 2020. “Handling missing data in numeric analyses.“ International Journal of Social Research Methods 23 (6): 651–660.
- Gorard, S., and B. H. See. 2013. “Do Parental Involvement Interventions Increase Attainment? A Review of the Evidence.”
- Gorard, S., and N. Siddiqui. 2019. “How Trajectories of Disadvantage Help Explain School Attainment”, SAGE Open, https://journals.sagepub.com/doi/10.1177/2158244018825171
- Gorard, S., N. Siddiqui, and B. H. See. 2019. “The Difficulties of Judging What Difference the Pupil Premium Has Made to School Intakes and Outcomes in England”, Research Papers in Education, https://www.tandfonline.com/doi/full/10.1080/02671522.2019.1677759
- Gov.uk. 2010. “Government Announces Pupil Premium to Raise Achievement”, https://www.gov.uk/government/news/government-announces-pupil-premium-to-raise-achievement
- Hanushek, E. A. P. Peterson, L. Talpey, and L. Woessmann. 2019. “The Achievement Gap FAILS TO CLOSE: Half Century of Testing Shows Persistent Divide between Haves and Have-nots.” Education Next 19 (3): 8+.
- Henry, G., C. Fortner, and C. Thompson. 2010. “Targeted Funding for Educationally Disadvantaged Students: A Regression Discontinuity Estimate of the Impact on High School Student Achievement.” Educational Evaluation and Policy Analysis 32 (2): 183–204. doi:10.3102/0162373710370620.
- Hewstone, M., A. Ramiah, K. Schmid, C. Floe, M. Van Zalk, R. Wolfer, and R. New. 2018. “Influence of Segregation versus Mixing: Intergroup Contact and Attitudes among White-British and Asian-British Students in High Schools in Oldham: England”, Theory and Research in Education, http://journals.sagepub.com/doi/10.1177/1477878518779879
- Holmlund, H., S. McNally, and M. Viarengo. 2010. “Does Money Matter for Schools?” Economics of Education Review 29 (6): 1154–1164. doi:10.1016/j.econedurev.2010.06.008.
- Hutchinson, J., M. Reader, and A. Akhal. 2020. Education in England: Annual Report 2020. Education Policy Institute.
- Lavy, V. 2002. “Evaluating the Effect of Teachers’ Group Performance Incentives on Pupil Achievement.” Journal of Political Economy 110 (6): 1286–1317. doi:10.1086/342810.
- Lessof, C., A. Ross, R. Brind, C. Harding, E. Bell, and G. Kyriakopoulos. 2018. “Understanding KS4 Attainment and Progress: Evidence from LSYPE2”, Research report, DFE, https://assets.publishing.service.gov.uk/government/uploads/system/uploads/attachment_data/file/748514/Understanding_KS4_LSYPE2_research-report.pdf
- Martínez-Garrido, C., N. Siddiqui, and S. Gorard. 2020. “Longitudinal Study of Socioeconomic Segregation between Schools in the UK.” Revista Iberoamericana sobre Calidad, Eficacia y Cambio en Educación 18 (4): 123–141. doi:10.15366/reice2020.18.4.005.
- Mbiti, I., K. Muralidharan, M. Romero, Y. Schipper, C. Mandak, and R. Rajani. 2019. “Inputs, Incentives, and Complementarities in Education: Experimental Evidence from Tanzania”, NBER Working Paper No. 24876, https://www.nber.org/papers/w24876
- Morley, S., and D. Coady. 2003. From Social Assistance to Social Development: Targeted Education Subsidies in Developing Countries. Washington DC: Peterson Institute Press, All Books.
- Morris, R., and G. Dobson. 2020. “Spending the Pupil Premium: What Influences Leaders’ Decision-making?” Educational Management Administration and Leadership 1741143220905062. https://doi.org/10.1177/1741143220905062
- National Audit Office. 2015. “Funding for Disadvantaged Pupils, June 2015”, p.11
- Public Accounts Committee. 2015. “Funding for Disadvantaged Pupils”, HC 327, 9 October 2015
- Riccio, J., N. Dechausay, D. Greenberg, C. Miller, Z. Rucks, and N. Verma. 2010. Toward Reduced Poverty across Generations: Early Findings from New York City’s Conditional Cash Transfer Program. New York, NY: MDRC.
- Rolle, A., E. Houck, and A. McColl. 2008. “And Poor Children Continue to Wait: An Analysis of Horizontal and Vertical Equity among North Carolina School Districts in the Face of Judicially Mandated Policy Restraints 1996–2006.” Journal of Education Finance 34 (1): 75–102.
- See, B. H., S. Gorard, R. Morris, and N. el-Soufi. 2020. “What works in attracting and retaining teachers in challenging schools and areas?“ Oxford Review of Education, https://doi.org/10.1080/03054985.2020.1775566
- Staufenberg, J. 2019. “Re-focus Pupil Premium on Teacher Retention and CPD, Say MPs”, Schools Week, 21/2/19, https://schoolsweek.co.uk/re-focus-pupil-premium-on-teacher-retention-and-cpd-say-mps/
- Toutkoushian, R., and R. Michael. 2007. “An Alternative Approach to Measuring Horizontal and Vertical Equity in School Funding.” Journal of Education Finance 32 (4): 395–421.
- Whittaker, F. 2021. “Narrowing Attainment Gap Stopped Being ‘Main Focus’ of DfE in 2015, Says Former Permanent Secretary”, Schools Week, 5/3/21, https://schoolsweek.co.uk/narrowing-attainment-gap-stopped-being-main-focus-of-dfe-in-2015-says-former-permanent-secretary/
Appendix
Table A1. Percentage of pupils long-term and temporarily FSM-eligible.
Table A2. Year 1 segregation of FSM-eligible pupils.
Table A3. Attainment gap, KS1 points (raw scores).
Table A4. Attainment gap, KS1 points (z-scores).
Table A5. Attainment gap, KS1 points (z-scores), by Economic Region.
Table A6. KS2 segregation of pupils FSM-eligible for five or more years.
Table A7. Attainment gap, KS2 points (raw scores).
Table A8. Attainment gap, KS2 points (z-scores).
Table A9. Rank gap, KS2 Average Points.
Table A10. Attainment gap, KS2 points (z-scores), by Economic Region.