?Mathematical formulae have been encoded as MathML and are displayed in this HTML version using MathJax in order to improve their display. Uncheck the box to turn MathJax off. This feature requires Javascript. Click on a formula to zoom.
ABSTRACT
This article examines the effects of education system types and characteristics on changes in the distributions of literacy and numeracy skills during the upper secondary phase of education and training. Whereas there is a substantial literature on system effects on skills during the primary and lower secondary phases of education, much less has been written about these effects in relation to the upper secondary phase. This article reports on research using quasi-cohort data for 15-year-olds in PISA (Programme for International Student Assessment) and 18- to 20-year-olds in the Survey of Adult Skills to test the effects of a range of system indicators on changes in skills distributions during the upper secondary phase. Consistent with some dominant theories, our difference-in-difference analysis identifies a range of system characteristics associated with skills inequality reduction in upper secondary education and training, which relate to ‘system standardisation’ and ‘parity of esteem’, and which can explain why some ‘system types’ are more effective than others in reducing skills inequality.
1. Introduction
This article examines the effects of education system types and characteristics on changes in the distribution of literacy and numeracy skills during the upper secondary phase of education and training. There is an extensive cross-country literature on education system effects on skills during the primary and lower-secondary phases of education. This draws on data from international large-scale assessments in education, including PIRLS (Progress in International Reading Literacy Study), TIMSS (Trends in International Mathematics Study) and PISA (Programme for International Student Assessment), which conducts tests of proficiency in reading, mathematics and science amongst students aged 15. The wide range of international data available on skills and education systems covering two decades has allowed researchers to make comparative estimates of country-level changes in the levels and distributions of core skills during primary and lower secondary phases of education (e.g., Hanushek and Woessmann, Citation2006). It has also made it possible to explore how far education system characteristics explain the substantial variation across countries in these changes.
Much less comparative research, however, has been conducted on skills acquisition during upper secondary education and training due to the relative paucity of international data for this phase. However, this situation is beginning to change with the development of the OECD’s Survey of Adult Skills (SAS – also known as PIAAC), which was first fielded in 24 countries and regions in 2011/12 and now tests proficiency in literacy, numeracy and problem solving in over 40 countries and regions. A number of reports were published using data from the first round of SAS (including: Borgonovi et al. Citation2017; Green, Green, and Pensiero Citation2015; OECD Citation2013) drawing tentative conclusions about the role of system characteristics in explaining the variation across countries in changes in skills distributions during the upper secondary phase.
In this article, we seek to build on earlier work and provide more robust evidence on system effects in three ways. Firstly, we use data from the larger sample of countries in both waves 1 and 2 of SAS. Secondly, we test the effects of wider range of system indicators than in earlier studies. Thirdly, we use a variety of statistical methods to analyse the relationships across countries between system types and characteristics and changes in skills distributions. Whereas Green and Pensiero (Citation2016) analysed changes using quasi-cohort analysis of published data on skills from PISA (at age 15) and SAS (at age 25–29), thus allowing compounding effects from tertiary education and employment, here we use customised data from the OECD on skills scores at age 18–20 to capture more precisely the skills at the beginning and end of upper secondary education and training.
2. Literature review
Much of the comparative work on educational inequality builds on the seminal work of Raymond Boudon in the 1970s, which used rational action theory to explain the reproduction of social class through education. According to Boudon’s (Citation1974) influential ‘positional theory’, social stratification has both primary and secondary effects within the education system. Primary effects occur because of the transmission of cultural resources within the family, so that children who acquire high levels of certain cultural resources at home may achieve better in schools that valorise similar resources. Secondary effects occur due to children from different backgrounds making different choices within the education system, whereby children from higher status families, for instance, are more likely to choose pathways that lead to higher status qualifications than children of similar attainment from lower status families. Boudon refers to this process as ‘positional’ since students will make rational choices about what educational paths to follow which may be influenced by their positioning in the social structure and the way this may shape their estimation of the costs and benefits of different choices. This may include, for instance, the perceived personal costs of choosing higher status routes, which may distance them from their social and cultural origins.
The first process tends to occur, arguably, in a similar way in all education systems (Jackson Citation2013). However, the second process may be more conditional on the nature of the particular education system. As Boudon cogently argued, in societies structured by social class and other inequalities, the greater the variety of different routes through the education system – i.e. the more ‘branching-off’ points – the greater the likelihood that socially differentiated aspirations and expectations, engendered from outside the education system, will structure student choices, even in a situation of ostensibly meritocratic access, so that educational opportunities and outcomes will be structured along lines of social class. Boudon’s theory emphasises the differential effects of education systems with varying structures, and how these structures mediate the effects of educational expansion on social mobility, and has thus been particularly influential in comparative analyses.
The notion of branching points in Boudon’s theory, when applied to upper secondary education, would imply that more tracked systems there will increase inequality. Social origin effects will be enhanced in systems with more differentially valued pathways as family background differences encourage socially stratified patterns of pathway choice. Educational (and skills) outcomes will become more unequal as social segregation in tracks, and ‘peer effects’ within schools, encourages greater differentiation in curricula and aspirational norms across tracks. A special issue of the Oxford Review of Education (Heath and Sullivan Citation2011) analysed what happened to social inequalities in upper secondary education as this phase of education was ‘democratised’ over the previous 20 years. In a number of cases examined, including France and Japan, social inequality has persisted at similar levels, despite massification. The authors of the chapters on France (Ichou and Vallet Citation2011) and Japan (Kariya Citation2011) explain this with reference to the theory of Effectively Maintained Inequality (Lucas Citation2001). This argues that as a given level of education becomes near universal it tends to become more differentiated, allowing students from higher class families to colonise the more prestigious tracks, which offer the greatest potential for educational advancement.
A second hypothesis derives from the comparative literature specific to upper secondary education and training and suggests that tracking may not necessarily have the expected Boudonian effect during the upper secondary phase. This literature focuses on the so-called ‘parity of esteem’ between the academic and vocational tracks and argues that where this is relatively greater there will be more mitigation of inequality during this phase (Lasonen and Young Citation1998; Raffe et al. Citation1998, Citation2001). Where vocational tracks are of high quality and attract students from across the ability spectrum this is likely to lead to a mitigation of skills inequality. Peer effects are likely to help raise the standards of the lower achievers in the vocational track. Whereas the previous hypotheses are based on the Boudonian assumption that greater standardisation of curricula across pathways will reduce inequality, the parity of esteem argument qualifies the standardisation argument in as much as it allows for certain forms of tracking in upper secondary education which reduce inequality by virtue of the fact that the pathways are not aligned monotonically in a single status hierarchy, as tends to be the case in lower secondary education.
Finally, international policy debates about the characteristics of ‘high performing education systems’ have become increasingly preoccupied with the question of teacher quality (Barber and Mourshed Citation2007; Dolton and Marcenaro-Gutierrez Citation2011; Hanushek, Piopiunik, and Wiederhold Citation2019). In contrast, relatively few empirical studies have sought to disentangle the specific effect of teacher workload on skill outcomes and inequalities within an education system. A notable exception is Huebener et al.’s (Citation2017) study of the effect of an increase in teachers’ instruction time on students in Germany, which concluded that additional teacher workload actually increases the performance gap between high- and low-achieving students. It might reasonably be argued that increased workload deprives teacher of time and resources that would be best used in a more targeted way to support students towards the lower end of the skills distribution.
System types and their characteristics
These theories can be tested using statistical analysis of the effects of system characteristics and system types on changes in skills inequality during the upper secondary phase. The development of a typology of system types, based on common and distinguishing characteristics, is the first step in this process. As with Weberian ‘ideal types’, these are used as a heuristic device to analyse how different combinations of institutional characteristics are combined and articulated to produce given outcomes. Our typology of upper secondary systems draws on theories and typologies commonly found in the comparative education and training literature, which classifies systems according to institutional structures, forms of curriculum, pedagogy and assessment, and modes of governance and regulation (Busemeyer and Iversen Citation2011; Green Citation2003; Greinert, Citation2004; OECD Citation1985; Raffe et al. Citation2001; Verdier Citation2013). These typologies are theory-driven in as much as they seek to show how the articulation of certain institutional features within different system types can lead to different outcomes. However, they are also substantially empirically based, identifying the sets of characteristics which constitute different types, and using cross-national indicator data on relevant characteristics to allocate systems to types. The indicators (for instance from OECD and Eurydice) are becoming increasingly comprehensive over time, as well as better specified to capture relevant system characteristics. We modify the typology in accordance with the latest empirical international data on relevant indicators, while adding our own indicators and data from country-level sources where relevant indicators are not available. The typology plays a recursive role in this research since our analysis of system characteristics has also fed back into the refining of the typology.
We can identify five broad types of upper secondary education and training systems in OECD countries relating to systems as they were during the period when the 18- to 20-year- olds tested in SAS (in 2011–2014) were going through upper secondary education (i.e., roughly 2008–2014). The country groups emerging from this bear a close resemblance to the classifications of economies and welfare systems in the comparative political economy literature, with ‘liberal’, mostly Anglophone, countries representing the core of one type, the ‘social market’ and ‘social democratic’ political economies representing two further types, and southern Europe and East Asia being accredited with separate, though less distinctive, political economy models (see Esping-Andersen Citation1990; Hall and Soskice Citation2001). The connections between the two forms of classification should not be surprising since education systems form an integral part of welfare systems in general and are substantially affected by external contexts, such as labour markets (see Busemeyer Citation2014).
Type 1
These are predominantly school-based systems with general academic and vocational provision in different types of dedicated upper secondary institution and with apprenticeships representing separate but residual systems.Footnote1 This is the modal type in southern European countries and other western countries influenced historically by the French education system and also, through more complex genealogies, in central and eastern European (CEE) and East Asian countries (Green Citation2013). Programmes in upper secondary institutions normally last for two or – more usually – three years from the age of 15, and end with a qualification which gives access to general university higher education in the case of general education students, and vocational tertiary education for vocational students. The curricula in different general and vocational programmes today generally share certain common core elements but programmes are typically organised around a cluster of subjects specific to the disciplinary or vocational orientation of programme. Diplomas are normally based on externally administered ‘grouped awards’ which require passes in a range of subjects, including core areas of language, maths (and sometimes civics).
Type 2
These are predominantly comprehensive, school-based systems with academic and vocational provision within the same institution. Provision is organised either as a standardised, core-plus-options programme, as in most North American high schools, or in differentiated programmes with distinctive subject specialisms but overlapping cores of general education, as in Norway or Sweden. Study durations tend to be standardised at two or three years across all tracks in the US and Canada and at three years in the Nordic countries. These systems share many of the characteristics of Type 1 systems but tend to have a higher degree of integration of curricula and assessment across the range of provision (Raffe et al. Citation2001). They can be regarded as relatively standardised on one level – since there is only one main type of upper secondary institution and all programmes tend to have long cycles. However, governance and regulation vary considerably between the US and Scandinavian contexts, with school choice and diversity policies in the federal US system leading to much greater institutional variation than would be found in the more standardised and unitary Nordic systems. US high-school configurations vary by state but can include private high schools, public comprehensive high schools, Charter schools, Magnet schools and, in a few cases, vocational high schools. There is also considerable variation in levels of funding across districts and schools. Norway and Sweden, by contrast, have one type of public high school and there are relatively few private schools (although this has increased in Sweden during the past decade) (Wiborg Citation2015). The two Nordic countries have a relatively high proportion in vocational programmes in high school, with a substantial proportion in combined school and work programmes in Norway, whereas the US classify all students as being in general programmes.
A number of countries have some comprehensive upper secondary institutions but only four OECD countries have this type of institution as the dominant institutional form (Canada; Norway; Sweden and the US). Because of differences in governance and regulation, Type 2 systems are best divided between Type 2a for the North American variant and Type 2b for the Scandinavian variant.
Type 3
These are systems with participation distributed relatively equally between school-based general education (in different school types) and employment-based Dual Systems of apprenticeship and are found exclusively in social market political economies. In this kind of system, the provision at upper secondary level may be of similar duration across the different tracks, and the vocational track contains significant mandatory components of general education in all Dual System apprenticeships (Solga et al. Citation2014). However, the general and vocational tracks remain distinct, with clear differences in forms of regulation, curricula and assessment, and with differentiated final qualifications and subsequent progression possibilities in education, training and work. In respect of their Dual Systems, Type 3 systems have distinctive forms of regulation based on social partner organisations. This means that apprenticeship systems are closely integrated with labour market institutions which has significant effects on the labour market value of the qualifications they offer and the consequent incentives this provides for apprentices (Busemeyer and Iversen Citation2011).
Dual System apprenticeships are generally considered to be of high quality and the programmes attract a large number of students, coming from across the ability range, including a substantial proportion graduating from the academic Gymnasium or even higher education (Schneider and Tieben Citation2011). These higher achieving entrants add to the prestige of the vocational system, the quality of its outputs, and the value of its qualifications on the labour market, the latter being boosted in addition by strong labour market demand for intermediate skills (Hall and Soskice Citation2001). With such apprenticeship systems, it is argued (Raffe et al. Citation2001), there will be greater parity of esteem between the academic and vocational tracks, and consequently expectation and achievement in the vocational tracks will be higher. In our sample only Austria and Germany had Dual Systems in which more than a third of the cohort participated (OECD, 2008, 331).
Type 4
These are ‘Mixed Systems’ which include many different school- and employment-based programmes of variable length and quality but with dominant academic tracks. Systems of this type tend to have pronounced status gaps between academic and vocational programmes with the most qualified students entering academic programmes and the least qualified confined to vocational programmes which are often shorter in duration and do not necessarily offer progression routes into higher level programmes or high-quality jobs. Wage returns to vocational qualifications on the labour market tend to be relatively low (see for the UK: Greenwood, Jenkins, and Vignoles Citation2007). Where, as in the UK, there remains considerable labour market demand for low skills recruits, participants on these programmes may have little incentive to raise their skills levels (Keep and Mayhew Citation2014), except in the limited range of high-quality apprentice programmes that offer long cycle training up to ISCED level 3.
Mixed systems are notable for their lack of curriculum standardisation since they lack a common core curriculum and do not mandate the study of maths and the national language across all tracks. The general education component of vocational courses tends to be quite limited and vocational courses, particularly in Anglophone countries, are often competence-based. Assessment in general subjects can be through elective single subject awards (as with the A-levels in England) or, in a few cases, ‘grouped awards’, as with the Bachillerato in Spain. Regulation and governance in mixed systems is generally more market-oriented than in other systems, with much diversity in programmes and types of providers, including private training organisations and, in the case of the UK, private awarding bodies. Systems in this group tend to have lower participation rates amongst 17- and 18-year-oldsFootnote2 and relatively high rates of early school leaving (without qualifications above the ISCED 3C (short) level.)Footnote3 With the exception of Israel and Spain, countries in this group all belong to the ‘liberal’ model of political economy identified in the varieties of capitalism literature.
2.1 Hypotheses
On the basis of the review of the literature, we hypothesise that the following factors will affect changes in skills inequality during the upper secondary phase:
Greater system diversification, through the proliferation of school types, may increase skills inequality, except in cases where academic and vocational schools retain relative ‘parity of esteem’.
Certain elements of school standardisation (such as in core curricula, resourcing and teacher workloads) may reduce skills inequality.
Greater prevalence of vocational learning, particularly through apprenticeships, may raise skills levels, particular amongst lower attainers.
Linking these hypothetical effects to our typology of upper-secondary education systems, we surmise that:
Type 2b and Type 3 systems will reduce skills inequality because of curriculum standardisation in key areas (mandatory literacy and numeracy provision; length of courses) and due to relative parity of esteem between academic and vocational tracks (particularly in Type 3 systems).
Type 4 systems will be less effective in reducing skills inequality because of the institutional fragmentation and lack of curriculum standardisation in core areas, both of which undermine normative standards. Comparatively low recruitment to vocational programmes seen to be of low quality, and the large status gaps between these and academic programmes, will also tend to sustain skills inequalities in the upper secondary phase.
Type 2a systems will be less effective in reducing skills inequality because of the relative absence of vocational learning.
3. Data and methods
In order to assess the effects of system types and characteristics on changes in inequality of skills outcomes, we adopt a quasi-cohort approach comparing literacy and numeracy outcomes at age 15 (around the beginning of upper secondary) using PISA data, with outcomes at age 18–20 (around the end of upper secondary) using SAS data. We match 15-year-olds in PISA 2006 and 2009 with 18–20-year-olds in the corresponding round of SAS in 2011/12 and 2014/15, when the PISA birth-cohort will be completing upper secondary education. We use data for 32 countries and sub-national regions which are included in both surveys for the relevant years.Footnote4 outlines the waves of PISA and SAS used for each country, and the system type to which they have been allocated.
Table 1. Countries included in the sample.
PISA and SAS have some different design features that call for caution when comparing scores across tests (Cathles et al. Citation2018; Gal and Tout Citation2014). Nevertheless, the two surveys draw on similar underlying constructs of literacy and numeracy competence and both assess the ability to apply literacy and numeracy skills in real-world contexts. As noted by authors who use data from multiple assessments in cross-country comparisons (Hanushek and Woßmann Citation2006; Hanushek and Woessmann Citation2010; Micklewright, Citation2006) results from different tests have been shown to be highly correlated at the country level, even when comparing between curriculum-based tests (TIMSS) and applied tests (PISA) or applied tests for 15-year-olds (PISA) and adults (International Adult Literacy Survey – IALS) (with correlation coefficients over 0.85). In this analysis, we limit comparability problems by standardising test scores and comparing countries on distributions of scores, rather than on mean levels or social gradients.
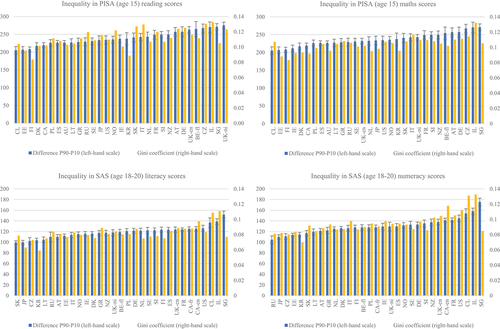
In keeping with previous studies (Green and Pensiero Citation2016; Thomas, Wang, and Fan Citation2000), we measure the inequality by computing a skills Gini coefficient that calculates the distributions across the entire range of scores for each population.Footnote5 The outcome is a continuous variable on a scale between 0 and 1, where 1 represents a situation where all the skills are held by one person (perfect inequality), and 0 a situation where everyone has the same skill level (perfect equality). Alternative measures of skills inequalities were examined to ensure consistency in the interpretation of this approach. We present in the appendix differences between the top and bottom deciles (P90 – P10) in the distributions of reading/literacy and maths/numeracy for each country in the sample, along with 95% confidence intervals (See and Figure A1 in the Appendix). We compare this measure with that of the Gini coefficients and find no substantial deviations in the overall ranking of countries in terms of inequalities.
In addition to these indicators of skills inequalities derived from the PISA and SAS datasets, our analysis included 12 indicators of system characteristics which have been posited as relevant factors in explaining cross-country variation in skills outcomes. Data on these indicators are derived, as far as possible, from publicly available datasets on educational statistics (Eurydice Citation2019; OECD Citation2021; UNESCO Citation2021), and refer to time-points close to the start of our cohorts’ upper-secondary education. Where suitable indicators cannot be found in the existing international literature to match relevant factors identified in the literature review, we have developed new indicators drawing on statistics from sources such as Eurydice or from examination of information in county-specific sources, whether from official Government statistics or from published research studies.
3.1. Analytic approach
To assess the cross-system variation in skills distributions, we adopt two parallel empirical strategies. First, we employ ordinary least-squares (OLS) regression to model the relationship between inequality of skills outcomes in numeracy and literacy and system type, following the specification:
The dependent variable, Y, is the value of the Gini coefficient for the distribution of standardised scores in literacy (numeracy) from the SAS dataset for participants aged 18-to-20. The parameter of interest relates to the regression coefficient () for system type, which is presented for each of the distinct system types (Type 2a, 2b, 3 and 4), in comparison to the reference group (Type 1 systems). PISA distributions (
) are controlled for by including Gini coefficients for reading (mathematics) as independent variables in these models.
Second, we seek to account for the effect of a wide range of cultural, historical and policy differences between countries included in our sample by adopting a difference-in-differences (DID) approach. As noted elsewhere (Green and Pensiero Citation2016), OLS estimators are likely to be biased as they do not account for systematic differences between countries at the start of upper secondary education. A DID approach controls for time-invariant factors that are likely to affect skills outcomes and inequalities over and above the estimated effect of the independent variable alone.
The parameter of interest in our DID models relates to the difference in average skills inequality in one group before and after ‘treatment’ (defined in this case as the upper secondary phase of education) minus the difference in average inequality in a reference group before and after ‘treatment’:
This is implemented using a regression framework, with the following specification:
As above, the dependent variable, Y, refers to the Gini coefficient relating to the distribution of standardised test scores. The variable, T, is a dummy that takes the value of 1 for observations relating to 18- to 20-year-olds (i.e., SAS) and 0 for age 15 observations (i.e., PISA). The parameter of interest, then, is given by the interaction term [γ1 T. system type], which refers to the change in the coefficient of the independent variable over the time period examined.
Whilst we expect results from the DID analysis to be more robust, given that they account for the time invariant factors that may affect outcomes and distributions of skills that are omitted in ordinary least-squares models, the OLS regression estimates can provide at least indicative evidence of an effect even if traditional thresholds of statistical significance are not attained in the DID analysis.
Our analysis of individual system characteristics follows an identical strategy as described above but substitutes specific variables of interest for the system type variable to model their independent effect on skills distributions. This allows for a more fine-grained examination of specific indicators that may influence some systems to improve their performance more than others.
3.2. Skills inequalities
Our initial focus here is on changes in skills inequality – as measured by the skills Gini coefficient – and how this compares across countries and system types. shows that in literacy all countries, with the exception of Chile, managed to reduce inequality in scores during the upper-secondary stage, although there is considerable variability in terms of the magnitude of this reduction. For numeracy, six countries saw an increase in inequality, whilst for countries that saw a reduction in inequality, these are typically more modest than those seen in literacy scores.
Figure 1. Gini coefficients of inequality for scores in reading/literacy and maths/numeracy by country/territory (PISA – 15-year-olds and SAS – 18-20-year-olds).
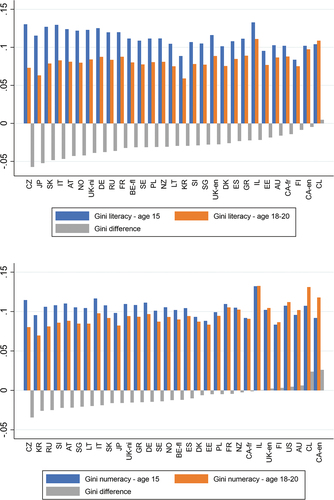
The countries with the greatest reduction in inequalities for literacy (Czech Republic, Japan, Slovakia and Italy) all have Type 1 systems, whilst Type 3 systems (Austria and Germany) come close behind. At the other end of the spectrum, the pattern is less clear-cut with the smallest reductions (or even increases) in inequality in Chile and Australia (Type 4), Canada (Type 2a) and Finland (Type 1).
Similarly, for numeracy, countries with Type 1 systems (again the Czech Republic, but also this time Russia, Korea and Slovenia) had the greatest reduction in inequality, along with Austria and Singapore. The same countries that performed relatively badly in literacy also those saw increases in inequality for numeracy – Canada (English-speaking), Chile, Australia and Finland. In addition, the United States and England also experienced small increases in inequality for numeracy scores.
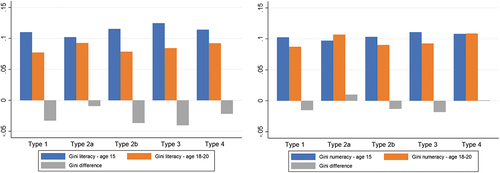
shows inequality mitigation by system type. Reductions were notable in Type 1 and Type 2b systems and, particularly, in Type 3 systems, which saw the most unequal scores at age 15, yet had substantially less unequal distribution of scores at the end of upper-secondary education. By contrast, Type 2a North American systems had a smaller reduction in inequality in literacy and an increase in inequality in numeracy. Type 4 mixed systems saw a reduction in literacy inequality but flatlined in numeracy inequality.
Figure 2. Gini coefficients of inequality for scores in reading/literacy and maths/numeracy by system type (PISA – 15-year-olds and SAS – 18-20-year-olds).
3.3. System characteristics
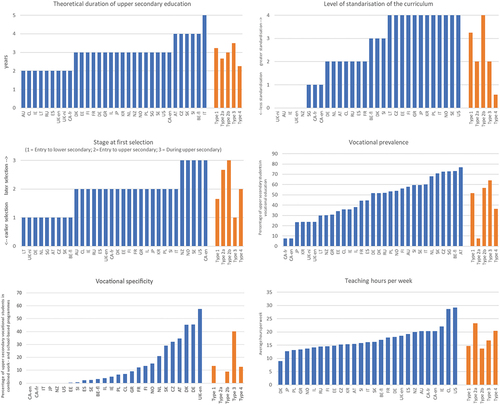
Our analysis included 12 indicators for systems characteristics at the upper secondary level, which, consistent with the literature reviewed above, can broadly be categorised into indicators of standardisation and those that relate to the parity of esteem between general and vocational tracks, and teacher workload. presents descriptive statistics for each of the indicators by country/territory and aggregate scores by system type. We report here only on the analysis of indicators with significant effects. The full analysis can be found in the appendix and online.
Figure 3. Main system characteristics – duration of upper secondary, curriculum standardisation, stage at first selection, vocational prevalence, vocational specificity and teaching hours per week – by country/territory and system type.
3.3.1. System standardisation
Theoretical duration of upper secondary education refers to the number of years students are expected to spend in upper secondary education, assuming no grade repetition or skipping of years. The duration in our sample ranges from two years (e.g., Australia, the UK, French-speaking Canada and Spain) to five years in Italy. The modal duration is three years, which is the case in 17 out of the 32 territories (53.1%).
Standardised curriculum score measures how widely students are obliged to take courses in mathematics and the national language at upper secondary level. A country’s system is scored ‘0’ if none of its programmes require compulsory mathematics/national language; ‘1’ if most of its programmes do; and ‘2’ if all of its programmes do. Scores for mathematics and national language are added for a total score, which provides a proxy measure of curriculum standardisation. Data are obtained via Hogden et al. (Citation2010) and Eurydice (Citation2019) and relate to the situation prevailing around 2010, when the sample enters upper secondary education. Values are available for 30 out of 32 countries in our sample. Values range from zero (e.g., Australia, England, New Zealand and Ireland) to four (e.g., United States, Sweden and Poland). Type 4 systems appear to have the least standardised curriculum in relation to compulsory maths and national language (mean score of .57), whilst the Type 2b Nordic systems both have the maximum score of 4 and Type 1 systems also relatively highly standardised (mean of 3.25), as consistent with our typology.
Stage at first selection measures the degree of tracking present in the education system overall. Students may be required to select (or be selected for) different tracks based on specialised curricula (e.g., vocational or technical programmes). Typically, school-based systems with differentiated tracks select students on entry to lower- or upper-secondary education. Comprehensive systems may have no selection or students select different programmes within a single school type during their upper-secondary education.
3.3.2. Parity of esteem
Vocational prevalence refers to the proportion of students enrolled on upper-secondary level programmes who are in vocational education (UNESCO Citation2020). Data are available for all countries except for the United States.Footnote6 Overall, across all countries in our sample, approximately 46% of students are enrolled in vocational courses at upper-secondary level. However, there is considerable variability between countries and systems. In Canada, for example, only around 7% of students are in a vocational programme, whilst in Austria, the figure is more than 75%. Consistent with our typology, Type 3 (Dual systems) and Type 1 (Differentiated systems) both have greater than 50% participation in vocational upper secondary education. Interestingly, the comprehensive Nordic systems (Type 2b) also have more than half of the upper secondary cohort in vocational education programmes in the comprehensive high school.
Vocational specificity refers to the proportion of vocational students who experience combined school- and work-based learning, which some studies suggest has significant positive effects on skills gain (Green, Green, and Pensiero Citation2015) and significant negative effects on unemployment after school (Bol and Werfhorst, Citation2013). Overall, in our sample, where this category applies, the average proportion in combined learning in school and at work is around one in eight. In many countries, however, including Italy, Japan, New Zealand and the North American systems, combined school- and work-based learning is not possible. As expected, the Dual systems in Germany and Austria have amongst the highest rates of vocational specificity.
3.3.3. Teacher workload
Teaching hours per week is derived by dividing OECD measures for average teaching hoursFootnote7 by the average number of teaching weeks per year (OECD Citation2012). Data are available for 27 countries within our sample, with the US and Chile having significantly higher levels of teaching contact hours than other countries – close to 30 per week. By contrast, in Denmark, teachers have fewer than ten contact hours per week.
4. Results
4.1. The effects of system type on inequality of skills outcomes
We firstly seek to test our hypotheses, outlined above, by analysing the system-type effect on inequality in the two core skills domains of literacy and numeracy. presents estimates from OLS regression and the DID regression models, which compare the average effect on the skills Gini coefficients in different system types to the modal Type 1 (Differentiated) systems.
Table 2. OLS and DID estimates for the effect of system type on inequality in literacy/numeracy.
The OLS models reveal statistically significant differences for Type 2a (North American comprehensive) systems and Type 4 (Mixed) systems, as compared to the reference group (Type 1). Even after controlling for inequality in reading distribution at age 15, the level of inequality in literacy increases by 1.7 standard deviations (SDs) in the North American systems and by 1.35 standard deviations for mixed systems.Footnote8 In numeracy, controlling for PISA (age 15) maths score distributions, inequality increases by 1.64 SDs (Type 2a) and 1.33 SDs (Type 4) relative to students’ scores in the Type 1 systems.
Estimates for the DID models suggest that the size of the effect on inequality for the North American systems actually increases once time-invariant factors (e.g., cultural context, labour market structures etc.) are accounted for, although standard errors suggest that these may not be significantly different from the OLS estimates. Nonetheless, this increase in inequality is particularly marked in the numeracy domain, where Type 2a systems see a 2 SD increase compared to Type 1 systems.
Conversely, the effect size for Type 4 systems is reduced in both domains once time-invariant effects are considered, with the increase in relative inequality no longer attaining statistical significance in numeracy (and in literacy being only at the p < .10 level). Nevertheless, it is notable that the effect on inequality is in the same direction in each calculation and significant in the OLS calculations.
Our findings here provide some evidence therefore to support our hypotheses that Type 2a and Type 4 systems will do less to address skills inequalities compared to the most common Type 1 system. We find no clear difference in inequality changes for either skills domain for Type 2b (Nordic comprehensive) systems or Type 3 (Dual) systems, in comparison to the Type 1 reference group.
4.2. The effect of system characteristics on inequality of skills outcomes
Our analysis also examines the effect of individual system characteristics, including each of these indicators in the models in the place of the system type variable of the previous section. presents the estimates from the OLS and DID regression analyses for six models (with the results for all twelve models given in in the appendix).
Table 3. OLS and DID estimates for the effect of system characteristics on inequality in literacy/numeracy.
We find strong evidence that relative reductions in inequality are linked to the duration of upper secondary education (M1). Whilst the duration of programmes varies between two and five years, an additional year of education is associated with between 0.5 and 0.75 SD reduction in inequality in literacy (p < .05 on both calculations) and between 0.4 and 0.6 SD decrease in inequality for numeracy (p < .10 on both calculations).
We also find a statistically significant effect for our indicator for curriculum standardisation during the upper secondary education (M2) which is associated with a reduction of around 0.3 SDs in inequality of literacy scores and 0.24 SDs for numeracy, according to the OLS analysis. Whilst the DID analysis fails to yield statistically significant results, the fact that they suggest an effect of similar magnitude and in the same direction provides some confirmation that this is a genuine relationship.
A further key way in which many education systems differ is the stage at which students are selected to different tracks. Model 3 indicates that later selection may be associated with greater levels of inequality, especially in the domain of numeracy. The largest effect sizes are seen for systems selecting during upper secondary, as compared to those selecting on entry to lower secondary in numeracy (1.32 SDs in our OLS model; 1.65 SDs in our DID model – both significant at p < .05 level), whilst those selecting on entry to upper secondary also see greater levels of inequality in this domain (although not statistically significant at conventional levels). The effects of stage of selection are less marked for literacy, although in the same directions. Only those systems selecting on entry to upper secondary education (in the DID calculation) have significantly more unequal literacy outcomes (1.22 SDs; p < .05), compared to the reference group.
Systems with greater prevalence of vocational students in upper secondary education (M4) appear to have a more mitigating effect on inequality by comparison with the reference group. These results are statistically significant for numeracy in both calculations and the direction of the effect is the same in both calculations across both domains. By contrast, there are no significant effects on skills inequalities in either domain related to vocational specificity (M5), although, again, the direction of the effect is negative on all calculations.
Teacher workload, as defined by the average number of teaching hours per week, has a statistically significant positive effect on inequality in both literacy and numeracy scores (M6). The difference-in-difference models indicate a 0.12 SD increase in inequality in literacy for each additional hour of teaching, with a similar sized effect seen for numeracy (0.13 SD, p < .10).
Models yielding statistically significant results explain between 5% and 47% of the variance seen in our coefficients of skills inequality, which means that more than a half of the variance can be explained by other aspects of the education system. This is not surprising if we consider the complexity of education systems and the potential for a whole range of observed and unobserved variables to affect the distribution of students’ scores in literacy and numeracy.
5. Discussion and conclusions
The most notable finding from our analysis of system type effects on skills inequalities is that system Types 2a and 4 do less to mitigate skills inequalities in the upper secondary phase than other system types. Type 2a (North American comprehensive) systems perform worse than all other system types in this regard – relative to the reference type, they have a significant positive effect on skills inequality in both literacy and numeracy in both the OLS and DID models. Type 4 (mixed systems) performs similarly but with slightly lower effect sizes and with lower levels of significance on the DID calculations.
The results for the other groups are less clear cut. Type 2b and Type 3 systems do not perform significantly differently from the reference type on any calculation, although there is a substantial negative effect on inequality in both domains in the DID calculation for the Type 3 systems relative to Type 1 systems. Overall, we can say that Type 1 and Type 3 systems perform best, with Type 2b close behind.
These findings are consistent with those in Green and Pensiero’s (Citation2016) study using a DID approach, except in two respects. Firstly, in the current study, Type 3 systems do not perform significantly differently from the top-performing Type 1 systems, whereas in the earlier study, they were significantly better at reducing inequality of skills outcomes in both skills domains (Green and Pensiero Citation2016, 775). Secondly, in the earlier study, Type 4 systems performed worse than Type 2a systems, whereas in the current analysis the situation is reversed. This latter difference may be partly explained by the fact that the earlier study used PISA 2000 scores as the baseline, where results for the UK were affected by a biased sample (Prais Citation2003), which may have produced underestimates of skills inequality at 15. This study uses PISA 2006 and 2009 data which are considered more reliable. Whereas the previous study used published data on 25- to 29-years-olds in SAS as a proxy for skills at the end of upper secondary – thus allowing for intervening effects from post-school employment and learning – the current study uses customised OECD data for 18–20-year-olds in SAS thus providing more direct measure of skills gain in upper secondary education. For both these reasons, we consider the current results to be more robust.
We can dig deeper into the analysis of the differential performance of system types by looking again at the effects across systems of particular system characteristics. The factors found to reduce skills inequality are broadly in line with the predictions from the literature and typology. As argued by Raffe et al. (Citation2001), tracking is not necessarily a barrier to skills inequality reduction in the upper secondary phase. Our Type 1 systems have differentiated upper secondary systems and perform significantly better at inequality reduction than Type 2a (North American comprehensive) systems and not significantly differently from Type 2b (Nordic comprehensive systems). Type 3 countries typically have early selection to their lower secondary schools which our analysis also shows is associated with more inequality reduction in upper secondary than in other types of systems. This is most likely an indirect relationship due to the fact that countries with tracked lower secondary schools are more likely to maintain Dual System apprenticeships at the upper secondary level (Wiborg Citation2015), which it is argued reduce inequalities. The statistical relationship may also reflect the fact that most countries with selective lower secondary schools also tend to have high baselines in terms of inequality at 15 in PISA (e.g., BE, DE, SK, CZ, AT, NL) which may make it is easier to show a decline in inequality in upper secondary relative to other countries which had more equal distributions at the outset.
In any case, what matters more than tracking, according to Raffe et al. (Citation2001), is that upper secondary systems achieve relative ‘parity of esteem’ between the academic and vocational tracks. This can be achieved in comprehensive systems through greater curriculum standardisation across programmes in key areas relating to core skills learning and the longer duration of programmes. It can also be achieved in differentiated systems through high participation in good-quality vocational provision, particularly through Dual System apprenticeships. Our analysis of the inequality mitigating effects of the normalisation of long-cycle upper secondary provision (proxied by our theoretical duration indicator) and the standardisation of maths and national language learning (curriculum standardisation indicator) lends support to the first part of the argument. It is also consistent with the theory of Maximally Maintained Inequality which would predict that inequality declines when participation in long-cycle upper secondary education becomes normalised (i.e., since social gaps in participation reduce when participation of high SES students reaches saturation point and participation by lower social class students continues to increase). Our findings on the inequality reducing effects of vocational prevalence give partial support to the second part of the argument. Our indicator for work-based learning (vocational specificity) also had negative effects on skills inequality on all calculations, although the effects were neither large nor significant.
How these characteristics are combined in upper secondary education systems goes some way to explaining why certain types of system are more effective in reducing skills gaps than others. The systems which do this best in our analysis belong to Types 1, 2b and 3. Type 1 and 2b systems reduce inequality in much the same way. They have relatively integrated upper secondary systems with a substantial degree of standardisation around the length of programmes and the common aspects of their curricula. Courses generally last two or three years and a high proportion of young people complete these long cycle courses and acquire full ISCED Level 3 qualifications. Both Type 1 differentiated systems and Type 2b Nordic comprehensive systems, have a large common core to their curricula across the different programmes, including with the mandatory learning of maths and the national language. Systems of both types also tend to have high rates of participation in vocational programmes, with many systems (e.g., FR, FI, NO, NL, SK, CZ and DK) also having relatively high participation of vocational students in combined school- and work-based learning (ranging from 12% in France to 45% in Denmark).
Type 3 systems (Germany and Austria) have relatively high initial levels of inequality (in PISA). They do relatively well in reducing these skills inequalities because they have high participation in high-quality and well-funded work-based apprenticeships. The prestige of the vocational route is enhanced by the fact that it attracts a relatively balanced mix of students from different backgrounds and with different levels of achievement and offers the prospect of well-paid skilled jobs. Although tracked, Type 3 systems form part of a relatively integrated upper secondary system in as much as academic and vocational/apprenticeship routes share a common core curriculum, and each have a similar duration. Both sets of factors generate relative parity of esteem and serve to reduce skills gaps to some degree.
The systems which perform worst in mitigating skills inequalities (Type 2a and Type 4), by contrast, tend to lack some of the characteristics which our analysis shows tend to reduce skills inequality. Systems in Type 2a have some characteristics of system integration, for instance in ensuring the programmes are of a similar length and all contain learning in core skills. However, their programmes are on average somewhat shorter than those in Type 1 and 2b systems. With the exception of the system in francophone Canada, these systems also have very low rates of participation in vocational learning which may be reducing their capacity to narrow skills gaps. Type 4 mixed systems, as we have seen, have relatively low rates of participation in vocational learning and score on average very low on the measures of system standardisation, including on curriculum standardisation and theoretical duration, which our analysis suggests reduce skills inequality. They are also more institutionally fragmented than other systems which may undermine normative expectations of achievement and thus increase inequality of skills outcomes, although our analysis lacks the indicators to test this adequately.
5.1. Limitations and further research
Whilst our analysis has identified some important system-characteristic effects on skills inequality during the upper secondary phase, there are factors that we have been unable to analyse statistically. Certain pedagogic methods (e.g., ‘mastery learning’), may be effective for the acquisition of core skills like literacy and numeracy, particularly for lower achieving students, and particularly when they are embedded in certain cultural contexts. However, there is no cross-country statistical analysis to support this at present because we do not have quantitative measures of the prevalence of the use of these pedagogies for a wide range of countries.
Another regional characteristic which has so far eluded quantitative comparative analysis is the high rate of participation in supplementary private tutorial schools (or so-called ‘shadow education’) which is particularly characteristic of East Asian societies (Bray Citation2014). Our analysis suggests that literacy and numeracy levels are enhanced by their inclusion throughout longer upper secondary programmes, implying that time spent learning matters. Nonetheless, we currently lack comprehensive international data on learning time amongst upper secondary students. Further research will be needed to establish how far cross-country variation in learning time amongst upper secondary students contributes to the explanation of differences in performance across countries.
From the perspective of teaching staff, our analysis has revealed a significant effect of hours spent teaching, such that longer teaching hours is associated with greater skills inequalities following the end of upper secondary education. This finding was not anticipated on the basis of the literature review and does not appear to be a prevalent theme in the cross-national literature. Whilst a small number of within-country studies have found similar effects in both developed- (e.g., Ost and Schiman Citation2017; Toropova, Myrberg, and Johansson Citation2020) and developing-country (e.g., Attah & Adebayo, Citation2018; Rose and Sika Citation2019) settings, our analysis contributes to this evidence with a cross-national emphasis.
The implication of this finding is, nonetheless, somewhat intuitive – students of teachers experiencing greater workloads perform worse in absolute terms; moreover, widening inequalities of skills distributions suggest that students who require greater teacher assistance (towards the bottom of the distribution) are more negatively impacted by teacher workload levels, compared to students higher up the distribution, who are less reliant on teacher support.
Given the relative scarcity of empirical evidence relating to the independent effect of teacher workload on students’ performance at a cross-national level, this is an important area of future research to ascertain the extent to which improving teachers’ working conditions can positively influence students’ skills acquisition.
Declarations
Funding and support for this project was provided by the Institute for Adult Learning, Singapore University of Social Science. The authors are grateful to the OECD for providing customised data for 18- to 20-year-olds in SAS and to the Leibniz Institute for the Social Sciences for granting access to the German PIAAC survey data via the GESIS Data Archive: ZA5845 – PIAAC, Germany (Reduced Version) – Data file Version 2.2.0, https://doi.org/10.4232/1.12660. The authors have no competing interests to declare that are relevant to the content of this article. The authors would like to thank the anonymous reviewers for their very helpful comments.
Disclosure statement
No potential conflict of interest was reported by the author(s).
Additional information
Funding
Notes
1. Some countries, such as Denmark and the Netherlands, also have substantial element of work-based training as part of their vocational school provision and represent a growing trend towards hybridisation of upper system types (Verdier Citation2013).
2. Spours, Hodgson and Rogers (2018) note short duration for England and Spain particularly.
3. See Eurostat data at: http://epp.eurostat.ec.europa.eu/statistics_explained/index.php/School_enrolment_and_early_leavers_from_education_and_training
4. Note that this includes the sub-national systems of Flanders in Belgium, and England and Northern Ireland in the UK. Scores for SAS are available separately for English- and French-speaking Canada, whilst corresponding PISA scores are available for Canada as a single national unit. Where possible, sub-national indicators and controls are included for these regions of Canada, whilst where data are not available, national-level measures are included as proxies.
5. The formula for the Gini coefficient is given as: , where μ is the average skill level, N is the total number of observations, and yi and yj represent individuals’ levels of skill within the distribution.
6. In the US all high school completers are categorised as having achieved general upper secondary education.
7. i.e. classroom contact hours for teachers in upper secondary programmes.
8. The Gini coefficient can be used to assess the relative mean absolute difference – that is, for two randomly selected students the expected difference in skills would be equivalent to twice the value of the Gini coefficient (Atkinson and Bourguignon Citation2014). A 1 standard deviation increase in the Gini coefficient in our models is equivalent to a 20% (literacy) or 26% (numeracy) increase in the mean expected difference between two randomly selected students.
9. SAS data unavailable to calculate inter-decile differences for Australia.
10. PISA data for Reading for the US are unavailable for 2006 (see main text); here we include 2009 PISA data for comparability.
References
- Atkinson, A. B., and F. Bourguignon, eds. 2014. Handbook of Income Distribution. 2nd ed. Netherlands: Elsevier Science.
- Attah, B. G., and O. J. Adebayo. 2018. “Effects of Training and Workload of Teachers on ‘Achievement of Students’ in Mathematics in Senior Schools in Jos Metropolis, Plateau State, Nigeria.” KIU Journal of Humanities 3 (1): 209–218.
- Barber, M., and M. Mourshed. 2007. How the World’s Best-Performing School Systems Come Out on Top. London: McKinsey & Company.
- Bol, T., and H. Van de Werfhorst 2013. “The Measurement of Tracking, Vocational Orientation, and Standardization of Educational Systems: A Comparative Approach.” GINI Discussion Paper 81. Accessed at: www.gini-research.org.
- Borgonovi, F., A. Pokropek, F. Keslair, B. Gauly, and M. Paccagnella. 2017. “Youth in Transition: How Do Some of the Cohorts Participating in PISA Fare in PIAAC?” In OECD Education Working Papers. Vol. 155, pp. 1–117. Paris: OECD.
- Boudon, R. 1974. Education, Opportunity, and Social Inequality: Changing Prospects in Western Society. New York: John Wiley & Sons.
- Bray, M. 2014. ““The Impact of Shadow Education on Student Academic Achievement: Why the Research Is Inconclusive and What Can Be Done about It.” Asia Pacific Education Review 15 (3): 381–389. doi:10.1007/s12564-014-9326-9.
- Busemeyer, M. 2014. Skills and Inequality: Partisan Politics and the Political Economy of Education Reforms in Western Welfare States. Cambridge: Cambridge University Press.
- Busemeyer, M., and T. Iversen. 2011. “Collective Skills Systems, Wage Bargaining and Labour Market Stratification.” In The Political Economy of Collective Skill Formation, edited by M. Busemeyer and C. Trampusch, 3–38. Oxford: Oxford University Press.
- Cathles, A., D. Ou, S. Sasso, M. Setrana, and T. van Veen. 2018. Where so You Come From, Where Do You Go? Assessing Skills Gaps and Labour Market Outcomes of Young Adults with Different Immigration Backgrounds. Munich: CESifo.
- Dolton, P., and O. D. Marcenaro-Gutierrez. 2011. “If You Pay Peanuts Do You Get Monkeys? A Cross-country Analysis of Teacher Pay and Pupil Performance.” Economic Policy 26 (65): 5–55. doi:10.1111/j.1468-0327.2010.00257.x.
- Esping-Andersen, G. 1990. The Three Worlds of Welfare Capitalism. Princeton: Princeton University Press.
- Eurydice. 2019. Structural Indicators for Monitoring Education and Training Systems in Europe – 2019: Overview of Major Reforms since 2015. Brussels: Eurydice.
- Gal, I., and D. Tout 2014. Comparison of PIAAC and PISA Frameworks for Numeracy and Literacy. OECD Education Working paper 102. Paris: OECD.
- Green, A. 2003. “The Many Faces of Lifelong Learning: Recent Education Policy Trends in Europe.” Journal of Education Policy 17 (6): 611–626. doi:10.1080/0268093022000032274.
- Green, A. 2013. Education and State Formation: Europe, East Asia and the USA. Basingstoke: Palgrave.
- Green, A., F. Green, and N. Pensiero. 2015. “Cross-Country Variation in Adult Skills Inequality: Why are Skill Levels and Opportunities so Unequal in Anglophone Countries?” Comparative Education Review 59 (4): 595–618. doi:10.1086/683101.
- Green, A., and N. Pensiero. 2016. “The Effects of Upper Secondary Education and Training Systems on Skills Inequality. A Quasi-Cohort Analysis Using PISA 2000 and the OECD Survey of Adult Skills.” British Education Research Journal 45 (5): 756–779. doi:10.1002/berj.3236.
- Greenwood, C., A. Jenkins, and A. Vignoles 2007. The Returns to Qualifications in England: Updating the Evidence Base on Level 2 and Level 3 Vocational Qualifications. Discussion Paper 89. London: LSE Centre for the Economics of Education.
- Greinert, W. 2004. “European Vocational Training ‘Systems’ - Some Thoughts on the Theoretical Context of Their Historical Development.” European Journal of Vocational Training 32: 18–25.
- Hall, P., and D. Soskice, eds. 2001. Varieties of Capitalism: The Institutional Foundations of Comparative Advantage. Oxford: Oxford University Press.
- Hanushek, E., M. Piopiunik, and S. Wiederhold. 2019. “The Value of Smarter Teachers: International Evidence on Teacher Cognitive Skills and Student Performance.” Journal of Human Resources 54 (4): 857–899. doi:10.3368/jhr.54.4.0317.8619R1.
- Hanushek, E., and L. Woessmann 2010. “The Economics of International Differences in Educational Achievement.” NBER Working Paper 15949. Cambridge, MA: National Bureau of Educational Research.
- Hanushek, E., and L. Woßmann. 2006. “Does Educational Tracking Affect Performance and Inequality? Differences-in-Differences Evidence across Countries.” The Economic Journal 116 (510): 63–76. doi:10.1111/j.1468-0297.2006.01076.x.
- Heath, A., and A. Sullivan. 2011. “Introduction: The Democratisation of Upper Secondary Education?” Oxford Review of Education 37 (2): 123–138. doi:10.1080/03054985.2011.559386.
- Hodgen, J., D. Pepper, L. Sturman, and G. Ruddock. 2010. Is the UK an Outlier? an International Comparison of Upper Secondary Mathematics Education. London: Nuffield Foundation.
- Huebener, M., S. Kuger, and J. Marcus. “Increased Instruction Hours and the Widening Gap in Student Performance.” Labour Economics 47: 14–34.
- Ichou, M., and L. A. Vallet. 201. “Do All Roads Lead to Inequality? Trends in French Upper Secondary School Analysed with Four Longitudinal Surveys.” Oxford Review of Education 37 (2): 167–194. doi:10.1080/03054985.2011.559350.
- Jackson, M., ed. 2013. Determined to Succeed? Performance versus Choice in Educational Attainment. Palo Alto: Stanford University Press.
- Kariya, T. 2011. “Japanese Solutions to the Equity and Efficiency Dilemma? Secondary Schools, Inequity and the Arrival of ‘Universal’ Higher Education.” Oxford Review of Education 37 (2): 241–266. doi:10.1080/03054985.2011.559388.
- Keep, E., and K. Mayhew. 2014. “Inequality – ‘Wicked Problems’, Labour Market Outcomes and the Search for Silver Bullets.” Oxford Review of Education 40 (6): 764–781. doi:10.1080/03054985.2014.979580.
- Lasonen, J., and M. Young. 1998. Strategies for Achieving Parity of Esteem in European Upper Secondary Education. Jyväaskyläa: Institute for Educational Research.
- Lucas, S. 2001. “Effectively Maintained Inequality: Education Transitions, Track Mobility, and Social Background Effects.” American Journal of Sociology 106 (6): 1642–1690. doi:10.1086/321300.
- Micklewright, J., and S. Schnepf. “Inequality of Learning in Industrialised Countries”. Discussion paper 2517. Bonn: IZA.
- OECD. 1985. Education and Training beyond Basic Schooling. Paris: OECD.
- OECD. 2012. Education at a Glance 2012. Paris: OECD.
- OECD. 2013. The Survey of Adult Skills: Reader’s Companion. Paris: OECD.
- OECD. 2021. OECD Education Statistics. Available online at: data.oecd.org/education
- Ost, B., and J. C. Schiman. 2017. “Workload and Teacher Absence.” Economics of Education Review 57: 20–30. doi:10.1016/j.econedurev.2017.01.002.
- Prais, S. J. 2003. “Cautions on OECD’s Recent Educational Survey (PISA).” Oxford Review of Education 29 (2): 139–163. doi:10.1080/0305498032000080657.
- Raffe, D., K. Brannen, J. Fairgrieve, and C. Martin. 2001. “Participation, Inclusiveness, Academic Drift and Parity of Esteem: A Comparison of Post-Compulsory Education and Training in England, Wales, Scotland and Northern Ireland.” Oxford Review of Education 27 (2): 173–203. doi:10.1080/03054980123186.
- Raffe, D., C. Howieson, K. Spours, and M. Young. 1998. “The Unification of Post-Compulsory Education: Towards a Conceptual Framework.” British Journal of Educational Studies 46 (2): 169–187. doi:10.1111/1467-8527.00077.
- Rose, A. B., and J. O. Sika. 2019. “Determining Influence of Teacher’s Workload on Academic Performance in Secondary Schools, Suba sub-County Kenya.” Advances in Social Sciences Research Journal 6 (3): 287–295. doi:10.14738/assrj.63.6128.
- Schneider, S. L., and N. Tieben. 2011. “A Healthy Sorting Machine? Social Inequality in the Transition to Upper Secondary Education in Germany.” Oxford Review of Education 37 (2): 139–166. doi:10.1080/03054985.2011.559349.
- Solga, H., C. Protsch, C. Ebner, and C. Brzinsky-Fay 2014. The German Vocational Education and Training System: Its Institutional Configuration, Strengths and Challenges. Discussion Paper. Cologne: University of Cologne and Federal Institute for Vocational Education and Training.
- Thomas, V., Y. Wang, and X. Fan 2000. Measuring Educational Inequality: Gini Coefficients of Education.’ World Bank Working Paper 2525. Washington DC: World Bank.
- Toropova, A., E. Myrberg, and S. Johansson. 2020. “Teacher Job Satisfaction: The Importance of School Working Conditions and Teacher Characteristics.” Educational Review 1–27.
- UNESCO. 2020. Global Education Monitoring Report 2020. Paris: UNES.
- UNESCO. 2021. UIS Statistics. Paris: UNESCO Institute of Statistics. Available online at: data.uis.unesco.org
- Verdier, E. 2013. “Lifelong Learning Regimes versus Vocational Education and Training Systems in Europe: The Growing Hybridisation of National Models.” In The Dynamics and Social Outcomes of Education Systems, edited by J. G. Janmaat, M. Duru-Bellat, A. Green, and P. Méhaut, 70–93. Basingstoke: Palgrave Macmillan.
- Wiborg, S. 2015. “Privatizing Education: Free School Policy in Sweden and England.” Comparative Education Review 59 (3): 473–497. doi:10.1086/681928.
Appendix
Table A1 OLS and DID estimates for the effect of 12 system characteristics on inequality in literacy/numeracy.
Table A2 Skills inequalities in PISA and SAS.
Figure A1 Skills inequalities in PISA and SAS