
 ?Mathematical formulae have been encoded as MathML and are displayed in this HTML version using MathJax in order to improve their display. Uncheck the box to turn MathJax off. This feature requires Javascript. Click on a formula to zoom.
ABSTRACT
Surface force measurements provide deep insights into the structure and response of liquid crystals (LCs) near surfaces and in nanoscale confinement geometries. Thin LC films in the nematic, smectic-A, and cholesteric phases generate equilibrium repulsive forces that are a direct expression of the order, elasticity, and defect-mediated plasticity of the phase. On the other hand, surface interactions modify the molecular order over nanoscale distances and can produce new structure and response in nanoscale LC films. In this review, we discuss equilibrium surface force measurements obtained in thin LC films using the surface forces apparatus (SFA) and the atomic force microscope (AFM). The results illustrate general theoretical concepts related to surfaces and confinement, such as phase frustration, heterophases, capillary condensation, and defect nucleation, many of which are yet to be explored in ferroelectric, spontaneously modulated, and chiral LC phases. These concepts are relevant to technological applications as nanoscale LC films can effectively modulate colloidal interactions in response to external stimuli in composite materials and are increasingly used in nanoscale photonic devices as polarisation-controlling elements.
GRAPHICAL ABSTRACT
1. Introduction
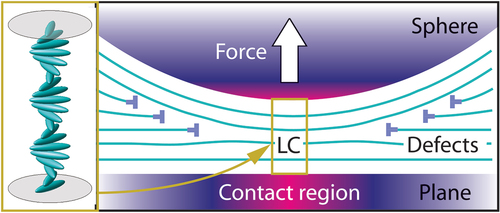
On the macroscopic scale, fluids are often defined as the condensed matter phase that cannot sustain static forces and torques due to a lack of supramolecular long-range order, structure, and shape. Liquid crystals (LCs), on the other hand, provide a paradigmatic example of spontaneous breaking of symmetry and emergence of long-range order [Citation1,Citation2]. It is well known that molecular ordering in LCs creates a strong electrooptical response, which is widely utilised in display technology, optics, and photonics. This review focuses on the less recognised ability of LCs to generate equilibrium surface forces and undergo structural transitions under static spatial confinement. The force generation mechanism is very general: Confinement introduces a dependence of the free energy G on the confinement geometry, so that work must be done on the LC to change its shape and size. A planar LC film with thickness D, for instance, generates a generalised or ‘structural’ force F = –dG/dD that can push the surfaces away from or towards each other.
Equilibrium forces in LCs can be categorised using the phenomenological theory of symmetry breaking in condensed matter [Citation1]. Symmetry breaking is the reduction of invariance from a symmetry group S0 into a subgroup S. A phase is characterised by a ground-state manifold comprising degenerate states that minimise the free energy and are related to each other by the symmetry elements of S. For instance, anisotropic interactions between the building blocks of a nematic LC (microscopic rod-like or coin-like objects) induce alignment along a common direction n that is uniform (translationally invariant) in the nematic ground-state. The nematic manifold is the set of degenerate directions obtained by rotations and inversion of n. The presence of an interface can have a two-fold effect: lift the degeneracy of the ground state and/or induce a different order from that of the LC phase. Surface anchoring in nematics, for instance, is due to anisotropic interfacial interactions that decrease the free energy for one or more directions n0 called easy axes. At the same time, an interface breaks the translation symmetry of the nematic phase along the surface normal z. Therefore, an interface can induce a smectic-like positional order along z over a distance ξ comparable to the order correlation length. Long-range elastic forces are generated when the LC phase is distorted out of the ground-state manifold so that the LC tends to restore the minimum energy. For instance, a nematic responds with a repulsive force and a torque to surface confinement under non-parallel anchoring conditions. Short-range surface forces, on the other hand, are generated when the LC phase (e.g. nematic) is confined between two surfaces that induce a different order (e.g. smectic-like) to a film thickness h < 2ξ. In this case, the distance ξ generally does not exceed 10 nm. If the LC also shows a bulk phase transition to the surface-induced order, such that the distance ξ eventually diverges at the transition, surface confinement can shift the transition point. This may cause the LC phase to undergo capillary condensation into the heterophase induced by the surfaces, e.g. a smectic capillary bridge between two surfaces immersed in the nematic phase.
From the theoretical point of view, force measurements on LC films provide an ideal ground for testing general concepts in condensed matter, such as spontaneous vs. induced ordering, elasticity, phase frustration and transitions, and defect nucleation. In particular, LCs are well suited for studies of molecular ordering at interfaces as surface order couples to and is amplified by the spontaneous order of the LC phase. From a more practical point of view, LCs can be combined with colloids to create composite materials with novel mechanical properties that depend on external stimuli such as heat, electric fields, and light irradiation [Citation3–5]. LC can also be integrated as thin nanoscale films to control the polarisation response of photonic devices such as microcavities and metamaterials [Citation6–9]. In this case, surface force measurements can be used to probe the structure of the nanoconfined LC and relate it to the optical response.
In this review, we focus on thin-film confinement geometries with a single axially symmetric contact point such that the radius of curvature R of the surfaces is much larger than the surface separation distance D. Calling z the common surface normal and r the distance from the contact position (r = 0) in the orthogonal plane, the LC film thickness can be approximated as:
at sufficiently small distances from the contact position such that r << R. This surface geometry is encountered in force measurements with the Surface Forces Apparatus (SFA, ) and colloidal-probe Atomic Force Microscope (AFM, ) discussed in this review. This geometry is equivalent to a sphere with radius R and a plane, or two spheres with radius 2R, at a distance D apart [Citation10,Citation11]. Although boundary conditions are affected by surface curvature (), variations along the x and y directions are of the second order and can be neglected. As a result, the film can be considered locally invariant and unrestricted in the x and y directions. Early reviews on SFA and AFM force measurements in LC films can be found in ref [Citation12].
Figure 1. (a) Schematic illustration of the SFA setup showing the two curved surfaces and the optical path through them. Adapted with permission from [Citation13]. Copyright 1997 American Chemical Society. (b) Schematic of the AFM setup showing a tip in contact with a surface. Reprinted from [Citation10]. Copyright 2011, with permission from Elsevier.
![Figure 1. (a) Schematic illustration of the SFA setup showing the two curved surfaces and the optical path through them. Adapted with permission from [Citation13]. Copyright 1997 American Chemical Society. (b) Schematic of the AFM setup showing a tip in contact with a surface. Reprinted from [Citation10]. Copyright 2011, with permission from Elsevier.](/cms/asset/6eb02524-009b-4ef4-a5a6-7ce99dd2a135/tlct_a_2358443_f0001_b.gif)
Figure 2. (a) Crossed cylindrical surfaces in the SFA. x and y are the cylinder axes, and z is the common surface normal at the contact position (x, y = 0), indicated with an ellipse. D and R are the mica-mica separation distance and cylinder radius, respectively. The surface geometry approximates a sphere and plane around the contact position (x, y << R). Planar anchoring conditions are indicated with rods and induce splay and bend far from the contact position. (b) Optical multilayer at the contact position. The thickness of Ag coating on the mica surfaces is (30 –60) nm. n is the LC director having polar and azimuthal angles ϕ and θ, respectively, relative to the xyz reference frame. u is the projection of n in the xy-plane of the surfaces. γ1 and γ2 are the slow optic axes of the mica surfaces, making an angle ψ with each other. Reprinted from [Citation11] with the permission of AIP Publishing.
![Figure 2. (a) Crossed cylindrical surfaces in the SFA. x and y are the cylinder axes, and z is the common surface normal at the contact position (x, y = 0), indicated with an ellipse. D and R are the mica-mica separation distance and cylinder radius, respectively. The surface geometry approximates a sphere and plane around the contact position (x, y << R). Planar anchoring conditions are indicated with rods and induce splay and bend far from the contact position. (b) Optical multilayer at the contact position. The thickness of Ag coating on the mica surfaces is (30 –60) nm. n is the LC director having polar and azimuthal angles ϕ and θ, respectively, relative to the xyz reference frame. u is the projection of n in the xy-plane of the surfaces. γ1 and γ2 are the slow optic axes of the mica surfaces, making an angle ψ with each other. Reprinted from [Citation11] with the permission of AIP Publishing.](/cms/asset/412c7325-0c89-4456-968a-6ab24583e122/tlct_a_2358443_f0002_oc.jpg)
A different situation, with single-contact surface geometries such that R ≤ D, is often encountered in the study of LC-mediated colloidal interactions. In this geometry, the curvature of the surfaces distorts the LC and typically creates topological defects. The reader is referred to ref [Citation14] for a review of defect-mediated colloidal interactions in LCs and the closely related topic of force measurements using optical and magnetic tweezers.
2. Force-measuring experimental techniques
2.1. Surface forces apparatus (SFA)
The SFA, also known as the surface forces balance (SFB), was developed for measuring surface and interfacial forces between macroscopic surfaces in gases (air, nitrogen, controlled vapours) or liquids [Citation10,Citation15–17]. Most SFA experiments utilise two crossed cylindrical surfaces with a radius R of the order of 1 cm placed at a distance D from each other, ensuring a single contact point (), ) This geometry approximates the sphere-plane geometry of EquationEq. (1)(1)
(1) in the contact region (r/R << 1). The surfaces typically are half-cylindrical quartz or glass lenses covered with transparent and molecularly smooth sheets of muscovite mica. The force component F directed along the surface normal z is generated in a small region around the contact position and is related to the free interaction energy G per unit area between two flat parallel surfaces by the Derjaguin approximation [Citation10]:
The force F is usually measured as a function of the surface separation distance D. SFA experiments routinely achieve an accuracy of 0.1 nm for the normal distance D and about 1 μm for the lateral distance r by implementing a multiple-beam interference (MBI) technique, detailed below.
The distance between the surfaces can be independently controlled with a precision better than 1 nm using a set of motorised and piezoelectric controls. The actuator displacement ΔS is calibrated as being equal to the measured surface displacement ΔD at large separation distances, where it is assumed that F = 0. One of the surfaces is attached to a cantilever spring with an elastic constant K = (100–1000) N/m. As the surfaces are brought closer to one another, the force is measured using Hooke’s law, i.e. F = K(ΔS – ΔD). The force sensitivity depends on the constant K, and the maximum attainable in practice is around 10 nN. At points where the slope of the force vs. distance curve, dF/dD, is larger than K, the spring-based SFA setup is mechanically unstable, and the surfaces spontaneously jump to the next stable position.
Because of the large radius R, the measured forces in the SFA cumulate the contribution of many molecules. The mica sheets are glued onto the cylindrical lenses using a deformable polymer adhesive so that flattening of the surfaces is seen in contact under strong attractive or repulsive forces [Citation18]. As a result, the average pressure is a few MPa at a force of a few mN, and even at large forces, the pressure rarely approaches 20 MPa. Experiments with the SFA can be done quite slowly (hours) to approach equilibrium conditions, whereas fast approaches and separation may show hydrodynamic effects [Citation19]. SFA measurements of dynamic (non-equilibrium) surface forces in thin LC films confined between solid surfaces, including viscous forces and friction, can be found in refs [Citation19–26].
Muscovite mica is a layered aluminosilicate crystal that can be cleaved into micron-thick sheets that expose the (001) crystal plane. The sheets are optically biaxial but can be approximated as positive uniaxial layers with the optic axis γ lying in the cleavage plane and an optical birefringence of the order of 0.005 () [Citation27]. The structure of the cleavage plane has been thoroughly studied [Citation28,Citation29] and induces planar alignment of many common thermotropic LCs, including 5CB, 8CB, and E7 alkyl-cyanophenyls [Citation27,Citation30]. Due to its smoothness, transparency, and LC alignment, mica is particularly suited for SFA experiments on nanoconfined LCs. The planar easy axis, however, makes an angle σ with the optic axis γ that depends on the particular crystal plane exposed by the cleavage process and cannot be determined before creating the mica-LC interface. Cyanophenyl-based LCs, for instance, alternate between σ = 30° and σ = −30° across the layered crystal structure [Citation27], and the sign of σ is randomly chosen during cleavage. The mica surface can also be modified through self-assembly of surfactant monolayers or polymer deposition to obtain different types of anchoring [Citation31].
2.2. Multiple-beam interference (MBI) studies of LC films
The SFA technique utilises MBI to determine the thickness of the mica surfaces, separation distance D, and curvature radius R [Citation32]. The back side of the mica surfaces is coated with a thin (30–60 nm) partially reflective silver layer. The surfaces are illuminated under normal incidence using white light collimated from a bright halogen source, arc lamp, or light-emitting diode (LED). The transmitted light intensity I is collected through a narrow entrance slit into an imaging spectrograph for analysis of the MBI fringes created by multiple reflections and interference between the silver mirrors (). The spectrograph is able to resolve the intensity I as a function of both the wavelength λ and position r along the slit. The image created by the spectrograph is recorded using a high-sensitivity and high-resolution camera such that each pixel represents the intensity I measured at different values of λ and r. The beam transmitted by the surfaces is aligned and focused on the spectrograph slit so as to centre the surface contact position on the entrance slit. Therefore, the camera image represents a linear section of the beam parallel to the slit and containing the contact position () [Citation33]
Figure 3. Examples of FECOs created by an LC in the SFA optical cavity. λ and r are the optical wavelength and lateral distance from the contact position (dashed line), respectively. At each position r, the LC birefringence creates a resonance doublet with wavelengths λ1 and λ2 that increase almost proportionally with the film thickness. In this example, a defect loop with radius rd (indicated with yellow solid lines) in a cholesteric LC annihilates at the contact position as the surfaces are separated going from figure a to C. n is the number of helical half-turns (π-rotations) at the contact. Reprinted from [Citation33].
![Figure 3. Examples of FECOs created by an LC in the SFA optical cavity. λ and r are the optical wavelength and lateral distance from the contact position (dashed line), respectively. At each position r, the LC birefringence creates a resonance doublet with wavelengths λ1 and λ2 that increase almost proportionally with the film thickness. In this example, a defect loop with radius rd (indicated with yellow solid lines) in a cholesteric LC annihilates at the contact position as the surfaces are separated going from figure a to C. n is the number of helical half-turns (π-rotations) at the contact. Reprinted from [Citation33].](/cms/asset/a2310183-5fa8-4830-989f-bd138aee788b/tlct_a_2358443_f0003_oc.jpg)
MBI generates multiple optical resonances for light waves undergoing constructive interference, each with a different chromatic order q (also known as mode order). Therefore, the SFA confinement cell can be viewed as a curved multilayer Fabry-Perot cavity with crossed-cylindrical mirrors. Because the resonance wavelength λq of order q varies continuously as a function of the cavity thickness h, the imaging spectrograph shows resonances as bright fringes of equal chromatic order (FECOs) in the two-dimensional measurements of I as a function of λ and r. Namely, the resonance wavelength λq has an approximately linear dependence on the cavity thickness h, which varies parabolically as a function of r (EquationEq. (1)(1)
(1) ) in the SFA crossed-cylinder geometry (). Therefore, FECOs appear as parabolae centred at the contact position (r = 0) in the spectrograph ().
MBI also depends on and can be used to measure the refractive index of the confined material, providing additional information on the material structure and confinement-induced transitions in films as thin as a few nm [Citation34,Citation35], providing a key advantage for the study of LCs. The optical birefringence of mica, however, splits the cavity resonances in doublets and complicates the MBI analysis (). Even when the confined film is isotropic, there are two resonant wavelengths for each order q, with orthogonal polarisations. The wavelength splitting can be used to measure the angle ψ between the optic axes of the two mica layers [Citation36].
When the confined film is an LC, the wavelength splitting also depends on the director alignment relative to the mica axes and distortions across the film [Citation11,Citation37]. shows an example of a cholesteric LC where a defect loop appeared in the FECOs around the contact position [Citation33]. The defect separated regions with different director twist that generated a different FECO splitting. The loop shrank and disappeared at the contact position as the surfaces were separated, and FECOs were used to directly visualise this process while also measuring the elastic surface forces (see section 6 on cholesterics below). FECO analysis can be performed using transfer matrix multiplication, e.g. by decomposing plane waves into four principal modes of propagation (i.e. forward or backward with defined polarisation) in each layer of the Fabry-Perot cavity [Citation38–40].
2.3. Colloidal-probe atomic force microscope (AFM)
In AFM, forces between surfaces are measured by monitoring the deflection of a soft cantilever carrying a tip with a radius of curvature (5–200) nm, probing the interaction with a macroscopic surface [Citation41,Citation42]. Force measurements and imaging can be done in a vacuum, air, controlled vapour, or liquid. In commercial AFMs, the cantilever deflection is usually determined by reflecting a laser beam off its end, as shown in . The spring constant of the cantilever can be determined from its resonance frequency and dimensions [Citation43,Citation44], and it can be as low as 0.01 N/m, enabling measurements of forces down to 1 pN. The tip-surface distance D is varied using a piezoelectric element and is measured indirectly by assuming that D does not change when the surfaces are in direct contact under a sufficiently large compressive force F. Although changes in the distance D can be measured with a sensitivity of 0.1 nm, the absolute value may not be directly measurable.
Since the tip radius is small, the force measured by the AFM is due to a relatively small number of molecules compared to SFA measurements. The pressure in the tip–surface contact region is typically of the order of 1 GPa because of the small contact area, which may cause the deformation of soft materials and films. In contrast with the SFA, the cantilever is typically displaced at a speed of (10–100) nm/s, whereas measurements at lower speeds are typically affected by drift of the piezoelectric control elements. Therefore, AFM can acquire many force curves in a short time but may be unsuitable to perform near-equilibrium measurements on systems with a long relaxation time. On the other hand, temperature control has been implemented on the AFM setup with better accuracy than with the SFA, allowing precise measurements at or very close to LC phase transitions [Citation45].
The small tip can be replaced with a micrometre-sized particle, often a sphere, of any material of interest to create the so-called colloid-probe AFM [Citation43,Citation46]. This method allows for investigations of weak interaction forces and studies of micrometre-sized interaction areas.
3. Short-range forces due to surface-induced order
3.1. Nematic surface ordering
Surface anchoring emerges at the macroscopic scale from anisotropic molecular interactions at LC interfaces. Although anchoring is of fundamental importance in LC technology and has been studied for decades, the connection between the molecular and macroscopic scales is still unclear. Consider, in particular, the planar alignment of common LCs such as 5CB, 8CB, or E7 on muscovite mica [Citation30,Citation47]. Second-harmonic generation studies have shown that the molecules in direct contact with the surface are oriented differently from in the bulk, i.e. the orientation distribution function does not have the symmetry of the LC phase [Citation48–50]. Moreover, it has long been debated whether LC molecules beyond this surface layer are oriented towards the easy axis by contact interactions with other LC molecules or by a van der Waals torque created by the surfaces [Citation51,Citation52]. Furthermore, smooth surfaces generally induce positional order along the surface normal (see section 3.2), and anisotropic crystal surfaces such as graphite, molybdenite, and mica can create in-plane order [Citation53]. In this scenario, force measurements provide invaluable insights into the effect of the surfaces on the LC structure and response.
Surface-induced nematic order in the isotropic phase of an LC material was first predicted by Sheng using the Landau-De Gennes phenomenological theory [Citation54,Citation55] and then demonstrated experimentally using ellipsometry [Citation56]. Confinement of the isotropic LC phase between surfaces inducing nematic order has been studied theoretically by Sluckin and coworkers [Citation57] and by Žumer and coworkers [Citation58]. Short-ranged nanoscale forces due to surface ordering were measured for the first time by Muševič and co-workers using colloidal-probe AFM () [Citation59]. To understand how surface ordering generates surface forces, consider two flat parallel surfaces at a distance D apart inducing nematic order. In the isotropic phase of an LC, the molecules tend to align along the surface easy axis, e.g. the surface normal z, with an orientational order parameter s0. The free energy density in the film can be written as:
Figure 4. AFM measurements of the normal force F as a function of the surface separation distance D in the isotropic phase of 5CB confined between a spherical glass probe with radius R ≈5 μm and a glass slide, both coated with DMOAP. TNI is the nematic-isotropic transition temperature. The dashed and solid lines are the van der Waals attraction and the total theoretical force, respectively. Reprinted figure with permission from [Citation59]. Copyright 2001 by the American Physical Society.
![Figure 4. AFM measurements of the normal force F as a function of the surface separation distance D in the isotropic phase of 5CB confined between a spherical glass probe with radius R ≈5 μm and a glass slide, both coated with DMOAP. TNI is the nematic-isotropic transition temperature. The dashed and solid lines are the van der Waals attraction and the total theoretical force, respectively. Reprinted figure with permission from [Citation59]. Copyright 2001 by the American Physical Society.](/cms/asset/7fcb0427-cc81-4610-8691-9d37f3d274f6/tlct_a_2358443_f0004_b.gif)
where s is the nematic order parameter induced by the surfaces. The first term is the second-order expansion of the free energy density of a uniform nematic as a function of s. Note that s is supposed to be small and a is positive in the isotropic phase, although a may become negative as the LC undergoes a phase transition to the bulk nematic phase. The second term is the energy density required to sustain order gradients along the surface normal. The nematic order extends from the surfaces over a distance of the order of the correlation length ξ = (c/|a|)1/2. In the isotropic phase and far from the nematic-isotropic transition (if present), the correlation length ξ = (c/|a|)1/2 is comparable to the nanoscale range of intermolecular interactions. Minimisation of the free energy density f with respect to s gives the Euler-Lagrange (EL) equation d2s/dz2 = s/ξ2. If the surfaces induce a fixed order s0, the solution of the EL equation is s = smcosh(z/ξ), where z = 0 is the midpoint between the surfaces and sm = s0/cosh(D/2ξ) is the order at this point. Therefore, the order sm is zero when the surfaces are much farther apart than the correlation length, i.e. D >> ξ. On the other hand, sm increases when the surfaces are approached to less than the correlation length ξ so that the order produced by one surface reaches the other surface. Integration of the free energy density f across the film thickness D gives a thickness-dependent free energy per unit area [Citation59]:
This energy decreases when the distance D decreases, because approaching the surfaces reduces the gradients of order across the film thickness. Therefore, an attractive force is expected when the surfaces are approached, with a range increasing as the correlation length ξ increases.
In SFA and colloidal-probe AFM measurements, the Derjaguin approximation (EquationEq. (2)(2)
(2) ) can be used to calculate the surface force because the length ξ is in the nanoscale range, the surface radius is R >> ξ, and the surfaces only interact when D ≤2ξ. shows the surface force measured with colloidal-probe AFM between two glass surfaces coated with a monolayer of the silane surfactant N;N-dimethyl-N-octadecyl-3-aminopropyltrimethoxysilyl chloride (DMOAP). The surfaces induce homeotropic anchoring and produce the expected attractive force in the isotropic phase of the cyanobiphenyl 5CB. The experimental results agree with the model force calculated using the phenomenological theory, although slightly modified to allow the surface order to vary from the value s0 preferred by the surfaces [Citation59]. As a result, both the range and amplitude of the attractive force increase as the temperature decreases (). The attractive forces produced by nematic order gradients are weaker than the attractive van der Waals attraction between the surfactant-coated glass surfaces and require an accurate temperature control to be detected in a narrow range above the isotropic-nematic transition [Citation45].
In general, surfaces can induce a certain degree of order even when the phase exhibits the same type of order. For instance, refractive index measurements in nematic 5CB films confined between mica surfaces to a thickness of a few nm suggested that the surfaces induced a higher degree of orientational order than in the bulk nematic phase, in addition to inducing planar anchoring [Citation60]. The surfaces can also depress the bulk phase by inducing a lower degree of order, although this phenomenon has not yet been observed in surface force measurements on nematics.
3.2. Surface-induced positional order
Early computer simulations suggested that liquids near or confined between smooth solid surfaces would be forced to adopt a different positional order from that in the bulk [Citation61–63], and this would result in an oscillatory surface force. The first direct experimental confirmation came through SFA force measurement on a non-polar, near-spherical molecule, octamethylcyclotetrasiloxane (OMCTS) [Citation64], and similar observations were later made for linear alkanes. Soon after, layering was observed in the nematic phase of 5CB confined between two mica surfaces coated with a monolayer of hexadecyltrimethylammonium bromide (CTAB), inducing homeotropic anchoring [Citation60]. The layers were parallel to the surfaces, and the force oscillations had a period of d0 = 2.5 nm, matching the length of one LC molecule. Therefore, the molecules aligned perpendicular to the layers, creating a structure similar to the smectic-A phase. Similar results were obtained in the isotropic phase of 8CB, also showing a smectic-A at lower temperatures [Citation65], and in the isotropic and nematic phases of water-surfactant solutions, showing a lamellar phase [Citation66–68] (). Moreover, X-ray scattering studies revealed a smectic-A-like layering at the free interface of isotropic 12CB, an LC that shows direct isotropic-smectic-A transition [Citation69].
Figure 5. Oscillatory force-distance curves measured under homeotropic anchoring conditions. (a) Nematic phase of a 37-wt.% CsPFO-water solution between mica surfaces, studied with the SFA. ξ is the correlation length of the surface-induced positional order. The solid line represents the theoretical curve (EquationEq. 6(6)
(6) ). Reprinted figure with permission from [Citation67]. Copyright 1996 by the American Physical Society. (b) Isotropic 8CB between two DMOAP-coated glass surfaces, studied with colloidal-probe AFM. Reprinted figure with permission from [Citation65]. Copyright 2000 by the American Physical Society.
![Figure 5. Oscillatory force-distance curves measured under homeotropic anchoring conditions. (a) Nematic phase of a 37-wt.% CsPFO-water solution between mica surfaces, studied with the SFA. ξ is the correlation length of the surface-induced positional order. The solid line represents the theoretical curve (EquationEq. 6(6) G=aξψ02tanh(D/2ξ)−1+1−cos(ε)sin(D/ξ)(6) ). Reprinted figure with permission from [Citation67]. Copyright 1996 by the American Physical Society. (b) Isotropic 8CB between two DMOAP-coated glass surfaces, studied with colloidal-probe AFM. Reprinted figure with permission from [Citation65]. Copyright 2000 by the American Physical Society.](/cms/asset/0c246663-4d22-4c7b-8cd0-9aae0b0116a4/tlct_a_2358443_f0005_b.gif)
Surface layering, however, does not necessarily reflect the structure of the smectic phases that may be present in the LC phase sequence. Indeed, SFA confinement of 5CB and 8CB under planar anchoring conditions produced oscillatory forces with a period d0 = 0.5 nm or d0 = 0.9 nm corresponding to the cross-sectional diameter of one molecule and one dimer, respectively [Citation19,Citation60]. Therefore, the molecules were parallel to the layers and created a structure very different from the smectic-A phase. These observations formed the basis for further studies of confined LCs (mainly cyanobiphenyls), such as the effects of shear on molecular orientation and positional order [Citation19,Citation23,Citation24], effects of humidity and other vapours, typically affecting the anchoring [Citation23,Citation70], and effects of the relative orientation of the confining mica surfaces [Citation26,Citation70].
Figure 6. Oscillatory force-distance curves obtained by confining a nematic between mica surfaces that induced twisted planar anchoring. (a) Measurements in 5CB. The insert shows the peak-to-peak amplitude of the oscillations. Reproduced with permission from ref [Citation60]. (b) Layering in the nematic phase of dimeric 8CB. Open and filled symbols indicate surface approach and retraction, respectively. The confined structure is shown schematically in (c). Adapted with permission from [Citation19]. Copyright 1996 American Chemical Society.
![Figure 6. Oscillatory force-distance curves obtained by confining a nematic between mica surfaces that induced twisted planar anchoring. (a) Measurements in 5CB. The insert shows the peak-to-peak amplitude of the oscillations. Reproduced with permission from ref [Citation60]. (b) Layering in the nematic phase of dimeric 8CB. Open and filled symbols indicate surface approach and retraction, respectively. The confined structure is shown schematically in (c). Adapted with permission from [Citation19]. Copyright 1996 American Chemical Society.](/cms/asset/05036f07-2da4-45a8-b192-f7d9bedda661/tlct_a_2358443_f0006_b.gif)
SFA experiments also highlighted the role of different surfactant layers deposited on the confining mica surfaces to induce layering under homeotropic anchoring. Between close-packed, Langmuir–Blodgett-deposited monolayers of cadmium arachidate, nematic 8CB dimers were found to order out to film thicknesses of about 50 nm, and the last confined layer was removed at a quite high force of 100 mN/m [Citation19]. Self-assembled monolayers of the loosely-packed surfactant DHDAA (dihexadecyldimethylammonium acetate) allowed partial penetration of the 8CB dimers. As a result, the last confined 8CB layer had a different apparent thickness than in the case of cadmium arachidate, and was not removed even at forces of over 200 mN/m [Citation19]. Ordering under confinement was observed out to film thicknesses of about 20 nm. The strong attachment of the 8CB to the DHDAA surfaces was also apparent in friction experiments at small film thicknesses [Citation19].
From the point of view of theory, surface layering can be described phenomenologically by introducing a complex order parameter Ψ = ψeiϕ for the positional order. The molecular density has an amplitude ψ and a phase ϕ that is maximum on a set of surfaces commonly called layers [Citation2]. The phase gradient ∇ϕ is parallel to the layer normal, and the modulus |∇ϕ| = 2π/d is related to the layer spacing of thickness d.
Consider two flat parallel interfaces at a distance D apart inducing a fixed positional order Ψ0 with natural period d0. These strong boundary conditions imply that ϕ(D/2) = ϕ(–D/2) + 2πn, where the integer n is the number of layers between the surfaces [Citation71]. According to Landau-De Gennes theory, the free energy density can be written as [Citation71]:
The first term is the free energy of a uniform layered phase. The second term is the energy required to deform a layered structure with natural layer thickness d0. The quantity ξ in EquationEq. (5)(5)
(5) is the correlation length, and we note that a > 0 because the layered phase would not appear spontaneously in the absence of surfaces. The situation is similar to the one discussed for the surface-induced nematic order (EquationEq. (3)
(3)
(3) ). The order propagates from each surface over a distance of the order of ξ, and surface forces are expected when the surface distance is D ≤2ξ. EquationEquation (5)
(5)
(5) shows that the EL equation relative to ϕ is dϕ/dz − 2π/d0 = Γ/ψ2, where Γ is a constant. Therefore, the layers are more rigid and their thickness 2π(dϕ/dz)−1 is closer to the natural value d0 where the modulation amplitude ψ is larger. Integration of the coupled EL equations relative to ψ and ϕ under has been carried out in refs [Citation66,Citation67,Citation71] under various boundary conditions. The free energy per unit area can be written as:
where ε = (D – nd0)/nd0 is the overall strain imposed on a stack of n layers. The first two terms in EquationEq. (6)(6)
(6) are similar to the first two terms in EquationEq. (4)
(4)
(4) for a nematic. They produce attraction, i.e. a reduction of free energy for a decreasing film thickness D, because this process reduces the order gradients. The last term in EquationEq. (6)
(6)
(6) introduces the repulsive oscillatory force characteristic of layered fluids. This force is zero when the surface distance D matches the natural thickness nd0 of the n layers and reaches a maximum for Dc = (n ± ½)d0. EquationEquation (6)
(6)
(6) also shows that the oscillation amplitude increases as D/ξ decreases. Moreover, it can be shown that the amplitude ψ at the midpoint between the surfaces decreases when n layers are compressed and vanishes as the thickness reaches the critical value Dc [Citation66,Citation67,Citation71]. Further compression reduces the number of layers to n − 1, i.e. the central layer melts as the compressive stress drives the transition from n to n − 1 layers. The reverse transition from n to n +1 is observed by retracting the surfaces from each other. In contrast, layering transitions in a spontaneously layered material proceed through the nucleation of dislocation loops, as discussed in section 5 for the smectic-A LC phase.
SFA and AFM measurements of the oscillatory force due to surface layering are in remarkable agreement with theoretical predictions (EquationEq. (6)(6)
(6) ) obtained for fixed boundary conditions using the Derjaguin approximation (EquationEq. (2)
(2)
(2) ). In fact, these techniques are particularly suited to measure surface layering and other 1d-periodic structures, such as cholesteric, smectic-A, and lamellar mesophases, with periods from a few nm to 100 nm that are too small to be studied using optical wavelengths and too large for most x-ray and neutron scattering techniques such as SAXS.
3.3. Capillary condensation
The idea of condensing the nematic phase by confinement from the isotropic phase near the nematic-isotropic transition was first considered by Sheng [Citation54,Citation55] and further developed by Sluckin and coworkers [Citation57] and by Žumer and coworkers [Citation58], who highlighted the analogies with Kelvin theory of capillary condensation in isotropic fluids [Citation10]. Theoretical predictions were validated through a series of force measurements conducted with the colloidal-probe AFM by Muševič and co-workers [Citation72,Citation73] (). The phenomenological theory develops from the same equation predicting ‘prenematic’ ordering under confinement (EquationEq. (3)(3)
(3) ). At the nematic-isotropic transition, however, the correlation length ξ diverges, i.e. the constant a vanishes and the free energy density must be expanded to include higher powers of the nematic order parameter s. Between flat parallel surfaces, capillary condensation is expected below a film thickness that diverges as the temperature approaches the nematic-isotropic transition () [Citation72,Citation73]. Moreover, capillary condensation is a discontinuous first-order transition that ends at a critical point at high temperatures, i.e. evolves into a continuous second-order transition.
Figure 7. (a) Colloidal-probe AFM measurements of the normal force F measured for isotropic 5CB confined between a colloidal probe with radius R ≈10 μm and a glass substrate at a distance D apart. The probe and substrate were coated with DMOAP to induce homeotropic anchoring. (b) Distance-temperature phase diagram showing capillary condensation as an isotropic-nematic transition line ending in a critical point. Reprinted figure with permission from [Citation72]. Copyright 2001 by the American Physical Society.
![Figure 7. (a) Colloidal-probe AFM measurements of the normal force F measured for isotropic 5CB confined between a colloidal probe with radius R ≈10 μm and a glass substrate at a distance D apart. The probe and substrate were coated with DMOAP to induce homeotropic anchoring. (b) Distance-temperature phase diagram showing capillary condensation as an isotropic-nematic transition line ending in a critical point. Reprinted figure with permission from [Citation72]. Copyright 2001 by the American Physical Society.](/cms/asset/232ac86d-8b21-4f03-b7e6-68655660550d/tlct_a_2358443_f0007_b.gif)
Capillary condensation is a general phenomenon occurring in the vicinity of a phase transition, and it is not limited to thermotropic LCs. Indeed, Kočevar et al. observed the capillary condensation of a smectic-A capillary bridge between surfaces immersed in the isotropic phase of 12CB [Citation74]. Moreover, Richetti and co-workers observed capillary condensation of the lamellar phase (Lα) from the sponge phase (L3) in an aqueous mixture of two surfactants as a function of the surface distance D, temperature, and surfactant weight ratio [Citation75].
4. Elastic forces in the nematic phase
The elastic theory of the nematic phase is a cornerstone of LC physics and the starting point of LC device engineering. Force-measuring techniques such as the SFA and AFM have provided decisive insights into the validity of the elastic theory at the nanoscale. Intriguingly, some of the most basic predictions of the elastic theory eluded direct experimental validation due to interference with other effects caused by surface interactions.
4.1. Twisted planar anchoring conditions
Confinement under twisted planar anchoring conditions provides the simplest example of elastic force generation by an LC film. The optomechanical response of an LC film can be tested in the SFA using the planar anchoring on mica (), whereas it is generally not possible to measure and control the twist angle in colloidal-probe AFM.
Suppose that the surfaces are parallel, homogenous, and separated by a film thickness D, and that they induce equally strong anchoring along two directions (easy axes) forming an acute angle Ψ0. We call z the surface normal and x the bisector of Ψ0, and place the origin at the midpoint between the surfaces. In the absence of any aligning field along the z-axis, the director can be written as n = (nx, ny, nz) = [cosφ(z), sinφ(z), 0], where φ is the azimuthal angle in the surface plane. We call ψ± = ±Ψ0/2 the angle from the x-axis to the easy axis at z =±D/2, respectively, and φ± the angle from the x-axis to the surface director. The surface director is allowed to deviate from the easy axis by the angle δ± = φ± – ψ±. The twist free-energy density is f = (Kt/2)(dφ/dz)2, where Kt is the twist elastic constant. The EL equation for φ is d2φ/dz2 = 0, implying that the director is either uniformly twisted by an angle Φ = φ+ – φ– or uniformly planar (Φ = 0) across the film thickness D. The free energy G per unit area of the film can be written as:
where W is the azimuthal strength of the Rapini-Papoular anchoring potential (last two terms in EquationEq. (7)(7)
(7) ), and L = Kt/W is the anchoring extrapolation length [Citation2,Citation76]. Due to symmetry, the surface director angles must satisfy φ– = –φ+ = Φ/2, and the energy G can be expressed as:
Minimisation with respect to Φ requires the twist to be between zero and Ψ0, namely:
EquationEquation (9)(9)
(9) shows that the LC is almost uniform (Φ ≈ 0) for small thicknesses D << L, violating the anchoring conditions by the angle δ± = ∓Ψ0/2. On the other hand, the twist Φ can increase to values close to Ψ0 and almost completely match the anchoring conditions when D >> L. Therefore, anchoring conditions should be regarded as strong or weak depending on the D/L ratio rather than the anchoring strength W. In the SFA geometry, the surface force is expected to follow the Derjaguin approximation F ≈2πRG (EquationEq. (2)
(2)
(2) ) [Citation10] and scale as:
for large thicknesses D >> L. This repulsive force is the elastic response to the mechanical confinement of the distorted LC film. As the thickness D decreases below the extrapolation length L, the force increases less rapidly than D−1, reaching the finite value Fmax = Wsin2(Ψ0/2) for D = 0, i.e. when the director becomes uniform.
Various SFA studies have measured the elastic forces generated by cyanophenyl LCs confined between mica surfaces that induced twisted planar anchoring conditions [Citation23,Citation24,Citation26,Citation37,Citation60,Citation70,Citation77]. For large mica-mica separation distances D > 20 nm, the normal force F was found to increase monotonically as D decreased, as expected from EquationEq. (7)(7)
(7) (). For distances smaller than 10 nm, the force-distance curves showed the layering oscillations discussed in the previous sections (), with some dependence on the angle Ψ0 [Citation26]. Surprisingly, the SFA experiments did not show the force plateau due to finite anchoring strength at surface distances D << L. Supposing that the plateau was masked by the force oscillations, the anchoring extrapolation length was L ≤10 nm. Considering a twist constant Kt = 3.2 pN for 5CB [Citation78], the anchoring strength was Wφ ≥ 0.3 mJ/m2. Therefore, the azimuthal anchoring of 5CB on mica is stronger than on the materials commonly used to create planar anchoring, such as polyvinyl alcohol (PVA) or polyimide (PI) [Citation47].
Figure 8. Force-distance curves obtained with the SFA for nematic 5CB confined between two mica surfaces, inducing twisted planar anchoring conditions, or two CTAB-coated mica surfaces, inducing homeotropic anchoring. R ≈2 cm is the surface radius of curvature. ψ is the angle between the slow optic axes of the mica surfaces (see ). The thick red line is the theoretical elastic force obtained from EquationEq. 10(10)
(10) with Ψ0 = 90° and Kt = 3.2 pN [Citation78]. Adapted with permission from [Citation77]. Copyright 2012 American Chemical Society.
![Figure 8. Force-distance curves obtained with the SFA for nematic 5CB confined between two mica surfaces, inducing twisted planar anchoring conditions, or two CTAB-coated mica surfaces, inducing homeotropic anchoring. R ≈2 cm is the surface radius of curvature. ψ is the angle between the slow optic axes of the mica surfaces (see Figure 2(b)). The thick red line is the theoretical elastic force obtained from EquationEq. 10(10) F/R =πKtΨ02/D(10) with Ψ0 = 90° and Kt = 3.2 pN [Citation78]. Adapted with permission from [Citation77]. Copyright 2012 American Chemical Society.](/cms/asset/6d78cdb0-b179-486c-b36f-a698b998c009/tlct_a_2358443_f0008_oc.jpg)
Although the force measured for large thicknesses agrees qualitatively with the theoretical elastic force (EquationEq. (10)(10)
(10) ), various experimental limitations have hindered a quantitative analysis. First, most SFA experiments only determined the twist angle ψ between γ axes (). On each mica surface, however, the planar anchoring direction makes an angle ± σ with the slow optical axis (e.g. σ = 30° for 5CB), where the sign alternates across the layers of the mica structure [Citation36,Citation47]. Because these layers are randomly selected by the cleavage process, the twist imposed by two cleaved surfaces can be Ψ0 = ψ, Ψ0 = ψ + 2σ, or Ψ0 = ψ − 2σ. Although Ψ0 can be determined from the analysis of FECOs after creating the LC-mica interfaces [Citation11,Citation36,Citation37,Citation77], most SFA studies assumed Ψ0 = ψ and could not accurately verify the relation between the force F and the imposed twist Ψ0 predicted by EquationEq. (10)
(10)
(10) . Second, the normalised elastic force F/R generated by an LC film can be higher than the 0.1 mN/m sensitivity at surface distances D as large as 200 nm (e.g. thick red line in ). The elastic force, however, varies slowly with D and is difficult to distinguish from the linear background that is subtracted from the force vs. distance curves in SFA experiments. Third, the surface curvature slightly modifies the anchoring conditions as a function of the lateral distance r from the contact position (). For instance, two surfaces inducing homeotropic anchoring and uniform director at the contact position can produce a weak but long-ranged elastic force [Citation79]. Fourth, common LCs such as cyanophenyls contain ionic impurities that can generate electrostatic repulsion between equal surfaces [Citation80,Citation81]. These forces were generally not considered in the analysis of the SFA force measurements. In light of these considerations, SFA measurements could be improved to provide a more quantitive validation of theoretical expectations.
4.2. Hybrid anchoring conditions
Consider a nematic film confined between two parallel surfaces, one inducing planar and the other homeotropic anchoring, as in . The director can be written as n = (nx, ny, nz) = [sinθ(z), 0, cosθ(z)], where the x-axis is the planar anchoring direction and θ is the zenithal angle measured from the surface normal z. In the one-elastic-constant approximation, the elastic free energy density is f = (K/2)(dθ/dz)2, where K is an average splay-bend constant. The EL equilibrium condition d2θ/dz2 = 0 implies that the director either is uniform or rotates uniformly across the LC film, creating a splay-bend distortion. The free energy per unit area is:
Figure 9. (a) Director configurations for a nematic LC film confined under hybrid homeotropic-planar anchoring conditions. The ellipses represent the tensor ellipsoid in the plane of the anchoring directions. (b-c) SFA measurements of the normal force F as a function of the surface separation distance D for nematic 5CB confined between one CTAB-coated and one uncoated mica surface. The Inset in (b) shows oscillations with a period d_0 about 0.5 nm due to planar layering. The red triangles in (c) indicate points of maximum force from where the surfaces jumped into adhesive contact and reached a distance D of about 1 nm. (a,b) Adapted with permission from [Citation35,Citation77]. Copyright 2012 American Chemical Society. (c) Reprinted figure with permission from [Citation35]. Copyright 2005 by the American Physical Society. (d) AFM force-distance measurement for 5CB confined between a mica surface and a DMOAP-coated colloidal probe. The solid line fits the elastic curve for the director rotation model, whereas the dashed line is calculated using the Landau-De Gennes tensor model. Reprinted figure with permission from [Citation93]. Copyright 2009 by the American Physical Society.
![Figure 9. (a) Director configurations for a nematic LC film confined under hybrid homeotropic-planar anchoring conditions. The ellipses represent the tensor ellipsoid in the plane of the anchoring directions. (b-c) SFA measurements of the normal force F as a function of the surface separation distance D for nematic 5CB confined between one CTAB-coated and one uncoated mica surface. The Inset in (b) shows oscillations with a period d_0 about 0.5 nm due to planar layering. The red triangles in (c) indicate points of maximum force from where the surfaces jumped into adhesive contact and reached a distance D of about 1 nm. (a,b) Adapted with permission from [Citation35,Citation77]. Copyright 2012 American Chemical Society. (c) Reprinted figure with permission from [Citation35]. Copyright 2005 by the American Physical Society. (d) AFM force-distance measurement for 5CB confined between a mica surface and a DMOAP-coated colloidal probe. The solid line fits the elastic curve for the director rotation model, whereas the dashed line is calculated using the Landau-De Gennes tensor model. Reprinted figure with permission from [Citation93]. Copyright 2009 by the American Physical Society.](/cms/asset/a3b2e8b2-2f83-4668-a706-ac7001a1d2a2/tlct_a_2358443_f0009_oc.jpg)
where θp and θh are the director angles at the surface inducing planar and homeotropic anchoring, respectively, and Wp and Wh are the zenithal anchoring strengths. Energy minimisation leads to:
where Lp,h = K/Wp,h are the anchoring extrapolation lengths. When Wp = Wh = W the azimuthal angle satisfies θh + θp = π/2 and the free energy can be written as G = (K/2)(π/2–2θp)2/D + Wsin2θp. Therefore, the elastic response is similar to that expected for twisted planar anchoring conditions (Ψ0 = π/2) with the extrapolation L = K/W, where θp is the deviation angle from the anchoring direction. When the anchoring strengths are different, say Wp > Wh, EquationEqs. (11)(11)
(11) and (Equation12
(12)
(12) ) predict an anchoring transition when the thickness decreases below the critical value Dc = Lh – Lp [Citation83]. Namely, the surface director satisfies the anchoring conditions for large film thicknesses D >> Lp,h but starts deviating from the homeotropic anchoring direction when the thickness reaches D ≈ Lh. When Dc > Lp, a smaller deviation from the planar anchoring direction may also develop when the thickness reaches D ≈ Lh. At the critical value Dc, the LC becomes uniformly oriented along the planar anchoring direction. Evidence of a confinement-induced transition involving a large violation of the anchoring conditions emerged as early as the late 1970s [Citation84,Citation85], and it was interpreted as an anchoring transition in later experiments [Citation86,Citation87].
In the SFA, the elastic force should scale as F/R =(π3/4)K/D for large thicknesses, where we have used the Derjaguin approximation and neglected second-order variations in the anchoring directions induced by surface curvature. As the film is compressed to a thickness D ≈ Lh, the elastic force should increase less rapidly than D−1 and eventually reach a finite maximum or a plateau. When Wh = Wp = W, the maximum force Fmax = Wsin2(π/4) is reached for D = 0, as already noted for the twisted planar case. When Wp > Wh, however, the force saturates to a plateau with value Fmax = Wh/2 at the critical thickness Dc, and does not change as the thickness is further decreased.
A force plateau Fmax = 0.5 mN/m was indeed observed at distances smaller than 50 nm by confining 5CB between a bare mica surface, inducing a strong planar anchoring, and another mica surface coated with a CTAB monolayer, inducing homeotropic anchoring () [Citation77]. Force oscillations with a period d0 ≈0.5 nm were observed at distances D < 5 nm, indicative of a layered structure with molecules parallel to the surfaces violating the homeotropic anchoring. Therefore, the zenithal anchoring strength was stronger on mica than on CTAB, i.e. Wp > Wh.
On the other hand, another type of structural transition may occur when the director is forced to rotate by as much as 90° across the nanoscale distances reached in SFA and AFM experiments. In elementary nematic disclinations, for instance, the director rotates by 90° across the nanoscale size of the defect core [Citation2]. Schopohl and Sluckin showed that a tensorial description of the nematic phase in the Landau-De Gennes theory allows exchanging the highest eigenvalue of the tensor order parameter between two perpendicular axes within the defect core, thereby creating a biaxial structure instead of rotating the director [Citation88]. The idea took hold in the theoretical study of hybridly aligned LC films [Citation89–93], predicting a structural transition from the splay-bend (director rotation) state to biaxial (eigenvalue exchange) state under nanoscale confinement (). This transition was first observed in SFA measurements on 5CB confined between mica and a CTAB-coated mica surface [Citation37] () and confirmed by colloidal-probe AFM using the silane surfactant DMOAP to obtain homeotropic anchoring on a glass colloid () [Citation82]. In both experiments, the force increased as the distance was decreased down to Dt ≈10 nm, in qualitative agreement with the theory of uniaxial nematic elasticity (EquationEqs. (11)(11)
(11) and Equation(12))
(12)
(12) . At smaller surface distances, however, the force rapidly decreased so that a maximum of (2–3) mJ/m2 was obtained at Dt ≈10 nm, followed by a jump into adhesive surface contact. The distance Dt at the maximum force compared well with the critical distance for the transition from the splay-bend director rotation to the eigenvalue-exchange biaxial state.
Interestingly, both the uniform and eigenvalue-exchange states were obtained using CTAB-coated mica surfaces in SFA experiments [Citation37,Citation77], indicating a high sensitivity of the homeotropic anchoring to the CTAB preparation method (compare ). Indeed, the anchoring strength critically depends on the CTAB surface density, e.g. the anchoring on CTAB-coated glass can become planar for sufficiently low surface densities [Citation94]. These findings reflect the different results obtained in the homeotropic layering of cyanobiphenyls on various surfactant monolayers (CTAB, cadmium arachidate, and DHDAA, see section 3.2).
We note that an eigenvalue-exchange state was also predicted under twisted planar anchoring conditions by using Landau-De Gennes tensor model [Citation95,Citation96] and molecular dynamics [Citation97]. This prediction has not yet been confirmed experimentally.
5. Elastic forces in the smectic-A and lamellar phases
The smectic-A is paradigmatic of layered materials where the spontaneous breaking of translational invariance creates a positional order. This class of materials also includes lamellar phases in surfactant solutions and block copolymers and provides the background to understand the nanomechanical response of other non-layered 1d-periodic materials, such as spontaneously twisted cholesterics, discussed in the section 6. In the smectic-A phase, the LC molecules tend to align parallel to each other along the director n and, simultaneously, to modulate the density along n with a period d0 comparable to one molecular length.
Surface forces due to layer compression and dilation were first measured by Horn and Israelachvili in the smectic-A phase 8CB [Citation60] and later by Kékicheff, Richetti, and co-workers in the lamellar phase of water mixtures containing sodium dodecyl sulphate (SDS) and pentanol [Citation98,Citation99], or caesium perfluoro-octanoate (CsPFO) [Citation66]. The force-distance curves showed oscillations with minima periodically spaced by one layer thickness d0 and maxima slowly decaying with the surface distance D ().
Figure 10. (a) Force-distance curve measured with the SFA for the lamellar phase of SDS [Citation98,Citation99]. Black and white circles indicate surface approach and retraction, respectively. (b) Enlarged view of the force-distance curve in (a). Arrows indicate jumps over mechanically unstable regions. Adapted with permission from [Citation98]. Copyright 1991 American Chemical Society. (c) Force-distance curve obtained with colloidal-probe AFM on smectic 8CB. The arrows indicate the direction of surface motion. (d) Surface distances Dmin = hn and Dmax= hc,n corresponding to force minima and maxima in figure (c). The linear fit gives a smectic layer thickness of a = (3.2 ± 0.8) nm. Reprinted figures with permission from [Citation100]. Copyright 2011 by the American Physical Society.
![Figure 10. (a) Force-distance curve measured with the SFA for the lamellar phase of SDS [Citation98,Citation99]. Black and white circles indicate surface approach and retraction, respectively. (b) Enlarged view of the force-distance curve in (a). Arrows indicate jumps over mechanically unstable regions. Adapted with permission from [Citation98]. Copyright 1991 American Chemical Society. (c) Force-distance curve obtained with colloidal-probe AFM on smectic 8CB. The arrows indicate the direction of surface motion. (d) Surface distances Dmin = hn and Dmax= hc,n corresponding to force minima and maxima in figure (c). The linear fit gives a smectic layer thickness of a = (3.2 ± 0.8) nm. Reprinted figures with permission from [Citation100]. Copyright 2011 by the American Physical Society.](/cms/asset/451a4fcf-6d98-489f-8cb0-93019b0d18b5/tlct_a_2358443_f0010_oc.jpg)
These oscillations obviously reflect the 1d-periodic structure of the smectic and lamellar phase, and the periodic minima can be used to accurately measure layer thicknesses d0 ranging from 0.1 nm to 100 nm (). Force oscillations, however, emerge from a complex interplay of bistability, topological defects, and energy barriers that may have a different outcome in other 1d-periodic LC phases such as cholesterics, twist-bend (heliconal) nematic, and ferroelectric smectics depending on the material parameters.
The essential elements of force generation in a 1d-periodic LC can be understood considering a smectic-A or lamellar phase confined between two flat parallel surfaces to a thickness h. Suppose that the surfaces force the layers to be parallel, e.g. because they impose a fixed positional order. The elastic free energy per unit area due to compression or dilation of the stack can be written as [Citation2]:
where B is the smectic layer compressibility modulus and n is the number of smectic layers in the film thickness h. EquationEquation (13)(13)
(13) shows that the free energy is zero for film thicknesses hn = nd0, i.e. when the film thickness matches the undeformed stack thickness. For any other thickness, the smectic phase is geometrically frustrated, i.e. its natural structure is incompatible with the boundary conditions. EquationEquation (13)
(13)
(13) also shows that G has two equal minima for the thicknesses hc,n = d0(n + 1/2) that are equally spaced from hn and hn + 1. This bistability allows thermal fluctuations to trigger layering transitions from n to n ± 1 layers in the smectic stack, i.e. addition or removal of one layer when the thickness h is increased or reduced, respectively.
Layering transitions entail the nucleation of elementary dislocation lines at the boundary between domains with n and n ±1 layers [Citation101,Citation102]. In the sphere-plane geometry of the SFA and colloidal-probe AFM, the transitions create an array of concentric dislocation loops with radius ri = [2 R(hi – D)]1/2, where R is the sphere radius and hi is the critical film thickness for the layering transition (). Note that hi is a priori different from hc,n. The loop with radius ri separates two domains with a number ni-1 and ni of layers, where ni = n0 + i, and n0 is the number of layers at the contact position. In the smectic case, the loops have nanoscopic cores and cannot be resolved by optical microscopes [Citation101,Citation103,Citation104]. On the other hand, loops are visible in the cholesteric phase (see section 6).
Figure 11. Array of concentric dislocation loops (T-symbols) in a 1d-periodic LC confined between a plane and a sphere of radius R at a distance D apart. r is the lateral distance from the centre of the contact position (r = 0). hn is the film thickness of an uncompressed stack of n layers and ri is the radius of the loop separating two regions with ni-1 and ni = n0 + i layers, where n0 is the number of layers at the contact position. (a) Top view along the plane normal z. (b) Side view across the rz plane. Adapted from ref [Citation33].
![Figure 11. Array of concentric dislocation loops (T-symbols) in a 1d-periodic LC confined between a plane and a sphere of radius R at a distance D apart. r is the lateral distance from the centre of the contact position (r = 0). hn is the film thickness of an uncompressed stack of n layers and ri is the radius of the loop separating two regions with ni-1 and ni = n0 + i layers, where n0 is the number of layers at the contact position. (a) Top view along the plane normal z. (b) Side view across the rz plane. Adapted from ref [Citation33].](/cms/asset/6128312f-f0c3-4f94-8bd8-357521bcc767/tlct_a_2358443_f0011_oc.jpg)
Dislocation loops are surrounded by a strain field decaying exponentially in the lateral direction r and have an energy 2πμri, where μ is the line tension due to the strain field and defect core [Citation2]. In SFA experiments with R ≈2 cm, the spacing between two consecutive dislocations is large enough to avoid overlap of the strain fields and direct interactions between dislocations. The LC film can be divided into an array of concentric tubular cells, each containing one dislocation loop, with inner and outer radius [2R(ni–1a – D)]1/2 and [2R(nia – D)]1/2, respectively, and index i > 0 (). The contact region is the central cell of the array with radius [2R(n0a – D)]1/2 and index i = 0. The central cell may have a dislocation or not, depending on the surface distance D. The tubular cells have the energy:
If the central cell does not contain a loop, it has the energy:
and if it contains a loop with radius r0 = [2R(h0a – D)]1/2, it has the energy:
Here, we consider the surface distance D and thicknesses hi as independent variables, whereas ri = r(hi). For a fixed surface distance D, the loop radius ri can be obtained from energy minimisation: ∂Ei/∂hi = (∂Ei/∂ri)(∂ri/∂hi) = (R/ri)(∂Ei/∂ri) = 0. The calculation shows that ri is smaller than the value rn = r(hn) corresponding to a double minimum in G (EquationEq. (13)(13)
(13) ), because the line tension shrinks the loop [Citation66]. Because ∂Ei/∂hi = 0, the normal force produced by a cell is dEi/dD = ∂Ei/∂D. Richetti et al. [Citation99] pointed out that only the central cell contributes to the force via layer dilation and compression. In the outer tubular cells, indeed, the layers are dilated from the thickness ni-1a to hi, and compressed from the thickness hi to nia. Dilation and compression create surface repulsion and attraction, respectively, balancing each other in the outer cells. The total normal force can be written as [Citation99]:
The first term is the Derjaguin relation, whereas the second term is due to line tension and varies slowly with the surface distance D. This second term was subtracted as a linear background from SFA and AFM force-distance measurements (). Using EquationEq. (13)(13)
(13) and (Equation17
(17)
(17) ), the compressibility modulus B can be calculated by fitting the theoretical free energy G(D, n0) to the measured force F(D), using a different value of n0 for each force oscillation (). The compressibility modulus was found to be B = 0.1 MPa in SFA experiments on lamellar SDS [Citation99] and B = 10 MPa in colloidal-probe AFM experiments on smectic 8CB [Citation100], in agreement with measurements obtained with other techniques [Citation105,Citation106].
As the surfaces are approached or retracted, the dislocation loops expand or shrink, respectively, and layering transitions can remove one layer from the contact position and create a new loop during the approach or add one layer by removing an existing loop during the retraction. To determine whether the central cell contains a loop with radius r0 or not, one should consider the energy difference between the two cases:
obtained by subtracting EquationEq. (15)(15)
(15) from EquationEq. (16)
(16)
(16) , where ΔG(h,n0) = G(h,n0 −1) – G(h,n0) is the difference in smectic deformation energy due to the removal of one layer. Homogeneous nucleation theory posits that loop nucleation occurs in the central cell when the nucleation energy EN has a negative minimum for a finite radius r0 that can grow from zero without hitting energy barriers higher than the Boltzmann energy kBT [Citation107]. SFA and AFM measurements on smectic-A and lamellar phases found the minima and maxima of force oscillations at surface distances D = hn and D = hc,n, respectively (). Therefore, the nucleation energy EN developed a negative minimum as soon as ΔG became negative, i.e. for D = hc,n, without any significant barrier to loop nucleation. We point out that this result is specific to the smectic-A and lamellar phases and does not hold in the cholesteric phase, as shown below.
6. Elastic forces in cholesterics
Cholesterics are periodically twisted (chiral) nematics with the helical axis perpendicular to the director n. Although cholesterics lack a modulation of molecular density, key aspects of their optomechanical response to confinement can be understood in analogy with other 1d-periodic material, including layered materials such as smectics and lamellar phases (discussed in the previous section) and chiral spin phases such as helimagnets [Citation108]. In particular, cholesterics naturally combine the nanomechanical response of nematics and smectics.
Confined cholesterics have been studied for over a century using cells known as Cano-Grandjean wedges [Citation2,Citation109–113]. The cholesteric adapts to the non-uniform cell thickness by adjusting the pitch of the helix, deviating from the surface anchoring conditions, and – most notably – nucleating a sequence of line defects perpendicular to the thickness gradient. These defects separate domains with a different number of helical half-turns and have a structure similar to a smectic dislocation, where half-turns play the role of the smectic layers [Citation114]. Recently, the SFA has introduced a dynamic control of the film thickness and defect nucleation as well as direct measurement of the cholesteric nanomechanical response [Citation33,Citation115,Citation116]. A key advantage of the SFA is that arrays of dislocation loops can be visualised using an optical microscope (), and the nucleation or removal of a loop in the contact region can be studied in detail using FECOs ().
Figure 12. (a) Top-view photograph of an array of dislocation loops in a cholesteric LC confined in the SFA sphere-plane geometry under twisted planar anchoring conditions using mica surfaces. The image was obtained between oblique polarisers. The symbols are explained in . (b) Time-resolved mechanical deformation of the loop array obtained from a sequence of top-view images. The light intensity transmitted along the y-axis of fig. (a) is shown as a function of time, creating a 2d image. The SFA surfaces were approached, left in contact, and then separated by displacing the cantilever at a speed of 3.3 nm/s. New loops with finite radii appeared (white squares and dots) and expanded during surface approach, whereas they shrank and disappeared (black dots) at the contact position (r = 0) during retraction. Adapted from [Citation33].
![Figure 12. (a) Top-view photograph of an array of dislocation loops in a cholesteric LC confined in the SFA sphere-plane geometry under twisted planar anchoring conditions using mica surfaces. The image was obtained between oblique polarisers. The symbols are explained in Figure 11. (b) Time-resolved mechanical deformation of the loop array obtained from a sequence of top-view images. The light intensity transmitted along the y-axis of fig. (a) is shown as a function of time, creating a 2d image. The SFA surfaces were approached, left in contact, and then separated by displacing the cantilever at a speed of 3.3 nm/s. New loops with finite radii appeared (white squares and dots) and expanded during surface approach, whereas they shrank and disappeared (black dots) at the contact position (r = 0) during retraction. Adapted from [Citation33].](/cms/asset/7cd758d9-a460-4fa9-ba05-d323efc1fdea/tlct_a_2358443_f0012_oc.jpg)
In a cholesteric film with twisted planar anchoring conditions, the helical axis is parallel to the surface normal z, and the free energy density is f = ½Kt(dϕ/dz – π/p)2, where p is half the pitch length. Note that p is positive or negative for a right-handed or left-handed cholesteric, respectively. The system has the same symmetry properties already studied for the nematic case, and the free energy per unit area can be written as [Citation115,Citation116]:
where Φ is the twist angle across the LC film thickness h, Ψn = Ψ0 + nπ is the twist angle that matches the planar anchoring conditions, and Ψ0 is the acute angle between the easy axes. This equation generalises the nematic case, which is obtained for small thicknesses h << p. To minimise the energy G, the twist Φ should be as close as possible to the value πh/p that matches the natural pitch, while Ψn should be as close as possible to Φ, and therefore to πh/p. The latter condition determines n as the number of helical half-turns (π-rotation) the director should make across the film thickness to match the anchoring conditions.
The free energy G shares two key features with that of a smectic (EquationEq. (13)(13)
(13) ). First, the free energy G is zero at the film thicknesses hn = pΨn such that the twist is Ψn = πhn/p, matching both the anchoring condition and the natural pitch. Second, it is possible to minimise G with two different twist angles Φa and Φb at a critical thickness hc,n, i.e. create bistability. EquationEquation (19)
(19)
(19) shows that these angles should be at an equal distance from the pitch-matching value πh/p and from two different anchoring-matching angles Ψn and Ψm. These conditions are satisfied for Ψm = Ψn + πn = Ψn + 1 at the thickness hc,n = pπ(Ψn/π + 1/2). Therefore, the cholesteric can undergo a discontinuous twist transition with jump length Φb – Φa at the thickness hc,n. The twist transition is equivalent to a layering transition where the number n of helical half-turns plays the role of the number of layers.
It is impossible to connect two twisted states differing by one half-turn, such as Φa and Φb, through a continuous director deformation, i.e. these states are topologically distinct [Citation112]. Instead, a topological defect line appears at the domain boundary, having the structure of a smectic dislocation line [Citation114]. In the sphere-plane geometry of the SFA, these lines appear as an array of concentric loops () similar to those expected for smectics (). The loops are also visible in the FECOs (), allowing the determination of the twist angles Φa and Φb [Citation11,Citation116].
SFA experiments on cyanophenyl-based cholesteric have revealed dramatic differences with smectics in the way loops expand and shrink as the surfaces are approached and retracted, respectively () [Citation33,Citation116]. Namely, the central loop could be greatly expanded during the approach until a new loop was nucleated, rapidly followed by more loops. In contrast, loops shrank linearly and disappeared periodically with the surface distance during retraction. The asymmetry also emerged in the force-distance curves, showing much larger forces during approach than during retraction (). In fact, the force reached exceptionally large values during surface approach, compared not only to the mechanical response of other LCs but also to soft materials in general, including the polymer layers used to stabilise colloidal dispersions [Citation10].
Figure 13. (a) Force-distance curves obtained for a cyanobiphenyl-based cholesteric LC using the SFA. White squares and circles indicate loop nucleation events observed in FECOs, whereas black circles indicate loop annihilation. Dotted lines are model curves obtained from Eqs 17 and 19 using a twist constant Kt = 17 pN, twist angles Φ = Ψn (strong anchoring), and a number n of half-turns in the central cell starting from n0. Adapted from [Citation33]. (b) Enlarged view of the small oscillatory forces measured during surface retraction. White circles indicate loop annihilation. The solid black line is the model curve obtained for a half-pitch p = 120 nm and anchoring extrapolation length L << p. Adapted from [Citation116].
![Figure 13. (a) Force-distance curves obtained for a cyanobiphenyl-based cholesteric LC using the SFA. White squares and circles indicate loop nucleation events observed in FECOs, whereas black circles indicate loop annihilation. Dotted lines are model curves obtained from Eqs 17 and 19 using a twist constant Kt = 17 pN, twist angles Φ = Ψn (strong anchoring), and a number n of half-turns in the central cell starting from n0. Adapted from [Citation33]. (b) Enlarged view of the small oscillatory forces measured during surface retraction. White circles indicate loop annihilation. The solid black line is the model curve obtained for a half-pitch p = 120 nm and anchoring extrapolation length L << p. Adapted from [Citation116].](/cms/asset/5bfc37a0-196b-49ad-a6bf-d8b8e44fa49e/tlct_a_2358443_f0013_oc.jpg)
The difference between smectics () and cholesterics () is caused by a large energy barrier due to the dislocation line tension μ. The energy for nucleating a new loop with radius ri can be calculated using EquationEq. (18)(18)
(18) , where now ΔG(h,n) is the energy difference between n and n − 1 helical half-turns, namely:
At the bistable distance D = hn,c where ΔG = 0, the energy EN does not have any minimum (). When the first energy minimum develops at a radius r0 >0, a large barrier Eb >> kBT prevents loop nucleation. As a result, the cholesteric is trapped in a metastable state as the helical structure is compressed and overwound inside the expanding central loop (). Because this cell is the only one contributing to the elastic force (EquationEq. (17)(17)
(17) ) and the azimuthal strength W is expected to be large for cyanophenyls on mica, the twist angle is almost constant Φ ≈ Ψn and the force increases dramatically (). Moreover, the rotation rate Φ/D increases, and the photonic bandgap of the cholesteric is shifted from the visible to the UV range. A new loop is eventually nucleated under strong compression, triggering a cascade of loop nucleation events until the surfaces reach adhesive contact at molecular distances (D ≈1 nm, ). Between two loop nucleation events, the cholesteric was briefly trapped in another metastable state, creating a stick-slip-like dynamics [Citation10].
Figure 14. Loop nucleation energy EN as a function of the loop radius ri. The white triangle indicates the first negative minimum obtained by decreasing the surface distance D. Eb is the energy barrier to loop nucleation. The black circle is the last metastable point (minimum) obtained during surface retraction. Adapted from [Citation33].
![Figure 14. Loop nucleation energy EN as a function of the loop radius ri. The white triangle indicates the first negative minimum obtained by decreasing the surface distance D. Eb is the energy barrier to loop nucleation. The black circle is the last metastable point (minimum) obtained during surface retraction. Adapted from [Citation33].](/cms/asset/98722a29-938f-4026-8d21-fa28cf6527b3/tlct_a_2358443_f0014_oc.jpg)
When the surfaces were retracted from contact, a large jump restored a number of half-turns n > 1 in the contact region. To calculate the energy barrier for loop annihilation, we can use the same function EN calculated for loop nucleation (EquationEq. (20)(20)
(20) ). The contact region now has n half-turns encircled by a loop with radius r0 > 0. shows that the last metastable point is obtained during retraction at distances D much closer to hc,n than during approach. Therefore, the energy barrier is different during approach and retraction, and the behaviour obtained during retraction is similar to the one expected in the absence of line tension.
To understand the effect of the anchoring strength W, we consider the equilibrium condition:
which reduces to the nematic case (EquationEq. (8)(8)
(8) ) for D/p << 1. EquationEquation (21)
(21)
(21) shows that the rotation rate Φ/D almost matches the natural value π/p for thicknesses D << L, possibly violating the anchoring conditions. In the nematic regime, i.e. D << p << L or D << L << p, the twist becomes Φ ≈ 0 as expected for a twisted nematic with weak anchoring conditions. On the other hand, the twist Φ can vary from πD/p and approach the anchoring conditions when D >> L, i.e. Φ ≈ Ψ0 + nπ. The case L << D << p is particularly interesting because the twist in the nematic regime is imposed by the surfaces, i.e. Φ ≈ Ψ0. If the cholesteric and anchoring conditions have different chiralities, i.e. the sign of p and Ψ0 are different, the sign of the twist Φ eventually changes from that of p to that of Ψ0 as the thickness D is decreased. Therefore, the cholesteric undergoes a confinement-induced reversal of handedness. Figures 15(a-c) show exact numerical calculations of the free energy G as a function of D and Φ, highlighting the zero-energy points, twist deviations from the anchoring values Φn, and handedness reversal for various values of the L/p ratio. Because the angles Φa and Φb approach the pitch-matching angle πD/p when D << L, the jump length decreases as D.
In the absence of any energy barrier, the force produced by the central cell of the loop array is given by EquationEq. (17)(17)
(17) : F ≈ 2πRG0(D), where the linear term due to line tension is taken as background. The minimum free energy G0(D) after the minimisation (∂G/∂Φ)D = 0 is shown in Figure 15(d). As in smectics, the force is oscillatory, with minima at distances D = hn and maxima at D = hc,n increasing as D is decreased. In addition, the force decreases as the L/D ratio increases.
The force-distance curve measured with the SFA during surface retraction showed oscillations with periodically spaced minima at distances Dm(n) (). Assuming that Dm = hn = p(Ψ0 + nπ), a linear fit of Dm vs. n allows us to determine not only the half-pitch p = 120 nm but also the twist angle Ψ0 imposed by the surfaces [Citation116]. Crucially, the force maxima corresponded to surface distances at which a dislocation loop disappeared from the FECO (). The force measured during surface retraction was weak but comparable to the elastic force of nematics under twisted anchoring conditions (). In fact, the theoretical force maxima for L = 0 lie on the curve F/R = π3Kt/4D [Citation33] already found for a twisted nematic with Φ = π/2 (EquationEq. (10)(10)
(10) ). As the surfaces were separated from the adhesive contact, a large outward jump prevented measurement at small distances, where the forces were expected to be largest. Even so, both the force–distance curves and FECOs showed that the twist angle did not significantly deviate from the anchoring-matching values Ψn at distances D as small as p, indicative of an extrapolation length L << p or, equivalently, W >> Kt/p. For the twist elastic constant Kt ≈10 pN that best fitted the force measurements (), one finds again that the azimuthal anchoring strength is very large, W >> 0.1 mJ/m2, in agreement with the results obtained for nematic cyanobiphenyls on mica ().
The nanomechanical response of cholesterics has also been investigated using colloidal-probe AFM [Citation117]. The cholesteric had a short half-pitch p = 70 nm, and was confined between a flat rubbed polyimide surface and a spherical glass probe with radius R = 20 μm coated with the surfactant MAP (3-methylaminopropyl-trimethoxysilane) to create planar anchoring conditions. Oscillations in the measured force-distance curve anchoring were used to determine p (as in ). The authors did not report any asymmetry between surface approach and retraction, possibly because the radius R was much smaller than in the SFA experiments, and the loop nucleation energy (EquationEq. (20)(20)
(20) ) depends on R. In AFM experiments, however, the easy axis on the surfactant-coated sphere was not defined, measured, or controlled. This limitation prevented a quantitative comparison with theoretical expectations.
7. Conclusions and perspectives
SFA and AFM force measurements have provided deep insights into the structure and mechanical response of LCs confined to nanoscopic films. These studies have highlighted the general mechanisms by which surfaces induce molecular ordering in a liquid or couple with the order of an LC phase. So far, nanoscale force measurements have focused on the nematic, cholesteric, and smectic-A phases and on the orientational and/or positional order induced by the surfaces. This experimental approach, however, could be applied to other types of LC order, such as twist-bend nematics, chiral smectics, and the recently discovered ferronematic phase. In particular, surfaces coated with surfactant monolayers can induce polar order in cyanobiphenyls [Citation118–120]. Therefore, surface polar order can induce ferronematic order in an apolar nematic or couple to the spontaneous polar order of a ferronematic. It would be interesting, for instance, to confine a ferronematic between two equal surfaces that orient the polarisation vector p along the normal and away from the surface. These boundary conditions frustrate the ferronematic phase under strong confinement and could generate interesting structures and response.
Moreover, voltage differences can be applied to the surfaces in the SFA [Citation121–126] and AFM [Citation81] to create an electric field in the LC and study its electro-opto-mechanical response. Yet, this approach has not been used to study the electrooptical switching of LC in nanoscale films. This is not only interesting from a fundamental point of view but also functional to the integration of LCs as polarisation-controlling elements into nanoscale photonic devices such as multi-layered metamaterials and optical cavities.
Disclosure statement
No potential conflict of interest was reported by the author(s).
References
- Chaikin PM, Lubensky TC. Principles of condensed matter physics. Cambridge, (UK): Cambridge University Press; 1995.
- De Gennes PG, Prost J. The physics of liquid crystals. 2nd ed. Oxford, (UK): Oxford University Press; 1993.
- Wood TA, Lintuvuori JS, Schofield AB, et al. A self-quenched defect glass in a colloid-nematic liquid crystal composite. Science. 2011;334(6052):79–83. doi: 10.1126/science.1209997
- Zapotocky M, Ramos L, Poulin P, et al. Particle-stabilized defect gel in cholesteric liquid crystals. Science. 1999;283(5399):209–212. doi: 10.1126/science.283.5399.209
- Stratford K, Henrich O, Lintuvuori JS, et al. Self-assembly of colloid-cholesteric composites provides a possible route to switchable optical materials. Nat Commun. 2014;5(1):3954. doi: 10.1038/ncomms4954
- Lio GE, Ferraro A, Zappone B, et al. Unlocking optical coupling tunability in epsilon-near-zero metamaterials through liquid crystal nanocavities. Adv Opt Mater. 2024;12(13):2302483. doi: 10.1002/adom.202302483
- Li Y, Ma X, Zhai X, et al. Manipulating polariton condensates by Rashba-Dresselhaus coupling at room temperature. Nat Commun. 2022;13(1):3785. doi: 10.1038/s41467-022-31529-4
- Sharma M, Ellenbogen T. An all-optically controlled liquid-crystal plasmonic metasurface platform. Laser Photonics Rev. 2020;14(11):2000253. doi: 10.1002/lpor.202000253
- Rechcińska K, Król M, Mazur R, et al. Engineering spin-orbit synthetic Hamiltonians in liquid-crystal optical cavities. Science. 2019;366(6466):727–730. doi: 10.1126/science.aay4182
- Israelachvili JN. Intermolecular and surface forces. 3rd ed. Amsterdam: Academic Press; 2011.
- Zappone B, Zheng W, Perkin S. Multiple-beam optical interferometry of anisotropic soft materials nanoconfined with the surface force apparatus. Rev Sci Instrum. 2018;89(8):085112. doi: 10.1063/1.5038951
- Rasing T, Ie M. Surfaces and Interfaces of Liquid Crystals. Rasing T, Muševič I, editors. Berlin, Germany: Springer-Verlag; 2003.
- Luengo G, Schmitt F-J, Hill R, et al. Thin film rheology and tribology of confined polymer melts: contrasts with bulk properties. Macromol. 1997;30(8):2482–2494. doi: 10.1021/ma9519122
- Muševič I. Liquid crystal colloids. Cham, Switzerland: Springer International Publishing AG; 2017.
- Israelachvili N, Adams GE. Measurement of forces between two mica surfaces in aqueous electrolyte solutions in the range 0-100 nm. J Chem Soc Faraday Trans 1. 1978;74(4):975–1001. doi: 10.1039/f19787400975
- Israelachvili JN, McGuiggan PM. Adhesion and short-range forces between surfaces. Part I: new apparatus for surface force measurements. J Mater Res. 1990;5(10):2223–2231. doi: 10.1557/JMR.1990.2223
- Hayler H, Groves TS, Guerrini A, et al. The surface force balance: Direct measurement of interactions in fluids and soft matter. Rep Prog Phys. 2024;87(4):046601. doi: 10.1088/1361-6633/ad2b9b
- Christenson HK. Surface deformations in direct force measurements. Langmuir. 1996;12(5):1404–1405. doi: 10.1021/la9408127
- Ruths M, Steinberg S, Israelachvili JN. Effects of confinement and shear on the properties of thin films of thermotropic liquid crystal. Langmuir. 1996;12(26):6637–6650. doi: 10.1021/la960412e
- Dushkin CD, Kurihara K. Nanorheology of thin liquid crystal film studied by shear force resonance method. In: Kawasaki K, Lindman B, and Okabayashi H, editors. Formation and dynamics of self-organized structures in surfactants and polymer solutions. Progress in Colloid & Polymer science. Vol. 106. Darmstadt: Steinkopff; 1997. p. 262–265.
- Dushkin CD, Kurihara K. Nanotribology of thin liquid-crystal films studied by the shear force resonance method. Colloids Surf A Physicochem Eng Asp. 1997;129-130:131–139. doi: 10.1016/S0927-7757(97)00031-9
- Kumacheva E. Interfacial friction measurement in surface force apparatus. Prog Surf Sci. 1998;58(2):75–120. doi: 10.1016/S0079-6816(98)00017-3
- Janik J, Tadmor R, Klein J. Shear of molecularly confined liquid crystals. 1. Orientation and Transitions under Confinement Langmuir. 1997;13(16):4466–4473. doi: 10.1021/la960452i
- Janik J, Tadmor R, Klein J. Shear of molecularly confined liquid crystals. 2. Stress anisotropy across a model nematogen compressed between sliding solid surfaces. Langmuir. 2001;17(18):5476–5485. doi: 10.1021/la001392q
- Artsyukhovich A, Broekman LD, Salmeron M. Friction of the liquid crystal 8CB as probed by the surface forces apparatus. Langmuir. 1999;15(6):2217–2223. doi: 10.1021/la980415m
- Ruths M, Granick S. Influence of alignment of crystalline confining surfaces on static forces and shear in a liquid crystal, 4’-n-pentyl-4-cyanobiphenyl. Langmuir. 2000;16(22):8368–8376. doi: 10.1021/la000350z
- Pieranski P, Jérôme B. Adsorption-induced anchoring transitions at nematic-liquid-crystal–crystal interfaces. Phys Rev A. 1989 01 07;40(1):317–322. doi: 10.1103/PhysRevA.40.317
- Radoslovich EW. The structure of muscovite, KAl2(Si3Al)O10(OH)2. Acta Crystallogr. 1960;13(11):919–932. doi: 10.1107/S0365110X60002259
- Baba M, Kakitani S, Ishii H, et al. Fine atomic image of mica cleavage planes obtained with an atomic force microscope (AFM) and a novel procedure for image processing. Chem Phys. 1997;221(1,2):23–31. doi: 10.1016/S0301-0104(97)00141-9
- Blinov LM, Sonin AA. The interaction of nematic liquid crystals with anisotropic substrates. Mol Cryst Liq Cryst. 1990;179(1):13–25. doi: 10.1080/00268949008055372
- Lee DW, Ruths M, Israelachvili JN. Surface forces and nanorheology of molecularly Thin films. In: Bhushan B, editor. Springer handbook of nanotechnology. 4th ed. Berlin & Heidelberg, Germany: Springer Verlag; 2017. p. 935–985.
- Israelachvili JN. Thin film studies using multiple-beam interferometry. J Colloid Interface Sci. 1973;44(2):259–272. doi: 10.1016/0021-9797(73)90218-X
- Zappone B, Bartolino R. Topological barriers to defect nucleation generate large mechanical forces in an ordered fluid. PNAS. 2020;118(44):e2110503118. doi: 10.1073/pnas.2110503118
- Heuberger M. The extended surface forces apparatus. Part I. Fast spectral correlation interferometry. Rev Sci Instrum. 2001;72(3):1700–1707. doi: 10.1063/1.1347978
- Heuberger M, Zäch M, Spencer ND. Density fluctuations under confinement: When is a fluid not a fluid? Science. 2001;292(5518):905–908. doi: 10.1126/science.1058573
- Rabinowitz P. Eigenvalue analysis of the surface forces apparatus interferometer. J Opt Soc Am A. 1995;12(7):1593–1601. doi: 10.1364/JOSAA.12.001593
- Zappone B, Richetti P, Barberi R, et al. Forces in nematic liquid crystals constrained to the nanometer scale under hybrid anchoring conditions. Phys Rev E. 2005;71(4):041703. doi: 10.1103/PhysRevE.71.041703
- Berreman DW. Optics in stratified and anisotropic media: 4×4-matrix formulation. J Opt Soc Am. 1972;62(4):502–510. doi: 10.1364/JOSA.62.000502
- Yeh P. Optics of anisotropic layered media: A new 4 × 4 matrix algebra. Surf Sci. 1980;96(1):41–53. doi: 10.1016/0039-6028(80)90293-9
- Schwenzfeier KA, Erbe A, Bilotto P, et al. Optimizing multiple beam interferometry in the surface forces apparatus: novel optics, reflection mode modeling, metal layer thicknesses, birefringence, and rotation of anisotropic layers. Rev Sci Instrum. 2019;90(4):043908. doi: 10.1063/1.5085210
- Binnig G, Quate CF, Gerber C. Atomic force microscope. Phys Rev Lett. 1986;56(9):930–933. doi: 10.1103/PhysRevLett.56.930
- Butt H-J, Cappella B, Kappl M. Force measurements with the atomic force microscope: Technique, interpretation and applications. Surf Sci Rep. 2005;59(1):1–152. doi: 10.1016/j.surfrep.2005.08.003
- Sader JE, Chon JWM, Mulvaney P. Calibration of rectangular atomic force microscope cantilevers. Rev Sci Instrum. 1999;70(10):3967–3969. doi: 10.1063/1.1150021
- Sader JE, Larson I, Mulvaney P, et al. Method for the calibration of atomic force microscope cantilevers. Rev Sci Instrum. 1995;66(7):3789–3798. doi: 10.1063/1.1145439
- Muševič I, Kočevar K, Kržič U, et al. Force spectroscopy based on temperature controlled atomic force microscope head using piezoresistive cantilevers. Rev Sci Instrum. 2005;76(4):043701. doi: 10.1063/1.1884191
- Ducker WA, Senden TJ, Pashley RM. Direct measurement of colloidal forces using an atomic force microscope. Nature. 1991;353(6341):239–241. doi: 10.1038/353239a0
- Jérôme B. Surface effects and anchoring in liquid crystals. Rep Prog Phys. 1991;54(3):391–452. doi: 10.1088/0034-4885/54/3/002
- Jérôme B, Shen YR. Anchoring of nematic liquid crystals on mica in the presence of volatile molecules. Phys Rev E. 1993;48(6):4556–4574. doi: 10.1103/PhysRevE.48.4556
- Jérôme B, O’Brien J, Ouchi Y, et al. Bulk reorientation driven by orientational transition in a liquid crystal monolayer. Phys Rev Lett. 1993;71(5):758–761. doi: 10.1103/PhysRevLett.71.758
- Schuddeboom PC, Jérome B. Azimuthal anchoring of liquid crystals on surfaces with high symmetry. Phys Rev E. 1997;56(4):4294–4305. doi: 10.1103/PhysRevE.56.4294
- Somers DAT, Garrett JL, Palm KJ, et al. Measurement of the Casimir torque. Nature. 2018;564(7736):386–389. doi: 10.1038/s41586-018-0777-8
- Dubois-Violette E, De Gennes PG. Effects of long range van der Waals forces on the anchoring of a nematic fluid at an interface. J Colloid Interface Sci. 1976;57(3):403–410. doi: 10.1016/0021-9797(76)90219-8
- Smith DPE, Heckl WM, Klagges HA. Ordering of alkylcyanobiphenyl molecules at MoS2 and graphite surfaces studied by tunneling microscopy. Surf Sci. 1992;278(1):166–174. doi: 10.1016/0039-6028(92)90592-T
- Sheng P. Phase transition in surface-aligned nematic films. Phys Rev Lett. 1976;37(16):1059–1062. doi: 10.1103/PhysRevLett.37.1059
- Sheng P. Boundary-layer phase transition in nematic liquid crystals. Phys Rev A. 1982;26(3):1610–1617. doi: 10.1103/PhysRevA.26.1610
- Hsiung H, Rasing T, Shen YR. Wall-induced orientational order of a liquid crystal in the isotropic phase—an evanescent-wave-ellipsometry study. Phys Rev Lett. 1986;57(24):3065–3068. doi: 10.1103/PhysRevLett.57.3065
- Poniewierski A, Sluckin TJ. Theory of the nematic-isotropic transition in a restricted geometry. Liq Cryst. 1987;2(3):281–311. doi: 10.1080/02678298708086677
- Borštnik A, Žumer S. Forces in an inhomogeneously ordered nematic liquid crystal: Stable and metastable states. Phys Rev E. 1997;56(3):3021–3027. doi: 10.1103/PhysRevE.56.3021
- Kocevar K, Musevic I. Forces in the isotropic phase of a confined nematic liquid crystal 5CB. Phys Rev E. 2001;64(5 Pt 1):051711. doi: 10.1103/PhysRevE.64.051711
- Horn RG, Israelachvili JN, Perez E. Forces due to structure in a thin liquid crystal film. J Phys France. 1981;42(1):39–52. doi: 10.1051/jphys:0198100420103900
- Mitchell DJ, Ninham BW, Pailthorpe BA. Solvent structure in particle interactions. Part 1.—The asymptotic regime. J Chem Soc Faraday Trans 2. 1978;74:1098. doi: 10.1039/F29787401098
- Mitchell DJ, Ninham BW, Pailthorpe BA. Solvent structure in particle interactions. Part 2.—Forces at short range. J Chem Soc Faraday Trans 2. 1978;74:1116. doi: 10.1039/F29787401116
- Van Megen W, Snook I. Solvent structure and solvation forces between solid bodies. J Chem Soc Faraday Trans. 1979;75(8):1095. doi: 10.1039/f29797501095
- Horn RG, Israelachvili JN. Direct measurement of forces due to solvent structure. Chem Phys Lett. 1980;71(2):192–194. doi: 10.1016/0009-2614(80)80144-8
- Kočevar K, Blinc R, Muševič I. Atomic force microscope evidence for the existence of smectic like surface layers in the isotropic phase of a nematic liquid crystal. Phys Rev E. 2000;62(3):R3055–R3058. doi: 10.1103/PhysRevE.62.R3055
- Moreau L, Richetti P, Barois P. Direct measurement of the interaction between two ordering surfaces confining a presmectic film. Phys Rev Lett. 1994;73(26):3556–3559. doi: 10.1103/PhysRevLett.73.3556
- Richetti P, Moreau L, Barois P, et al. Measurement of the interactions between two ordering surfaces under symmetric and asymmetric boundary conditions. Phys Rev E. 1996;54(2):1749–1762. doi: 10.1103/PhysRevE.54.1749
- Alves VM, Nakamatsu S, Oliveira EA, et al. Anisotropic Reversible aggregation of latex nanoparticles suspended in a lyotropic nematic liquid crystal: Effect of gradients of biaxial order. Langmuir. 2009;25(19):11849–11856. doi: 10.1021/la901520r
- Pershan PS, Als-Nielsen J. X-Ray reflectivity from the surface of a liquid crystal: Surface structure and absolute value of critical fluctuations. Phys Rev Lett. 1984;52(9):759–762. doi: 10.1103/PhysRevLett.52.759
- Kitaev V, Kumacheva E. Thin films of liquid crystals confined between crystalline surfaces. J Phys Chem B. 2000;104(37):8822–8829.
- De Gennes PG. Interactions between solid surfaces in a presmectic fluid. Langmuir. 1990;6(9):1448–1450. doi: 10.1021/la00099a003
- Kocevar K, Borstnik A, Musevic I, et al. Capillary condensation of a nematic liquid crystal observed by force spectroscopy. Phys Rev Lett. 2001;86(26 Pt 1):5914–5917. doi: 10.1103/PhysRevLett.86.5914
- Borstnik Bracic A, Kocevar K, Musevic I, et al. Capillary forces in a confined isotropic-nematic liquid crystal. Phys Rev E. 2003;68(1):011708. doi: 10.1103/PhysRevE.68.011708
- Kočevar K, Muševič I. Structural forces in liquid crystals. Liq Cryst Today. 2003;12(3):3–8. doi: 10.1080/14645180310001624671
- Antelmi DA, Kékicheff P, Richetti P. The confinement-induced sponge to lamellar phase transition. Langmuir. 1999;15(22):7774–7788. doi: 10.1021/la9903191
- Rapini A, Papoular M. Distorsion d’une lamelle nématique sous champ magnétique conditions d’ancrage aux parois. J Phys Coll. 1969;30(C4):C4–54–C4–56. doi: 10.1051/jphyscol:1969413
- Ruths M, Zappone B. Direct nanomechanical measurement of an anchoring transition in a nematic liquid crystal subject to hybrid anchoring conditions. Langmuir. 2012;28(22):8371–8383. doi: 10.1021/la204746d
- Toyooka T, Chen G-P, Takezoe H, et al. Determination of twist elastic constant K22 in 5CB by four independent light-scattering techniques. Jpn J Appl Phys. 1987;26(12R):1959. doi: 10.1143/JJAP.26.1959
- Sonnet AM, Gruhn T. On the origin of repulsive forces of nematic liquid-crystalline films in the surface forces apparatus. J Phys. 1999;11(41):8005. doi: 10.1088/0953-8984/11/41/305
- Kocevar K, Musevic I. Observation of an electrostatic force between charged surfaces in liquid crystals. Phys Rev E. 2002;65(3):030703. doi: 10.1103/PhysRevE.65.030703
- Škarabot M, Muševič I. Atomic force microscope force spectroscopy study of the electric double layer at a liquid crystal interface. J Appl Phys. 2009;105(1):014905. doi: 10.1063/1.3043573
- Carbone G, Lombardo G, Barberi R, et al. Mechanically induced biaxial transition in a nanoconfined nematic liquid crystal with a topological defect. Phys Rev Lett. 2009;103(16):167801. doi: 10.1103/PhysRevLett.103.167801
- Barbero G, Barberi R. Critical thickness of a hybrid aligned nematic liquid crystal cell. J Phys France. 1983;44(5):609–616. doi: 10.1051/jphys:01983004405060900
- Hochbaum A, Labes MM. Alignment and texture of thin liquid crystal films on solid substrates. J Appl Phys. 1982;53(4):2998–3002. doi: 10.1063/1.331040
- Proust JE, Ter-Minassian-Saraga L. Films minces de cristaux liquides. J Phys Colloques. 1979;40(C3):C3–490–496. doi: 10.1051/jphyscol:1979398
- Barbero G, Madhusudana NV, Durand G. Weak anchoring energy and pretilt of a nematic liquid crystal. J Phys Lett-Paris. 1984;45(12):613–619. doi: 10.1051/jphyslet:019840045012061300
- Wittebrood MM, Rasing T, Stallinga S, et al. Confinement effects on the collective excitations in thin nematic films. Phys Rev Lett. 1998;80(6):1232–1235. doi: 10.1103/PhysRevLett.80.1232
- Schopohl N, Sluckin TJ. Defect core structure in nematic liquid crystals. Phys Rev Lett. 1987;59(22):2582–2584. doi: 10.1103/PhysRevLett.59.2582
- Palffymuhoray P, Gartland EC, Kelly JR. A new configurational transition in inhomogeneous nematics. Liq Cryst. 1994;16(4):713–718. doi: 10.1080/02678299408036543
- Galabova HG, Kothekar N, Allender DW. Stable configurations in hybrid nematic cells in relation to thickness and surface order. Liq Cryst. 1997;23(6):803–811. doi: 10.1080/026782997207731
- Sarlah A, Zumer S. Equilibrium structures and pretransitional fluctuations in a very thin hybrid nematic film. Phys Rev E. 1999;60(2):1821–1830. doi: 10.1103/PhysRevE.60.1821
- Ziherl P, Podgornik R, Zumer S. Pseudo-Casimir structural force drives spinodal dewetting in nematic liquid crystals. Phys Rev Lett. 2000;84(6):1228–1231. doi: 10.1103/PhysRevLett.84.1228
- Chiccoli C, Pasini P, Sarlah A, et al. Structures and transitions in thin hybrid nematic films: a Monte Carlo study. Phys Rev E. 2003;67(5):050703. doi: 10.1103/PhysRevE.67.050703
- Proust JE, Ter-Minassian-Saraga L. Structure, free energy of adhesion and disjoining pressure in a solid-nematic thermotrope system. Colloid Polym Sci. 1976;254(5):492–496. doi: 10.1007/BF01410916
- Bisi F, Gartland EC Jr., Rosso R, et al. Order reconstruction in frustrated nematic twist cells. Phys Rev E. 2003;68(2 Pt 1):021707. doi: 10.1103/PhysRevE.68.021707
- Bisi F, Virga EG, Durand GE. Nanomechanics of order reconstruction in nematic liquid crystals. Phys Rev E. 2004;70(4):042701. doi: 10.1103/PhysRevE.70.042701
- Mirantsev LV, Virga EG. Molecular dynamics simulation of a nanoscopic nematic twist cell. Phys Rev E. 2007;76(2):021703. doi: 10.1103/PhysRevE.76.021703
- Kekicheff P, Richetti P, Christenson HK. Structure and elastic properties of lamellar mesophases from direct force measurements. Langmuir. 1991;7(9):1874–1879. doi: 10.1021/la00057a010
- Richetti P, Kekicheff P, Barois P. Measurement of the layer compressibility modulus of a lamellar mesophase with a surface forces apparatus. J Phys. 1995;5(8):1129–1154. doi: 10.1051/jp2:1995173
- Carbone G, Zappone B, Barberi R, et al. Direct nanomechanical measurement of layer thickness and compressibility of smectic liquid crystals. Phys Rev E. 2011;83(5):051707. doi: 10.1103/PhysRevE.83.051707
- Milette J, Relaix S, Lavigne C, et al. Reversible long-range patterning of gold nanoparticles by smectic liquid crystals. Soft Matter. 2012;8(24):6593–6598. doi: 10.1039/c2sm25445j
- Pershan PS, Prost J. Dislocation and impurity effects in smectic‐A liquid crystals. J Appl Phys. 1975;46(6):2343–2353. doi: 10.1063/1.321912
- Meyer RB, Stebler B, Lagerwall ST. Observation of edge dislocations in smectic liquid crystals. Phys Rev Lett. 1978;41(20):1393–1395. doi: 10.1103/PhysRevLett.41.1393
- Oswald P, Milette J, Relaix S, et al. Alloy hardening of a smectic a liquid crystal doped with gold nanoparticles. Europhys Lett. 2013;103(4):46004. doi: 10.1209/0295-5075/103/46004
- Litster JD, Als-Nielsen J, Birgeneau RJ, et al. High resolution x-ray and light scattering studies of bilayer smectic a compounds. J Phys Colloques. 1979;40(4):339–340. doi: 10.1051/jphyscol:1979366
- Roux D, Safinya CR. A synchrotron X-ray study of competing undulation and electrostatic interlayer interactions in fluid multimembrane lyotropic phases. J Phys. 1988;49(2):307–318. doi: 10.1051/jphys:01988004902030700
- Kelton K, Greer AL. Nucleation in condensed matter. Amsterdam, The Netherlands: Pergamon; 2010.
- Radzihovsky L, Lubensky TC. Nonlinear smectic elasticity of helical state in cholesteric liquid crystals and helimagnets. Phys Rev E. 2011;83(5):051701. doi: 10.1103/PhysRevE.83.051701
- Pinkevich IP, Reshetnyak VY, Reznikov YA, et al. Influence of light-induced molecular conformational transformations and anchoring energy on cholesteric liquid crystal pitch and dielectric properties. Mol Cryst Liq Cryst. 1992;223(1):269–278. doi: 10.1080/15421409208048701
- Zink H, Belyakov VA. Temperature hysteresis of the change in the cholesteric pitch and surface anchoring in thin planar layers. J Exp Theor Phys. 1997 08 01;85(2):285–291. doi: 10.1134/1.558276
- Smalyukh II, Lavrentovich OD. Anchoring-mediated interaction of edge dislocations with bounding surfaces in confined cholesteric liquid crystals. Phys Rev Lett. 2003;90(8):085503. doi: 10.1103/PhysRevLett.90.085503
- Kiselev AD, Sluckin TJ. Twist of cholesteric liquid crystal cells: stability of helical structures and anchoring energy effects. Phys Rev E. 2005;71(3):031704. doi: 10.1103/PhysRevE.71.031704
- Lelidis I, Barbero G, Alexe-Ionescu AL. Cholesteric pitch transitions induced by mechanical strain. Phys Rev E. 2013;87(2):022503. doi: 10.1103/PhysRevE.87.022503
- Smalyukh II, Lavrentovich OD. Three-dimensional director structures of defects in Grandjean-cano wedges of cholesteric liquid crystals studied by fluorescence confocal polarizing microscopy. Phys Rev E. 2002;66(5):051703. doi: 10.1103/PhysRevE.66.051703
- Barbero G, Zheng W, Zappone B. Twist transitions and force generation in cholesteric liquid crystal films. J Mol Liq. 2018;267:242–248. doi: 10.1016/j.molliq.2017.11.014
- Zheng W, Perez-Martinez CS, Petriashvili G, et al. Direct measurements of structural forces and twist transitions in cholesteric liquid crystal films with a surface force apparatus. Soft Matter. 2019;15(24):4905–4914. doi: 10.1039/C9SM00487D
- Škarabot M, Lokar Ž, Gabrijelčič K, et al. Atomic force microscope based method of measuring short cholesteric pitch in liquid crystals. Liq Cryst. 2011;38(8):1017–1020. doi: 10.1080/02678292.2011.589912
- Guyot-Sionnest P, Hsiung H, Shen YR. Surface polar ordering in a liquid crystal observed by optical second-harmonic generation. Phys Rev Lett. 1986;57(23):2963–2966. doi: 10.1103/PhysRevLett.57.2963
- Chen W, Feller MB, Shen YR. Investigation of anisotropic molecular orientational distributions of liquid-crystal monolayers by optical second-harmonic generation. Phys Rev Lett. 1989;63(24):2665–2668. doi: 10.1103/PhysRevLett.63.2665
- Blinov LM, Chigrinov VG. Electrooptic effects in liquid crystal materials. New York, (NY) (USA): Springer; 1994.
- Cho Y-K, Granick S. A surface forces platform for dielectric measurements. J Chem Phys. 2003;119(1):547–554. doi: 10.1063/1.1568931
- Valtiner M, Banquy X, Kristiansen K, et al. The electrochemical surface forces apparatus: the effect of surface roughness, electrostatic surface potentials, and anodic oxide growth on interaction forces, and friction between dissimilar surfaces in aqueous solutions. Langmuir. 2012;28(36):13080–13093. doi: 10.1021/la3018216
- Drummond C. Electric-field-induced friction reduction and control. Phys Rev Lett. 2012;109(15):154302. doi: 10.1103/PhysRevLett.109.154302
- Nakano S, Mizukami M, Kurihara K. Effect of confinement on electric field induced orientation of a nematic liquid crystal. Soft Matter. 2014;10(13):2110–2115. doi: 10.1039/C3SM52744A
- Kristiansen K, Zeng H, Zappone B, et al. Simultaneous measurements of molecular forces and electro-optical properties of a confined 5CB liquid crystal film using a surface forces apparatus. Langmuir. 2015;31(13):3965–3972. doi: 10.1021/acs.langmuir.5b00144
- Perez-Martinez CS, Perkin S. Surface forces generated by the action of electric fields across liquid films. Soft Matter. 2019;15(21):4255–4265. doi: 10.1039/C9SM00143C