
ABSTRACT
The ability to distinguish between subtle differences among emotions of similar valence is labelled emotion differentiation (ED). Previous research has demonstrated that people high in ED are less likely to use disengagement regulation strategies (i.e. avoidance/distraction) during negative affective states.
The present eye-tracking study examined associations between ED and visual attention/avoidance of affective stimuli. A total of 160 participants viewed emotional video clips (positive/ negative), which were concurrently presented with a non-affective distractor image. After each video, participants verbally described their experienced emotions with adjectives in an open-response format. Moreover, they completed an ED questionnaire.
The computed ED specificity index for the negative videos (the number of specific adjectives divided by all adjectives used) was positively associated with the scores on the ED questionnaire and visual revisits for the negative videos (how many times the participants gazed back and forth between video and distractor). This viewing style might reflect more active exploratory behaviour directed toward acquiring information about the negative stimulus and its context. The ED measures were not associated with the gaze behaviour for positive videos.
1. Introduction
People use a wide range of vocabulary to describe their affective states (Ottenstein & Lischetzke, Citation2020). However, the words used to communicate one's feelings vary greatly in complexity and level of differentiation. For instance, some people tend to use specific and discrete emotion adjectives (e.g. “I feel annoyed”), while others may choose rather broad and unspecific terms (e.g. “I feel bad”; Erbas et al., Citation2014). The ability to distinguish between different nuances of similarly valenced emotions by using a specific vocabulary is called “emotional granularity” (Tugade et al., Citation2004) or “emotion differentiation” (ED; Boden et al., Citation2013). ED can refer to the differentiation of negative emotions (“negative ED”) and positive emotions.
ED has been shown to play an important role in emotion regulation (Boden et al., Citation2013). For example, if someone cannot discriminate between being annoyed or offended, they may not be able to find an adequate, specific emotion regulation strategy (Ottenstein, Citation2020). This is of particular relevance for clinical groups (e.g. patients with depression) that are characterised by diminished ED (Demiralp et al., Citation2012).
A four-year longitudinal study investigated how negative ED was associated with specific emotion regulation strategies (Brown et al., Citation2021). Participants with low ED reported using unspecific avoidance strategies more often (i.e. efforts to escape and distract oneself from negative emotions and cognitions; compare: Seah & Coifman, Citation2022), whereas people high in negative ED chose more adaptive and engaging responses, such as seeking social support (Brown et al., Citation2021; Erbas et al., Citation2015).
Past approaches have assessed ED via pre-defined adjectives (i.e. close-ended response format; O’Toole et al., Citation2020; Seah & Coifman, Citation2022). Using this approach, participants cannot freely express their affect via self-chosen words like they would when describing their feelings to friends, partners, family, or therapists. To overcome this limitation, Ottenstein and Lischetzke (Citation2020) developed a novel approach to assess negative ED. Participants rated their well-being and whether or not they had experienced an emotional event daily over a timespan of three weeks. Further, they retrospectively described their emotional state during each event via adjectives in an open-response format. In their study, Ottenstein and Lischetzke (Citation2020) calculated ED as the percentage of specific adjectives used (relative to all adjectives used; rated by two independent raters). It was found that on days with an adverse emotional event, this ED specificity index was positively associated with reported well-being. In addition to that study, a meta-analysis by Erbas et al. (Citation2019) identified ED as a predictor of several indicators of well-being (lack of depression, emotional clarity, and self-esteem).
Previous research has also suggested that higher negative ED is associated with less negative affect avoidance (Brown et al., Citation2021). Of note, this finding was based on an investigation using a diary self-disclosure approach that focused on consciously perceived and recalled affect avoidance. At the same time, however, preliminary evidence has suggested ED is also associated with automatic affect processing: In a study with electroencephalography, people with low ED showed higher event-related negativity at the very early stage of 60–90 ms after the onset of positive and negative affective images (Lee et al., Citation2017). Subsequent components (270–300 ms and 540–570 ms after stimulus onset) were less pronounced for low ED participants. The authors interpreted this neurophysiological pattern as an indicator of lower stimulus engagement in people with low ED.
Proceeding from this preliminary evidence, further psychophysiological studies are warranted to understand how people with varying levels of ED view affective stimuli. Eye-tracking is a well-established method for investigating visual affect processing and attention. Affective stimuli commonly attract selective attention when presented alongside neutral stimuli (Quigley et al., Citation2012). However, it remains unknown if people high in ED also show this attentional bias or if they avoid negative affect elicitation (i.e. a less pronounced gaze bias towards negative affective stimuli; Quigley et al., Citation2012). So far, no eye-tracking study has investigated if people with low ED engage less with negative affective stimuli than people with high ED. The present eye-tracking study examined associations between ED and visual attention to positive and negative affect cues. We implemented both a performance-based ED measure (i.e. specificity index; Ottenstein & Lischetzke, Citation2020) and self-reported ED (Range and Differentiation of Emotional Experience Scale, RDEES; Kang & Shaver, Citation2004). Affect was induced by emotional video clips (E.Vids; Blechert et al., Citation2013), which were concurrently presented with a non-affective distractor image. Participants were instructed that the presenter in the video would give them feedback (positive or negative, e.g. “I am proud of you”; “I am disappointed in you”). We predicted that high ED would be associated with longer viewing times (i.e. less avoidance) of the emotion-eliciting videos. Furthermore, we explored associations between ED and attention reallocation from the distractor image to the video. Previous research (Brown et al., Citation2021) has demonstrated that people high in negative ED are less likely to use disengagement regulation strategies (i.e. avoidance/distraction) during negative affective states and are more likely to use engagement strategies (i.e. problem-solving).
The study was preregistered and data are available at the Open Science Framework (OSF; https://osf.io/ra7ku/)
2. Materials and methods
2.1. Sample
Based on a simulation study reporting that correlations can be expected to be relatively stable at N = 150 (Schönbrodt & Perugini, Citation2013), we recruited 160 participants (assuming non-recordable eye-tracking data for some participants). For n = 150, a statistical power of .80, and α = .05 the critical correlation size is r = .16. Participants of the present study were between 18 and 35 years old. They reported normal or corrected-to-normal vision. We excluded four participants due to insufficient eye-tracking data quality (low accuracy: > 1° visual angle). The resulting sample (n = 156, nfemale = 107) had a mean age of 22.4 years (SD = 2.8). Participants were university students (n = 152) or white-collar workers. The study was approved by the university's ethics committee (ethics approval code: 39/17/63 ex 2021/22) and conducted according to the declaration of Helsinki. All participants provided written informed consent.
2.2. Stimuli
The participants viewed 12 emotion-eliciting videos from the E.Vids set (Blechert et al., Citation2013). The videos showed an actor (face and shoulders; white background; black t-shirt) presenting either positive feedback (6 trials, e.g. “I am proud of you.”) or negative feedback (6 trials, e.g. “I am disappointed in you.”). The actors spoke directly to the camera. E.Vids stimuli can elicit negative and positive affect even if presented in rapid succession (Wiggert et al., Citation2015). In the present paradigm, each video was shown for 3000 ms. Another 3000 ms presentation of the video's last frame followed to investigate not only initial gaze orientation but also later attention/avoidance of the affective stimuli. Each actor (seven female, five male) appeared in only one trial. Videos were presented on the left or right side of the screen. On the opposite side, an image of a neutral object from an office/university context (e.g. office supplyFootnote1) was displayed. This neutral image allowed the participants to engage and disengage with the affective stimulus by gazing at the other side of the screen (compare: Schofield et al., Citation2012). Videos and images were cropped to a square (800px by 800px). To counterbalance the side of each video and whether an actor presented a positive or negative statement, four parallel versions of the paradigm were createdFootnote2 to which the participants were allocated randomly. The order of the twelve trials was randomised. Before each trial, participants had to fixate a cross in the centre of the screen for 500 ms (compare: Gremsl et al., Citation2018). Participants were asked to imagine the actor giving them feedback, e.g. about a task assignment at the university (compare: Wiggert et al., Citation2015).
2.3. Self-reports (ratings, questionnaires) and tests
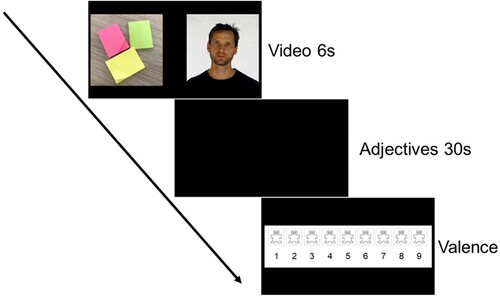
Video ratings: After each video, participants verbally described their experienced emotions for 30 s with adjectives (open response format). Moreover, they rated the valence of their affective state on a 9-point scale (1 = negative; 9 = positive) of the Self-Assessment Manikin (SAM; Bynion & Feldner, Citation2017). The response time for each trial was set to 30 s to keep inter-stimulus intervals comparable between the participants. For a visualisation of the procedure, see .
Figure 1. Experimental trial: Affect-inducing videos were presented (6s) followed by a blank screen (30s), during which participants described their affective state via emotional adjectives. Subsequently, the valence rating was completed.
Based on the ratings for experienced emotions, an emotion differentiation index was calculated separately for negative and positive trials. The number of specific adjectives was divided by the number of all adjectives for each participant and each trial. Three raters classified an adjective used by the participants as either specific or unspecific (compare: Ottenstein & Lischetzke, Citation2020). Cohen’s kappa suggested a good inter-rater agreement (average Cohen’s κ = .67, Nwords = 659). Specific adjectives were coded as 100% and unspecific adjectives as 0%. If the raters disagreed (65 words, e.g. “erfreut” [German]), the specificity was defined by the average rating. In the present study, participants named on average 3.48 adjectives after positive videos (SD = 1.08) and 3.35 adjectives after negative videos (SD = 1.00).
The Range and Differentiation of Emotional Experience Scale (RDEES; Kang & Shaver, Citation2004): assessed self-reported ED (differentiation subscale). The differentiation scale consists of seven items (e.g. “Each emotion has a very distinct and unique meaning to me.”), answered on a 5-point Likert scale (1: “does not describe me very well” to 5: “describes me very well”). Cronbach's alpha was α = .84 for the differentiation subscale.
General verbal abilities: We assessed semantic verbal fluency via an animal-naming task. In this task, participants wrote down as many animals as possible within one minute (Tombaugh, Citation1999). Furthermore, we conducted the Multiple-Choice-Word-Test-B (MWT-B; Lehrl et al., Citation1995). In the 37 items of the MWT-B, the participants have to find the actual German word among four neologisms leading to possible MWT-B sum scores ranging from 0 to 37. The reliability of the MWT-B estimated with the Kuder-Richardson Formula 20 was KR-20 = .53 (Kuder, G.F., Richardson, M.W., Citation1937).
Demographics: age, gender, and occupation of participants were assessed.
2.4. Eye movement recording and analysis
Participants with normal or corrected-to-normal vision were invited to participate in the eye-tracking study via email lists and advertisements at the university campus and on social media. The eye-tracking paradigm started with a 9-point calibration. Subsequently, two-dimensional eye movements were recorded via an SMI RED250mobile (250 Hz sampling rate). To minimise head movements and to keep viewing distance constantly at 60cm, we used a chin rest. We calibrated both eyes and analysed data of the eye with the more precise calibration. Stimuli were presented on a 24-inch screen (1920 × 1080 pixels). The experiment was controlled with the SMI Experiment Center. Data were exported with SMI BeGaze using the standard thresholds of the software for event detection.
We calculated the following eye-tracking variables: (1) The percentage of dwell time (i.e. total fixation duration) that was spent on the video (and not on the distractor image) during the 6 s of the stimulus presentation and (2) the number of revisits on the video (i.e. how often participants gazed back at the video, after having gazed elsewhere).
2.5. Statistical analysis
One-sample t-tests were computed to investigate whether the valence of the negative/ positive videos differed from neutral valence (i.e. manipulation check). Pearson correlations (with 95% bootstrapped confidence intervals based on the bias-corrected and accelerated method with 2000 samples) tested associations between RDEES differentiation and the specificity index for negative and positive trials. Associations between ED (Level 2: RDEES differentiation and specificity indices for negative and positive videos) and dwell time and number of revisits (dependent variables) were investigated via multilevel-models with random intercepts across participants [i.e. Dependent Variable ∼ 1 + ED + (1 | participant)]. To explore differences between participants’ perception of positive and negative videos, we calculated multilevel models for the effects of video type (Level 2, positive or negative) on the dependent variables valence (i.e. manipulation check), dwell time and revisits [dependent variables ∼ 1 + video type + (1 | participant)].Footnote3 Multilevel-model analyses were conducted with the Linear Models package (version: 2.6.6.) implemented in JAMOVI (version: 2.3.18). A multiple linear regression was calculated to predict the specificity indices (separately for positive and negative trials) based on self-reported ED and gaze behaviour using the enter method.
3. Results
3.1. Manipulation check
The computed one-sample t-tests showed that the valence ratings for the positive and negative videos significantly differed from neutral valence ( = 5) and thus elicited the intended affective states (negative videos: M = 3.29, SD = 0.98, t(155) = 21.63, p < .001, d = 1.73; positive: M = 7.32, SD = 0.80, t(155) = 36.2, p < .001, d = 2.89; for the distribution of valence see supplementary Table 1 and supplementary Figure 1).
3.2. Specificity index
The specificity index for negative videos (M = 87%, SD = 11%) was significantly correlated with RDEES differentiation (M = 3.57, SD = 0.75; r = .173, p = .031, 95% CI [.026, .306]; supplementary Figure 2). The correlation between the specificity index for positive videos (M = 73%, SD = 14%) and RDEES differentiation was not statistically significant (r = .118, p = .144, 95% CI [-.041, .275]). General verbal abilities (verbal fluency and vocabulary) were not associated with the specificity indices for negative and positive videos (all r < .15, all p > .07; supplementary Table 2).
3.3. Multilevel models dwell time
Neither the specificity index for negative videos, t(157) < 0.01, p = .997, B = 0.000, 95% CI [−0.128; 0.129], SE = 0.066, nor RDEES differentiation, t(148) = 0.32, p = .751, B = 0.003, 95% CI [−0.015; 0.021], SE = 0.009, was associated with the dwell time percentage on negative videos. The same was the case for the dwell time percentage on positive videos, positive specificity index: t(148) = 1.66, p = .098, B = 0.082, 95% CI [−0.015; 0.179], SE = 0.049; RDEES differentiation: t(151) = 0.40, p = .688, B = 0.004, 95% CI [−0.015; 0.022], SE = 0.009. For dwell time per video, see supplementary Table 1.
3.4. Multilevel models revisits
A higher number of negative video revisits was predicted by a higher specificity index, t(153) = 2.73, p = .007, B = 1.25, 95% CI [0.354; 2.148], SE = 0.458. Neither RDEES differentiation, t(153) = 0.77, p = .441, B = 0.052, 95% CI [−0.079; 0.182], SE = 0.067, nor the same models for positive trial revisits were statistically significant, positive specificity index: t(153) = −0.88, p = .380, B = −0.312, 95% CI [−1.006; 0.383], SE = 0.354, RDEES differentiation: t(153) = 0.00, p = .999, B = 0.000, 95% CI [−0.131; 0.131], SE = 0.067. For revisits per video, see supplementary Table 1.
3.5. Between video type multilevel models for valence, dwell time and revisits
There was a significant effect of video type on all dependent variables (Valence, Dwell Time, Revisits) with higher valence for positive (dummy coding = 0) compared to negative videos (dummy coding = 1), t(1715) = −74.82, p < .001, B = −4.022, 95% CI [−4.128; −3.917], SE = 0.054, a higher percentage of dwell time on negative videos than positive videos, t(1298) = 3.90, p < .0.001, B = 0.026, 95% CI [0.013; 0.039], SE = 0.007, and more revisits on positive videos than negative videos, t(1704) = −3.33, p < .0.001, B = −0.117, 95% CI [−0.186; −0.048], SE = 0.035 (for descriptive data, see supplementary Table 1).
3.6. Regression
A significant regression equation was found, F(2,153) = 6.10, p = .003, with an adjusted R² of .062. Revisits on negative videos (B = .036, 95% CI [.009, .062], p = .008) and RDEES differentiation (B = .023, 95% CI [.001, .045], p = .043) were significant predictors of the specificity index in negative affect trials.Footnote4 For a multiple linear regression to predict the specificity index for positive affect trials based on the same predictors (positive video revisits and RDEES differentiation), the regression equation was not significant, F(2,153) = 1.59, p = .21.
4. Discussion
This is the first eye-tracking study to investigate associations between gaze behaviour during the processing of affective stimuli and ED. Furthermore, to the best of our knowledge, the present study is the first to assess ED specificity reflecting direct responses to affective stimuli (instead of using a retrospective approach). Negative ED specificity was associated with self-reported ED (questionnaire) and visual revisits of negative videos. Positive ED measures were not associated with revisits of positive videos.
4.1. Ed specificity index
The ED specificity index for negative videos was positively associated with self-reported ED (RDEES differentiation). Participants who indicated that they are able to differentiate between nuances of emotions named more specific adjectives to describe their affective state when they had received negative feedback from the presenter in the video. This association was not observed in a previous study (Ottenstein & Lischetzke, Citation2020), where the specificity index was not based on immediate responses to an affect-inducing event but on a daily diary. This may have led to a less reliable assessment of the specificity index due to possible memory biases. However, overcoming recall biases does come with a trade-off: Daily diary studies investigate emotions experienced in real-world situations. Arguably, emotions triggered in the laboratory are not equally relevant to the participants as real-life emotions.
We observed an association between self-reported ED and the specificity index only for negative affective states. On the one hand, ED plays a vital role when unpleasant feelings are experienced (Brown et al., Citation2021) that need to be regulated (Koole, Citation2009). It has been shown that effective emotion regulation can be promoted by classifying the negative emotion precisely (Matthews et al., Citation2021). On the other hand, if the experienced emotion is pleasant, the use of a specific regulation strategy is not necessary. Therefore, it is less vital to discriminate between positive affect nuances (Brown et al., Citation2021; Ottenstein & Lischetzke, Citation2020). The RDEES items do not differentiate between positive and negative affect. However, because of the particular importance of ED in the context of negative affect, participants may recall more negative affective events when self-reporting ED. Future research should investigate associations between the specificity index and self-reported ED that is assessed specifically for negatively and positively valenced emotions.
4.2. Gaze behaviour during negative affect processing
Even though in the present study, we did not assess the emotions the participants experienced in their daily lives, the present eye-tracking approach has a couple of advantages compared to a diary (e.g. Ottenstein & Lischetzke, Citation2020). The gaze data were recorded during affect elicitation. The viewing behaviour of the participants is undistorted by recall biases which may occur when people try to remember past emotional events. Furthermore, psychophysiological measures are less prone to social desirability effects and can assess unconscious engagement of affective information (Lee et al., Citation2017).
The visual stimuli of the current study were videos that showed a presenter who either gave negative or positive feedback to the participants (Blechert et al., Citation2013). The videos were paired with static distractor images that depicted neutral objects from a university/office context. Regardless of their ED capabilities, the participants spent most of the time (∼ 84%) gazing at the video. Real-world scenarios are much more complex, and distractors (e.g. other people) are usually less static than in the present study. Possibly, self-reported ED and the specificity index were not associated with the dwell time in positive/negative trials because the static distractors were not interesting enough to capture visual attention for long. Future studies could use more complex distractors, such as videos including actors giving no feedback or neutral feedback.
While ED (self-reported ED and specificity index) was not associated with the viewing time of negative videos, ED predicted a specific viewing style. Participants with a high ED specificity index were more likely to gaze back and forth between video and distractor. They showed active exploratory behaviour. Previous studies have suggested that low ED is associated with using emotion regulation strategies such as avoidance and distraction during negative affective states, while high ED positively correlates with using active approaches, such as information-seeking and problem-solving (e.g. Brown et al., Citation2021). The present study contributes psychophysiological evidence that people with high ED are more likely to process a negative stimulus and its context actively. However, active visual exploration was not associated with self-reported ED and the specificity index during positive trials. This suggests that this type of exploration becomes relevant only when the affect elicited is negative and needs to be regulated. Because active exploration differed between negative and positive videos, it is not surprising that the overall ED measure (i.e. RDEES differentiation) could not predict this behaviour.
Future studies now need to investigate whether this ED-related viewing pattern of negative stimuli is associated with the use of emotion regulation strategies in daily life. If this would be the case, eye-tracking could be used to predict whether a person will use a more active or passive strategy (engagement vs. avoidance) in stressful situations.
4.3. Limitations
We need to mention some limitations of the present study. We studied predominantly young female university students; therefore, the findings cannot be generalised to other groups. The presented trials were less complex than real-world scenarios. This kept the number of possible stimuli-driven confounding variables at a minimum, but the observed gaze behaviour cannot be generalised to more complex visual stimuli. Furthermore, we used a novel open-ended approach to assess ED. Therefore, the present findings may not be generalisable for other ED measures.
4.4. Conclusion
The present eye-tracking study demonstrated that ED is associated with a specific viewing style of negative videos. Participants high in ED showed more active visual exploration of both the negative stimulus and its context (distractor).
SupplementariesJune clean.docx
Download MS Word (274.5 KB)Data availability statement
Data are available at the Open Science Framework: (OSF; https://osf.io/ra7ku/)
Disclosure statement
No potential conflict of interest was reported by the author(s).
Additional information
Funding
Notes
1 Objects such as office supplies are commonly used as neutral distractors in eye-tracking studies Quigley et al. (Citation2012). Rather simple distractors were chosen to avoid a high perceptual load which could have decreased the ability of affective stimuli to capture attention (Yates et al. Citation2010).
2 Each participant viewed the same 12 actors. Each actor gave positive feedback to one half of the participants and negative feedback to the other half of participants. In all paradigms, each actor was shown just once (compare: Wiggert et al., Citation2015).
3 Multilevel model analyses are a deviation from the preregistration. However, Pearson correlations are documented in the supplementary material.
4 Even though valence was not associated with ED specificity in the present study (see Supplementary Table 2), ED and valence are strongly overlapping concepts (Dejonckheere et al., Citation2019). Therefore, we calculated the multiple linear regression to predict negative ED specificity with valence as a third predictor. This model remained significant [F(3,152) = 4.16, p = .007]. However, valence was no significant predictor (p = .57).
References
- Blechert, J., Schwitalla, M., & Wilhelm, F. H. (2013). Ein Video-Set zur experimentellen Untersuchung von Emotionen bei sozialen Interaktionen: Validierung und erste Daten zu neuronalen Effekten. Zeitschrift Für Psychiatrie, Psychologie Und Psychotherapie, 61(2), 81–91. https://doi.org/10.1024/1661-4747/a000145
- Boden, M. T., Thompson, R. J., Dizén, M., Berenbaum, H., & Baker, J. P. (2013). Are emotional clarity and emotion differentiation related? Cognition & Emotion, 27(6), 961–978. https://doi.org/10.1080/02699931.2012.751899
- Brown, B. A., Goodman, F. R., Disabato, D. J., Kashdan, T. B., Armeli, S., & Tennen, H. (2021). Does negative emotion differentiation influence how people choose to regulate their distress after stressful events? A four-year daily diary study. Emotion (Washington, D.C.), 21(5), 1000–1012. https://doi.org/10.1037/emo0000969
- Bynion, T.-M., & Feldner, M. T. (2017). Self-assessment manikin. In V. Zeigler-Hill & T. K. Shackelford (Eds.), Encyclopedia of personality and individual differences (Vol. 25, pp. 1–3). Springer International Publishing. https://doi.org/10.1007/978-3-319-28099-8_77-1
- Dejonckheere, E., Mestdagh, M., Houben, M., Rutten, I., Sels, L., Kuppens, P., & Tuerlinckx, F. (2019). Complex affect dynamics add limited information to the prediction of psychological well-being. Nature Human Behaviour, 3(5), 478–491. https://doi.org/10.1038/s41562-019-0555-0
- Demiralp, E., Thompson, R. J., Mata, J., Jaeggi, S. M., Buschkuehl, M., Barrett, L. F., Ellsworth, P. C., Demiralp, M., Hernandez-Garcia, L., Deldin, P. J., Gotlib, I. H., & Jonides, J. (2012). Feeling blue or turquoise? Emotional differentiation in major depressive disorder. Psychological Science, 23(11), 1410–1416. https://doi.org/10.1177/0956797612444903
- Erbas, Y., Ceulemans, E., Blanke, E. S., Sels, L., Fischer, A., & Kuppens, P. (2019). Emotion differentiation dissected: Between-category, within-category, and integral emotion differentiation, and their relation to well-being. Cognition & Emotion, 33(2), 258–271. https://doi.org/10.1080/02699931.2018.1465894
- Erbas, Y., Ceulemans, E., Koval, P., & Kuppens, P. (2015). The role of valence focus and appraisal overlap in emotion differentiation. Emotion (Washington, D.C.), 15(3), 373–382. https://doi.org/10.1037/emo0000039
- Erbas, Y., Ceulemans, E., Lee Pe, M., Koval, P., & Kuppens, P. (2014). Negative emotion differentiation: Its personality and well-being correlates and a comparison of different assessment methods. Cognition & Emotion, 28(7), 1196–1213. https://doi.org/10.1080/02699931.2013.875890
- Gremsl, A., Schwab, D., Höfler, C., & Schienle, A. (2018). Placebo effects in spider phobia: An eye-tracking experiment. Cognition & Emotion, 32(8), 1571–1577. https://doi.org/10.1080/02699931.2017.1422698
- Kang, S-M, & Shaver, P. R. (2004). Individual differences in emotional complexity: Their psychological implications. Journal of Personality, 72(4), 687–726. https://doi.org/10.1111/j.0022-3506.2004.00277.x
- Koole, S. L. (2009). The psychology of emotion regulation: An integrative review. Cognition & Emotion, 23(1), 4–41. https://doi.org/10.1080/02699930802619031
- Kuder, G. F., & Richardson, M. W. (1937). The theory of the estimation of test reliability. Psychometrika, 153–160.
- Lee, J. Y., Lindquist, K. A., & Nam, C. S. (2017). Emotional granularity effects on event-related brain potentials during affective picture processing. Frontiers in Human Neuroscience, 11, 133. https://doi.org/10.3389/fnhum.2017.00133
- Lehrl, S., Triebig, G., & Fischer, B. (1995). Multiple choice vocabulary test MWT as a valid and short test to estimate premorbid intelligence. Acta Neurologica Scandinavica, 91(5), 335–345. https://doi.org/10.1111/j.1600-0404.1995.tb07018.x
- Matthews, M., Webb, T. L., Shafir, R., Snow, M., & Sheppes, G. (2021). Identifying the determinants of emotion regulation choice: A systematic review with meta-analysis. Cognition & Emotion, 35(6), 1056–1084. https://doi.org/10.1080/02699931.2021.1945538
- O’Toole, M. S., Renna, M. E., Elkjær, E., Mikkelsen, M. B., & Mennin, D. S. (2020). A systematic review and meta-analysis of the association between complexity of emotion experience and behavioral adaptation. Emotion Review, 12(1), 23–38. https://doi.org/10.1177/1754073919876019
- Ottenstein, C. (2020). Emotion regulation effectiveness accounts for the associations of self-reported emotion differentiation with well-being and depression. Cognition & Emotion, 34(5), 994–1002. https://doi.org/10.1080/02699931.2019.1691506
- Ottenstein, C., & Lischetzke, T. (2020). Development of a novel method of emotion differentiation that uses open-ended descriptions of momentary affective states. Assessment, 27(8), 1928–1945. https://doi.org/10.1177/1073191119839138
- Quigley, L., Nelson, A. L., Carriere, J., Smilek, D., & Purdon, C. (2012). The effects of trait and state anxiety on attention to emotional images: An eye-tracking study. Cognition & Emotion, 26(8), 1390–1411. https://doi.org/10.1080/02699931.2012.662892
- Schofield, C. A., Johnson, A. L., Inhoff, A. W., & Coles, M. E. (2012). Social anxiety and difficulty disengaging threat: Evidence from eye-tracking. Cognition & Emotion, 26(2), 300–311. https://doi.org/10.1080/02699931.2011.602050
- Schönbrodt, F. D., & Perugini, M. (2013). At what sample size do correlations stabilize? Journal of Research in Personality, 47(5), 609–612. https://doi.org/10.1016/j.jrp.2013.05.009
- Seah, T. H. S., & Coifman, K. G. (2022). Emotion differentiation and behavioral dysregulation in clinical and nonclinical samples: A meta-analysis. Emotion (Washington, D.C.), 22(7), 1686–1697. https://doi.org/10.1037/emo0000968
- Tombaugh, T. (1999). Normative data stratified by age and education for two measures of verbal fluency FAS and animal naming. Archives of Clinical Neuropsychology, 14(2), 167–177. https://doi.org/10.1016/S0887-6177(97)00095-4
- Tugade, M. M., Fredrickson, B. L., & Barrett, L. F. (2004). Psychological resilience and positive emotional granularity: Examining the benefits of positive emotions on coping and health. Journal of Personality, 72(6), 1161–1190. https://doi.org/10.1111/j.1467-6494.2004.00294.x
- Wiggert, N., Wilhelm, F. H., Reichenberger, J., & Blechert, J. (2015). Exposure to social-evaluative video clips: Neural, facial-muscular, and experiential responses and the role of social anxiety. Biological Psychology, 110, 59–67. https://doi.org/10.1016/j.biopsycho.2015.07.008
- Yates, A., Ashwin, C., & Fox, E. (2010). Does emotion processing require attention? The effects of fear conditioning and perceptual load. Emotion (Washington, D.C.), 10(6), 822–830. https://doi.org/10.1037/a0020325