
 ?Mathematical formulae have been encoded as MathML and are displayed in this HTML version using MathJax in order to improve their display. Uncheck the box to turn MathJax off. This feature requires Javascript. Click on a formula to zoom.
ABSTRACT
People prefer prototypical stimuli over atypical stimuli. The dominant explanation for this prototype preference effect is that prototypical stimuli are processed more fluently. However, a more recent account proposes that prototypes are more strongly associated with their category’s valence, leading to a reversed prototype preference effect for negative categories. One critical but untested assumption of this category-valence account is that no prototype preference should emerge for entirely neutral categories. We tested this prediction by conditioning categories of dot patterns positively, negatively, or neutrally. In line with previous findings on the category-valence account, prototype preference reversed for negatively conditioned categories. However, prototype preference was similarly strong for positive and neutral categories. These findings imply that prototype preferences do not only reflect a transfer of category valence to exemplars. Instead, the results suggest that prototype preference is a multi-process phenomenon arising from the activated category valence and a fluency-based process. We discuss further implications for theories on fluency and prototype preference.
People prefer prototypical stimuli over less typical stimuli within a category, known as the prototype preference effect (PPE; Winkielman et al., Citation2006; often also called beauty-in-averageness; Langlois et al., Citation1994). This effect emerges across a variety of stimulus categories, such as faces (Ryali et al., Citation2020), animals (Halberstadt & Rhodes, Citation2003), and consumer products (Landwehr et al., Citation2011). Beyond mere likability, protoypicality has been shown to predict real-life outcomes such as dating preferences (Chopik & Johnson, Citation2021) or sales of cars (Landwehr et al., Citation2011).
The dominant explanation for the PPE is that typical stimuli are processed more fluently than atypical stimuli (Winkielman et al., Citation2006). According to the hedonic fluency model (Reber et al., Citation2004), fluent processing feels positive, and this positive affect is misattributed to the respective stimulus. Such a fluency-based explanation can explain why the PPE emerges across different stimulus classes. It can also explain specific instances when PPE does not emerge (e.g. if specific category exemplars are highly fluent; Carr et al., Citation2017; Vogel et al., Citation2018). Empirically, the relationship between typicality and fluency is well supported (Mervis & Rosch, Citation1981; Winkielman et al., Citation2006).
Recently, Vogel et al. (Citation2021) proposed an alternative explanation of the PPE. They argued that prototypes are also the most representative exemplars of their respective category and thus, are more likely to be associated with the category’s characteristic attributes, such as the category’s valence. Prototypes are therefore more likely to be associated with the category valence, which should lead to a standard PPE for positive categories but a reversed PPE for negative categories. In support of this account, almost all earlier studies on PPE had relied on moderately positive categories, such as faces, watches, or birds. However, a few studies employing stereotypically more negative categories (e.g. spiders) had failed to find the PPE (Halberstadt, Citation2006).
Vogel et al. (Citation2021) adapted an established PPE paradigm to systematically test this category-valence explanation, exposing participants to exemplars of randomly generated dot pattern categories. Crucially, their experiments showed these dot patterns together with positive or negative pictures. One dot pattern category was paired with positive and the other with negative pictures. Such a procedure is known as an Evaluative Conditioning (EC) procedure (De Houwer, Citation2007), defined as the change in liking of an initially neutral conditioned stimulus due to its pairing with a positive or negative unconditioned stimulus (US). EC allows for generating positive or negative stimulus categories in a highly controlled setting without any confounds inherent in naturally positive or negative categories (Glaser & Kuchenbrandt, Citation2017; Hütter et al., Citation2014; Hütter & Tigges, Citation2019; Ingendahl et al., Citation2023). After this EC procedure, Vogel et al. (Citation2021) let participants evaluate different exemplars of the two categories: the previously unshown prototypes, one previously shown exemplar, and one previously unshown exemplar of each category. In line with their prediction, there was a robust PPE for positively conditioned categories: Prototypes were evaluated more favourably than less typical exemplars. Crucially, this PPE reversed for negatively conditioned categories (see Alves et al., Citation2022, for a conceptual replication). Furthermore, response times from a classification task indicated that prototypes were processed more fluently, also for negatively conditioned categories.
These findings speak for the category-valence account and are difficult to explain with the hedonic fluency account. However, the question arises whether the category-valence account is entirely sufficient to explain the various demonstrations of the PPE in previous research, in which the category valence was not known. As mentioned before, this explanation rests on the untested assumption that the default valence of a category is somewhat positive. Critically, the category-valence account makes one central prediction that has not been tested so far. If the (reversed) PPE arises exclusively from the prototype’s strong association with the category valence, then no PPE should exist for entirely neutral categories. For an entirely neutral category, differences in the association with the category valence cannot lead to differences in the evaluation of stimuli. Even under the assumption that neutral valence is moderately positive through the absence of aversive stimuli (Zajonc, Citation2001), the PPE should at least be more pronounced for positive than neutral category valence. In contrast, if the PPE were similarly strong for positive and neutral valence, this would imply that the PPE cannot be explained exclusively by the category-valence account.
In the present research, we tested this central prediction of the category-valence account. We relied on the exact same experimental paradigm by Vogel et al. (Citation2021; Experiment 2) but also included a neutral category. This setup allowed testing the critical prediction of the category-valence account that the PPE reverses for negative categories. However, it also allowed testing whether the category-valence account fully explains the PPE by comparing the PPE for positive and neutral categories.
Methods
Our experiment was an extended replication of Experiment 2 by Vogel et al. (Citation2021) with an additional neutral valence category. We provide all data, materials, and analysis scripts at https://doi.org/10.17605/OSF.IO/PKFHJ.
Design & participants
This experiment followed a 3 (category valence: positive vs. neutral vs. negative) x 3 (typicality: prototype vs. old exemplar vs. new exemplar) within-subjects design. We aimed at a sample size of 80 participants, the same as Experiment 2 of Vogel et al. (Citation2021). This sample size was sufficient to capture small-to-medium within-subjects effects of dz = .32 with 80% power (Faul et al., Citation2007). We collected the data shortly before the Covid-19 pandemic at our local university. We could recruit 82 students (76% female, MAge = 22.51). Incentives were either course credit or 6€, and sweets.
Procedure
We built the experiment in OpenSesame (Mathôt et al., Citation2012). After providing informed consent, participants learned that this study investigated how people process visual stimuli. Afterward, they went through six experimental blocks, each consisting of a conditioning phase and an evaluation phase.
At the beginning of each conditioning phase, we instructed participants to merely look at the following screens showing dot patterns together with pictures. Three categories of randomly generated dot patterns were presented together with positive, neutral, or negative US pictures. Each category had 28 dot patterns serving as the category exemplars (further details are reported in the materials section below). A random positive (or neutral or negative) US was drawn from the stimulus pool for each trial. After a blank screen of 600 ms, one dot pattern and one US picture appeared simultaneously for 3000 ms. Each dot pattern was presented exactly once, and the 84 trials were presented in random order. We counterbalanced between blocks whether a dot pattern or a US picture appeared on the right/left side of the screen. We never mentioned in the instructions that the dot pattern belonged to three different categories, ensuring an entirely unsupervised learning of the categories.
After the conditioning phase, we told participants they should now evaluate a random selection of the dot patterns. Participants next evaluated nine dot patterns in random order. Three of these dot patterns were the category prototypes, which had not been shown before in the conditioning phase. The other six dot patterns were one previously shown dot pattern and one newly generated dot pattern from each category. After a fixation cross of 500 ms, a single dot pattern was presented on a single slide with the question “How much do you like this pattern?” and a 9-point scale (with the labels 1 = not at all to 9 = very much).Footnote1 Participants gave their responses by pressing the number keys.
After finishing the six blocks, participants provided sociodemographic data. Finally, they were debriefed, thanked, and dismissed. In line with our university's ethics committee guidelines, the experiment did not require specific approval.
Materials
In line with previous research on prototype preference, we generated the dot pattern categories anew for each block based on an algorithm by Posner and Keele (Citation1968). One exemplary pattern set is provided in . The software first generated a dot pattern for each category by randomly placing eight dots on a 30 × 30 grid. This pattern served as the category prototype and was not presented during the conditioning phase. The software generated the category exemplars by moving each dot with a specific probability by one, two, three, or four units up, up-right, etc., from its initial position. As in the original experiment, we used four distortion levels (see ), thus creating more and less typical category exemplars. The conditioning phase contained seven exemplar patterns from each distortion level. The evaluation phase only had the category prototype and exemplars from the third distortion level.
Table 1. Probabilities of dot movement by distortion level.
We used the same 50 positive and 50 negative pictures from the International Affective Picture System (Lang et al., Citation2008) as Vogel et al. (Citation2021; Experiment 2) for the positive and negative USs. Our neutral US pictures were ad hoc generated compounds of grey rectangles with different shades.Footnote2 To ensure that the neutral USs were indeed neutral, we conducted a pretest with 12 participants (75% female, M = 24.75) where 20 of these compounds were tested. Participants first saw 21 pairings of random dot patterns with positive, neutral, or negative pictures (seven per valence category). We included this exposure phase in the pretest to make the task more similar to the actual experiment. Afterward, participants evaluated 12 of the shown pictures (four per valence level) in random order on a continuous slider ranging from “very negative” (1) to “very positive” (100). Participants evaluated the positive pictures positively, M = 83.48, SD = 7.49, the negative pictures negatively, M = 15.63, SD = 9.91, and the neutral pictures neutrally, M = 51.54, SD = 3.66. The neutral pictures did not differ significantly from the scale midpoint of 50.5, t(11) = 0.99, p = .345. A list of all IAPS pictures, the 20 pretested neutral USs, and the Opensesame file of the experiment are provided on the OSF.
Results
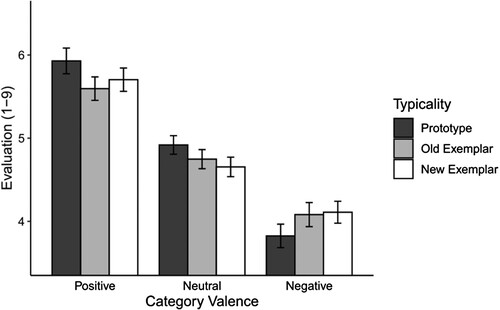
We present the mean evaluations of the dot pattern in . We analysed the evaluations with a multifactorial within-subjects ANOVA. Whenever sphericity was violated, we used Greenhouse Geisser corrections.
Figure 1. Mean evaluation depending on typicality and category valence. Note: Error bars represent the standard error of mean.
There was no overall main effect of typicality, F(1.92, 155.48) = 1.04, p = .353, = .013, CI95% = [.000, .058]. However, there was a strong main effect of category valence, F(1.50, 121.12) = 58.62, p < .001,
= .420, CI95% = [.307, .513], such that evaluations were more positive for the positively conditioned categories than the negatively conditioned categories, with the neutral categories in between (see ).Footnote3 Crucially, this main effect was qualified by a Category Valence x Typicality interaction, F(3.82, 309.27) = 7.10, p < .001,
= .081, CI95% = [.026, .134]. As visualised in , participants evaluated prototypes more positively than exemplars for positive and neutral category valence but more negatively for negative category valence. We conducted a contrast analysis to test the prototype preference effect for each category valence, comparing the prototype against the two exemplars. Both for positive, t(81) = 3.33, p = .001, d = 0.37, CI95% = [0.14, 0.59], and neutral category valence, t(81) = 2.69, p = .009, d = 0.30, CI95% = [0.08, 0.52], this contrast was positive and of similar size. For negative category valence, however, this contrast was negative, t(81) = −3.53, p < .001, d = −0.39, CI95% = [−0.62, 0.16]. Thus, the prototype preference effect differed significantly between positive and negative category valence, t(81) = 4.78, p < .001, d = 0.53, CI95% = [0.30, 0.76], also between neutral and negative category valence, t(81) = 4.39, p < .001, d = 0.49, CI95% = [0.26, 0.72], but not between positive and neutral category valence, t(81) = 0.57, p = .574, d = 0.37, CI95% = [−0.16, 0.28]. Following a reviewer suggestion, we also conducted Bayesian t-tests for these contrasts, revealing very strong evidence for a difference between positive and negative category valence in the PPE, BF10 > 1000, and between neutral and negative category valence, BF10 = 529.43, but moderate evidence against a difference between positive and neutral category valence, BF10 = 0.14.
As a final robustness check, we added the block number as a further within-subjects factor to ensure that participants did not change their evaluation behaviour throughout the experiment. However, the block number had no significant main effect or interaction; all p’s > .125. Detailed results of this ANOVA are provided on the OSF (https://doi.org/10.17605/OSF.IO/PKFHJ).
General discussion
People usually prefer prototypical over atypical exemplars of a category, known as the prototype preference effect (PPE). In the present experiment, we critically tested a recent explanation of the PPE, stating that prototypes are more likely to activate the category’s valence (Vogel et al., Citation2021). For that purpose, we paired exemplars of three dot pattern categories with positive, neutral, or negative pictures and let participants evaluate prototypical and atypical exemplars of these categories. Consistent with the category-valence explanation, there was a standard PPE for positive category valence but a reversed PPE for negative category valence. Crucially, although we ensured that the neutral category valence was indeed neutral, a standard PPE also emerged for neutral category valence, with a similar size as for positive category valence.
The first central implication of this finding is that the category-valence account cannot fully explain the PPE. Otherwise, a neutral category should show no PPE or at least a PPE substantially smaller than the positive category. However, the PPE for neutral category valence was as strong as for positive category valence, which is inconsistent with a pure category-valence explanation. Yet, our experiment showed the critical reversed PPE for negative category valence, a pattern that can so far be only explained by the category-valence account. Thus, our experiment simultaneously shows evidence in favour of the category-valence account but against the category-valence account as a single process underlying the PPE.
One integrative explanation for these results could be that the PPE arises from a two-step process. Irrespective of category valence, prototypes are easier to process and thus elicit an initial positive affective reaction (Winkielman et al., Citation2006). However, more diagnostic information, such as a clearly negative category valence, might overwrite this initial positive affective reaction, leaving the association with the category valence as the sole factor influencing stimulus evaluation (Vogel et al., Citation2021). For prototypes of neutral categories, the neutral category information is not particularly diagnostic and is thus not used to discount the initial positive reaction. Likewise, for prototypes of positive categories, the category valence information is redundant to the positive affective reaction from fluency and thus not particularly informative. Such a two-step process would also allow specific predictions to be tested in future research. First, the initial positive affective reaction might be captured by more spontaneous measures (Winkielman & Cacioppo, Citation2001), leading to a dissociation between deliberate and spontaneous evaluations for prototypes of negative categories. For example, a speeded evaluation task might show a standard PPE, whereas a non-speeded evaluation task should show the same pattern as ours. Second, a standard PPE should occur even for negative categories once the diagnostic valence information is forgotten. Third, manipulating participants’ naïve beliefs about the interpretation of fluency should reduce or increase the moderating impact of category valence (Reber et al., Citation2004; Schwarz, Citation2004).
Beyond the PPE, our research has important implications for research on fluency and evaluative judgments in general. Whereas most research suggests that fluency is an inherently positive experience (Reber et al., Citation2004), other research suggests that fluency might instead amplify affective reactions, even if they are negative (Albrecht & Carbon, Citation2014). Our experiment shows results consistent with both perspectives (Landwehr & Eckmann, Citation2020). For negative categories, fluency (as elicited by higher typicality) amplifies negative reactions. For neutral categories, there is no affect to amplify; the PPE here could only be caused by the hedonic marking of fluency. For positive categories, both hedonic marking and amplification can contribute to the PPE. Thus, our findings support recent research showing evidence for both processes (Landwehr & Eckmann, Citation2020) and suggest that integrative theories that incorporate both hedonic marking and amplification are necessary.
Limitations
There are also some limitations to be mentioned. First, we presented a single experiment; and thus, future studies should replicate our findings. Second, although our paradigm allowed us to create positive, neutral, and negative categories without any confound, future research might further test the processes underlying the PPE by relying on natural categories with an inherent valence to enhance the external validity of our research. Third, the present experiment cannot disentangle effects at learning (i.e. that prototypical stimuli are easier to connect with the category valence) and effects at the judgment (i.e. that category valence is easier retrieved for prototypical stimuli), which might be examined in future studies.
Conclusion
Our experiment shows the relevance of category valence in the prototype preference effect. Replicating previous research (Vogel et al., Citation2021), the effect is reversed for negative categories. Newly, we showed that for neutral categories, a classic preference for prototypes emerges. Thus, the PPE does not solely reflect prototypes’ stronger connections with the category valence. Future reseach may elaborate on a two-stage process, with category valence moderating the PPE at a later stage.
Data availability statement
All data, materials, and analysis scripts can be accessed via https://osf.io/pkfhj/?view_only=729e55a2d8e840c58779cc6db63080a9.
Disclosure statement
No potential conflict of interest was reported by the author(s).
Additional information
Funding
Notes
1 Note that the original wording was in German, where liking something “not at all” means disliking something very much.
2 We explicitly refrained from using “neutral” IAPS pictures for the primariy reason that these pictures are actually often not neutral but ambivalent (Schneider et al., Citation2016).
3 Following a reviewer’s suggestion, we tested whether the difference between positive and neutral category valence was larger than between neutral and negative category valence. We found no significant difference, t(81) = 1.11, p = .269, d = 0.12, CI95% = [-0.10, 0.34], BF10 = 0.22.
References
- Albrecht, S., & Carbon, C.-C. (2014). The Fluency Amplification Model: Fluent stimuli show more intense but not evidently more positive evaluations. Acta Psychologica, 148, 195–203. https://doi.org/10.1016/j.actpsy.2014.02.002
- Alves, H., Uğurlar, P., & Unkelbach, C. (2022). Typical is trustworthy – evidence for a generalized heuristic. Social Psychological and Personality Science, 13(2), 446–455. https://doi.org/10.1177/19485506211031722
- Carr, E. W., Huber, D. E., Pecher, D., Zeelenberg, R., Halberstadt, J., & Winkielman, P. (2017). The ugliness-in-averageness effect: Tempering the warm glow of familiarity. Journal of Personality and Social Psychology, 112(6), 787–812. https://doi.org/10.1037/pspa0000083
- Chopik, W. J., & Johnson, D. J. (2021). Modeling dating decisions in a mock swiping paradigm: An examination of participant and target characteristics. Journal of Research in Personality, 92, 104076. https://doi.org/10.1016/j.jrp.2021.104076
- De Houwer, J. (2007). A conceptual and theoretical analysis of evaluative conditioning. The Spanish Journal of Psychology, 10(2), 230–241. https://doi.org/10.1017/S1138741600006491
- Faul, F., Erdfelder, E., Lang, A.-G., & Buchner, A. (2007). G*Power 3: A flexible statistical power analysis program for the social, behavioral, and biomedical sciences. Behavior Research Methods, 39(2), 175–191. https://doi.org/10.3758/BF03193146
- Glaser, T., & Kuchenbrandt, D. (2017). Generalization effects in evaluative conditioning: Evidence for attitude transfer effects from single exemplars to social categories. Frontiers in Psychology, 8, 103. doi:10.3389/fpsyg.2017.00103
- Halberstadt, J. (2006). The generality and ultimate origins of the attractiveness of prototypes. Personality and Social Psychology Review, 10(2), 166–183. https://doi.org/10.1207/s15327957pspr1002_5
- Halberstadt, J., & Rhodes, G. (2003). It’s not just average faces that are attractive: Computer-manipulated averageness makes birds, fish, and automobiles attractive. Psychonomic Bulletin & Review, 10(1), 149–156. https://doi.org/10.3758/BF03196479
- Hütter, M., Kutzner, F., & Fiedler, K. (2014). What is learned from repeated pairings? On the scope and generalizability of evaluative conditioning. Journal of Experimental Psychology: General, 143(2), 631–643. https://doi.org/10.1037/a0033409
- Hütter, M., & Tigges, D. (2019). On the external validity of evaluative conditioning: Evaluative responses generalize to modified instances of conditioned stimuli. Journal of Experimental Social Psychology, 84, 103824. https://doi.org/10.1016/j.jesp.2019.103824
- Ingendahl, M., Maschmann, I. T., Embs, N. M., Maulbetsch, A., Vogel, T., & Wänke, M. (2023). Articulation dynamics and evaluative conditioning: Investigating the boundary conditions, mental representation, and origin of the in-out effect. Cognition and Emotion, 37(6), 1074–1089. https://doi.org/10.1080/02699931.2023.2228538
- Landwehr, J. R., & Eckmann, L. (2020). The nature of processing fluency: Amplification versus hedonic marking. Journal of Experimental Social Psychology, 90, 103997. https://doi.org/10.1016/j.jesp.2020.103997
- Landwehr, J. R., Labroo, A. A., & Herrmann, A. (2011). Gut liking for the ordinary: Incorporating design fluency improves automobile sales forecasts. Marketing Science, 30(3), 416–429. https://doi.org/10.1287/mksc.1110.0633
- Lang, P. J., Bradley, M. M., & Cuthbert, B. N. (2008). International affective picture system (IAPS): affective ratings of pictures and instruction manual. University of Florida. Tech Rep A-8.
- Langlois, J. H., Roggman, L. A., & Musselman, L. (1994). What is average and what is not average about attractive faces? Psychological Science, 5(4), 214–220. https://doi.org/10.1111/j.1467-9280.1994.tb00503.x
- Mathôt, S., Schreij, D., & Theeuwes, J. (2012). Opensesame: An open-source, graphical experiment builder for the social sciences. Behavior Research Methods, 44(2), 314–324. https://doi.org/10.3758/s13428-011-0168-7
- Mervis, C. B., & Rosch, E. (1981). Categorization of natural objects. Annual Review of Psychology, 32(1), 89–115. https://doi.org/10.1146/annurev.ps.32.020181.000513
- Posner, M. I., & Keele, S. W. (1968). On the genesis of abstract ideas. Journal of Experimental Psychology, 77(3, Pt.1), 353–363. https://doi.org/10.1037/h0025953
- Reber, R., Schwarz, N., & Winkielman, P. (2004). Processing fluency and aesthetic pleasure: Is beauty in the perceiver’s processing experience? Personality and Social Psychology Review, 8(4), 364–382. https://doi.org/10.1207/s15327957pspr0804_3
- Ryali, C. K., Goffin, S., Winkielman, P., & Yu, A. J. (2020). From likely to likable: The role of statistical typicality in human social assessment of faces. Proceedings of the National Academy of Sciences, 117(47), 29371–29380. https://doi.org/10.1073/pnas.1912343117
- Schneider, I. K., Veenstra, L., van Harreveld, F., Schwarz, N., & Koole, S. L. (2016). Let’s not be indifferent about neutrality: Neutral ratings in the International Affective Picture System (IAPS) mask mixed affective responses. Emotion, 16(4), 426–430. https://doi.org/10.1037/emo0000164
- Schwarz, N. (2004). Metacognitive experiences in consumer judgment and decision making. Journal of Consumer Psychology, 14(4), 332–348. https://doi.org/10.1207/s15327663jcp1404_2
- Vogel, T., Carr, E. W., Davis, T., & Winkielman, P. (2018). Category structure determines the relative attractiveness of global versus local averages. Journal of Experimental Psychology: Learning, Memory, and Cognition, 44(2), 250–267. https://doi.org/10.1037/xlm0000446
- Vogel, T., Ingendahl, M., & Winkielman, P. (2021). The architecture of prototype preferences: Typicality, fluency, and valence. Journal of Experimental Psychology: General, 150(1), 187–194. https://doi.org/10.1037/xge0000798
- Winkielman, P., & Cacioppo, J. T. (2001). Mind at ease puts a smile on the face: Psychophysiological evidence that processing facilitation elicits positive affect. Journal of Personality and Social Psychology, 81(6), 989–1000. https://doi.org/10.1037/0022-3514.81.6.989
- Winkielman, P., Halberstadt, J., Fazendeiro, T., & Catty, S. (2006). Prototypes are attractive because they are easy on the mind. Psychological Science, 17(9), 799–806. https://doi.org/10.1111/j.1467-9280.2006.01785.x
- Zajonc, R. B. (2001). Mere exposure: A gateway to the subliminal. Current Directions in Psychological Science, 10(6), 224–228. https://doi.org/10.1111/1467-8721.00154