
ABSTRACT
Introduction: Team sport athletes have increased susceptibility to upper respiratory symptoms (URS) during periods of intensified training and competition. Reactivation of Epstein–Barr Virus (EBV) may be a novel marker for risk of upper respiratory illness (URI) in professional athletes. Aims: To investigate changes in salivary EBV DNA (in addition to the well-established marker, salivary secretory immunoglobulin A), and incidence of URS in professional footballers. Methods: Over a 16-week period (August to November 2016), 15 male players from a professional English football League 1 club provided weekly unstimulated saliva samples (after a rest day) and recorded URS. Saliva samples were analyzed for secretory IgA (ELISA) and EBV DNA (qPCR). Results: Whole squad median (interquartile range) saliva IgA concentration and secretion rate significantly decreased (p < .05) between weeks 8 and 12 (concentration, 107 (76–150) mg/L healthy baseline to 51 (31–80) mg/L at week 12; secretion rate 51 (30–78) µg/min healthy baseline to 22 (18–43) µg/min at week 12). Two players reported URS episodes during week 10, both after IgA secretion rate decreased below 40% of the individual’s healthy baseline. EBV DNA was detected in the weeks before URS but also at other times and in healthy players (overall frequency 40%, range 11–78%) and frequency was similar between the URS and healthy group. Conclusion: These findings confirm salivary IgA as a useful marker of URS risk but EBV DNA was not. Further research capturing a greater number of URS episodes is required, however, to fully determine the utility of this marker.
For team sport athletes, upper respiratory illness (URI) can negatively affect performance either directly via players being unavailable for selection on match days, or indirectly via a loss of training days (Cunniffe et al., Citation2011; Raysmith & Drew, Citation2016). This risk of infection or presenting with related symptoms is multifactorial, related to the combined effects of exposure to infection-causing pathogens and immune status at the time of exposure (i.e. the ability of the immune system to resist infection if the athlete is exposed), (Simpson et al., Citation2020). Exposure is influenced by a variety of factors, some of which can be managed or mitigated by the athlete and/or their support team (often referred to as controllable risk factors,e.g., personal hygiene practices), whereas others are impossible to avoid (termed non-controllable, e.g., travel or contact with other people during competition). Considering both of these points, no biomarkers (e.g., markers of immune status/defenses) can predict URI outcomes with certainty under free-living conditions, because of the unknown nature of natural exposure in these natural conditions. However, some markers can certainly be informative in relation to the risk (i.e. relating to defense against potentially infective pathogens should one be exposed). Saliva secretory immunoglobulin A (s-IgA) is a noninvasive marker that is quick and easy to measure. Increased incidence of URI in professional athletes has been associated with decreased resting saliva s-IgA concentration (Gleeson et al., Citation1999; Neville et al., Citation2008; Tiernan et al., Citation2020) and secretion rate (Fahlman & Engels, Citation2005). Due to the high inter-individual variability of s-IgA there are currently no established clinical reference values for absolute s-IgA concentration or secretion rate, and the level of risk for URI. A model for monitoring changes in s-IgA levels on an individual basis has been provided by Neville et al. (Citation2008) with the risk of URI increasing by 50% when s-IgA levels fall below 40% of the calculated individual healthy baseline. However, this requires the determination of the individualized healthy baseline for each athlete (requiring a period of baseline testing, under conditions of low training stress and general good health), which is not always pragmatic or possible in elite athletes. Furthermore, some longitudinal investigations involving team sport athletes have failed to observe these relationships for s-IgA and URI (Cunniffe et al., Citation2011; Morgans et al., Citation2014), although this may be influenced, to some extent, by low sampling frequency and/or relatively short monitoring periods.
In vivo measures of immunity (representative of the whole integrated immune response) have been suggested to be more valuable and clinically relevant in relation to URI risk (Albers et al., Citation2013; Bermon et al., Citation2017). It has been reported, in elite athletes, that Epstein–Barr Virus (EBV) (in seropositive athletes) can be detected in saliva 4–18 days before the appearance of URS, and may indicate elevated risk (Gleeson et al., Citation2002; Citation2017). EBV is not directly implicated (in a causative way) in these URS but may serve as an in vivo marker of immune function and hence URI risk (i.e. susceptibility to other URI-causing pathogens). EBV is a human herpes virus that is carried by approximately 90% of the general adult population (Pottgiesser et al., Citation2006). After initial primary infection, the virus establishes life-long persistence through colonization of the lymphoid system and subsequent expansion of virally infected B-cells (Yao et al., Citation1985). EBV exhibits a latent lifecycle phase (nonproductive) by remaining dormant in infected B-cells and a lytic lifecycle phase (productive) when viral reactivation, and infection of epithelial cells in the oropharynx, can occur (Chesnokova et al. Citation2009; Kudoh et al., Citation2003). Under normal latent conditions, viral DNA is shed intermittently into, and can be detected in, saliva from within the oropharynx (Faulkner et al., Citation2000) but in the viral productive cycle the EBV genome is amplified approximately 100-fold (Kudoh et al., Citation2003). For this reason it may be hypothesized that a greater frequency of detection and/or increased viral load would be expected under conditions during which host immunity is sub-optimal.
Analysis of saliva for the presence of EBV DNA from the BALF5 gene (an early lytic gene) has typically been used as the marker to determine EBV DNA in saliva, suggesting that viral reactivation and shedding has occurred (Gleeson et al., Citation2002, Citation2017; Reid et al., Citation2004; Yamauchi et al., Citation2011). In a seminal study, Gleeson et al. (Citation2002) monitored a group of 14 elite Australian swimmers for URS over a 30-day period of intensive training, with saliva samples provided every two-to-three days. They reported that detection of EBV DNA in saliva preceded the appearance of URS. Although some theorized that EBV may be mechanistically involved in the etiology of URS in athletes, the fact that EBV was detected between 4 and 18 days before URS presentation suggests it is not a causal factor, but rather indicative of risk (i.e. defenses are lowered, but the precise day of infection, and the specific causative pathogen and incubation period causing the URS presentation were not known, and may vary between cases). Indeed, Cox et al. (Citation2004) administered a herpes virus-specific antiviral agent (Valtrex™) (with activity against herpes viruses but not other respiratory viruses) to a group of elite Australian distance runners. This resulted in an 82% reduction in salivary EBV viral load but there was no reduction in URS. The fact that EBV viral load was reduced but this did not change URS incidence supports the notion that the detection of EBV DNA is indicative of a lack of immune control over latent EBV, but that EBV per se is not implicated in these symptoms (in line with the timings of EBV detection in relation to URS observed by Gleeson et al., Citation2002). This shows that the reduction in immune defense that normally allows EBV reactivation to occur is also indicative of reduced resistance to other URI-causing infections that may gain a foothold during this period and present several days/weeks later (i.e. after the incubation period). Previous EBV studies in athletes have used non- or semiquantitative methods to classify athletes as either positive or negative for EBV DNA (e.g., Gleeson et al., Citation2002, Citation2017; Yamauchi et al., Citation2011). However, since EBV viral DNA is shed intermittently into saliva under normal healthy conditions (Faulkner et al., Citation2000), the simple detection of DNA (i.e. positive vs negative) may not always be indicative of immune control, whereas viral load could give more insight into in vivo immune status (i.e. ability to control EBV) and also be indicative of URS risk (due to a reduced resistance to other URI-causing infections that may gain a foothold during this time). The primary aim of this study, therefore, was to monitor salivary s-IgA and EBV viral load over a four-month period in professional football players and determine whether changes in these markers precede the appearance of URS.
Methods
Participants and design
Over a 16-week period (August to November 2016), including one pre-season sample (in early August), 22 male football players from a professional English football League 1 club volunteered to participate in the study. Players provided saliva samples and completed self-report illness questionnaires on a weekly basis. Players with a high number of missed samples were excluded from the final analyses (two players: one missed five [31% of main study samples] and one missed six [38%] samples. All other players missed no more than three samples [<19%]). Players were also excluded if they did not provide a sample on more than two consecutive sampling time points (five players) during the study period. Fifteen players were included in the final analyses (age 27 ±4 years; two goal keepers, three defenders, eight midfielders, and two strikers). For these 15, a total of 222 saliva samples were analyzed for s-IgA concentration and secretion rate over the 16-week study period. A total of 18 out of a possible 240 (7.5%) saliva samples were not collected due to players being unavailable at the time of collection. Illness questionnaires were completed by all players on all study weeks. Players were retrospectively classified as URS if they experienced at least one URS episode over the 16-week period, or as HEALTHY if they remained free from URS. The study was approved by the University of Kent, Faculty of Sciences Research Ethics and Advisory Group (REAG) and complied with all aspects of the Declaration of Helsinki. All potential participants were informed, both verbally and in writing, of the nature and risks of the study before giving their written consent to take part.
EBV serostatus
EBV serostatus of all participants was determined from finger-tip capillary blood samples (Microvette® CB 300 K2E, Germany) that were provided at the start of the study period, using a viral capsid antigen IgG ELISA kit (DRG Instruments GmbH, Marburg, Germany). All players were EBV positive.
Saliva collection
Timed, unstimulated saliva samples were collected the morning after a full rest day (at least 36 h post-match) and before training between 8:00, 9:00 am on the same morning of each week at the football club’s training facility. Saliva samples were collected as previously described (Davison, Citation2011). Players were required to rinse their mouth with water at least 10 min before the sample (no drinking was permitting within the last 10 min). Although players were advised to be well-hydrated and prepared for their upcoming training, no additional guidance was given on this and hydration status was not assessed. Samples were transported to the laboratory under ice and processed for storage within 60 min. All saliva samples were weighed and then centrifuged at 17,400 g for 5 min and the supernatant was stored as aliquots at −80°C for later analysis. Sample weight was used to determine volume (assuming a density of 1 g/mL), in order to calculate secretion rate (as a product of concentration and flow rate).
Saliva analysis
All saliva samples were analyzed for s-IgA concentration using an in-house enzyme-linked immunosorbent assay (ELISA) based on the method from Leicht et al. (Citation2011), but using a capture antibody specific to secretory IgA (I-6635, Sigma-Aldrich, St Louis, MO, USA), and read on a microplate reader (ELx808 Absorbance Reader, BioTek). The intra-assay CV was 7.0%.
For the URS players (n = 2), DNA extractions were carried out on all saliva samples that were collected during the illness episode, as well as the four most recent weekly saliva samples collected before the appearance of symptoms and also the three samples collected after the cessation of symptoms. An additional six players’ saliva samples that were time-matched to the URS players’ illness episodes, as well as pre-season samples for all eight participants, also underwent the DNA extraction process. All extracted saliva samples were analyzed for presence of EBV (BALF5) DNA.
DNA extractions were carried out using a commercially available kit (Quick-DNA Mini Prep Plus, D4068, Zymo Research, Irvine, CA, USA). Measurement of EBV DNA was performed by quantitative (real-time) polymerase chain reaction (qPCR) targeting a fragment of the BALF5 gene. The assay was designed via the Roche Universal Probe Library (UPL) assay design system (https://lifescience.roche.com/en_gb/articles/Universal-ProbeLibrary-System-Assay-Design.html) and with a UPL Probe (Probe 11, cat. no. 04685105001, Roche, Basel, Switzerland), and primers (Forward, GGA GCT GGA CAT GCT CTA CG; Reverse ACA ATC TCC ACG CTG AGG TC) from Eurogentec (Liège, Belgium). The amplicon was 60 nt in length (GGAG CTGG ACAT GCTC TACG CCTT CTTC CAGC TCAT CAGA GACC TCAG CGTG GAGT TTGT). The assay was performed following manufacturer instructions (see further details in online supplementary information: in brief, samples were classified as positive if EBV DNA was detectable (in line with previous studies, e.g., Gleeson et al., Citation2002). For viral load, values were interpolated from a standard curve generated using a serial dilution of known concentrations of EBV DNA. Intra-assay CV was 5.4%.
URS reports and criteria for URS
Players retrospectively recorded illness symptoms on the same morning of each week (Monday morning) using a self-report questionnaire. For study weeks when players were unable to provide a saliva sample their illness symptoms for that week were still recorded. The questionnaire was based on the methods of Gleeson et al. (Citation2011) and required participants to recall URS from the previous seven days. All participants were fully educated with respect to the symptoms listed on the questionnaire. The self-report questionnaire asked participants to record the presence and severity for several URS. The symptoms included: fever, persistent muscle soreness, sore throat, catarrh in the throat, runny nose, cough, sneezing, joint aches and pains, malaise, and headache, as well as a loss of sleep or inability to train. The severity of each symptom that was present was recorded as either light, moderate, or severe with a respective score of 1, 2, or 3 applied to each rating to allow for quantification of illness symptoms. The sum of all severity scores was calculated on a daily basis. The criteria for an individual URS episode was defined as a total symptom score of ≥12 over at least a three-day period with at least one week between that and another three-day period with a total symptom score of ≥12 (Gleeson et al., Citation2011). If symptoms (three-day ≥12) were recorded by an individual less than one week apart, they were classified as the same episode.
Home and away matches and regular playing details
The number of matches per week, whether they were home or away and information on whether a player was named as a starter or as a substitute, and the number of minutes played in first team matches, were recorded for each player for all matches and used to classify them as regular starters or nonstarters (see online supplementary material).
Statistical analysis
Normally distributed data are expressed as mean (±SD) with non-normally distributed data expressed as the median and interquartile range (IQR). Statistical significance was accepted at the P < .05 level.
Healthy baseline s-IgA values for concentration and secretion rate were calculated for each player as the mean of all samples during which they were free from URS (Neville et al., Citation2008). Any saliva samples provided within ±14 days of the onset of an illness episode or its resolution were not included in the healthy baseline calculation. Individual relative s-IgA values were then calculated for each saliva sample as the percentage of individual healthy baseline scores.
A one-way repeated measures ANOVA was used to analyze whole squad weekly absolute and relative s-IgA concentration and secretion rate (with Bonferroni-corrected post hoc paired t-tests used where necessary). Additionally, a two-way repeated measures ANOVA was used to examine differences in s-IgA levels between players classified as regular starters and nonstarters (see online supplementary material). Any data found to be non-normally distributed were normalized using log transformation (whole squad s-IgA absolute concentration, and whole squad absolute and relative secretion rate) for statistical analysis. An independent samples t-test was used to analyze the difference in healthy baseline s-IgA concentration and secretion rate values between regular starters and nonstarters. Effect sizes were calculated as the difference in means divided by the pooled standard deviation (Hedges’ g).
Results
URS
Two players experienced an episode of URS over the 16-week monitoring period (both in week 10), with symptoms lasting for four days (participant 5, P5) and seven days (participant 8, P8). For both players relative s-IgA concentration () and secretion rate () were <40% of the calculated individual healthy baseline. A further seven players experienced one study week when their relative s-IgA concentration was less than 40% of the calculated healthy baseline but did not report any illness symptoms. For these players these reductions occurred at week five (one case), week seven (one case), week nine (one case), week 10 (one case), and week 12 (five cases). Five of these seven players also experienced one study week when their relative s-IgA secretion rate was less than 40% of the calculated healthy baseline: at week one (one case), week two (one case), week nine through to 11 (one case), week 11 (one case), and week 12 (four cases). In total, nine players presented with a decrease in relative s-IgA concentration and/or secretion rate to <40% of baseline and 22% of these (2/9) experienced a URS. For comparison 0% of the players who maintained relative s-IgA concentration (0/6) or secretion rate (0/7) >40% of baseline experienced a URS.
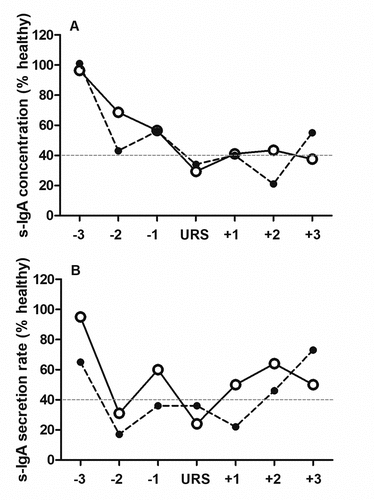
Figure 1. Relative s-IgA concentration (A) and secretion rate (B) for the three weeks pre-URS, during URS, and three weeks post URS for player (ID) 5 (solid line) and 8 (dashed line).
Secretory immunoglobulin A
For s-IgA concentration, both absolute and individual relative s-IgA concentrations were significantly lower in all weeks from 8 to 12 inclusive, in comparison to week 1 (, p < .05). In the two players who presented with URS, the lowest concentration observed during the three weeks before URS presentation () was 50.0 ± 9.9% of healthy baseline values (compared to 56.5 ± 18.6% in the rest of the squad during the same time period, which was not significantly different to the URS players, p= .642). Within participant CV was 52%.
Figure 2. Whole squad s-IgA concentration (A) and secretion rate (B) expressed as a percentage of individual healthy baseline values. *p< .05 vs. week 1. Values are mean (± SD).
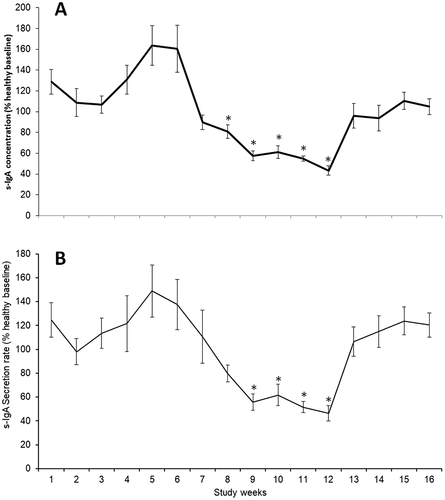
For s-IgA secretion rate, both absolute and individual relative s-IgA secretion rate were significantly lower in all weeks from 9 to 12 inclusive, in comparison to week 1 (, p < .05). In the two players who presented with URS the lowest secretion rate observed during the three weeks before URS presentation () was 24.0 ± 9.9% of healthy baseline values (compared to 57.2 ± 16.7% in the rest of the squad during the same time period, which was significantly different to URS players, p = .019). Within participant CV was 58%.
EBV DNA
A total of 70 saliva samples were analyzed for the presence of EBV DNA. Forty percent of samples were positive for EBV DNA (28/70). The whole group mean (± SD) for individual shedding frequency of BALF5 DNA for all eight players was 40 ± 24%. Individual shedding frequency within each participant ranged from 11% (1/9 positive samples) to 78% (7/9 positive samples), ().
Figure 3. Individual shedding frequency for EBV (BALF5) DNA. Black bars indicate players who experienced URS. Players (ID) 1 and 2 were “nonstarters”. Dashed line indicates mean shedding frequency (40%).
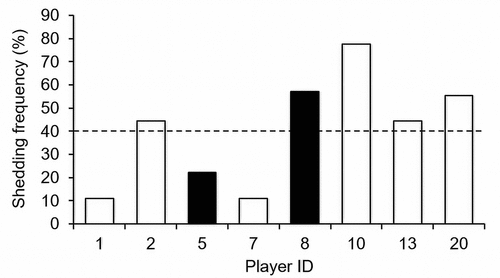
For the two URS players, the mean EBV (BALF5) DNA shedding frequency in the three weeks before the URS episode was 50 ± 24%, and it was detected in both players (100%) at some point in this period (). For the six healthy players shedding frequency in the equivalent three-week period was 44 ± 40% and it was detected in four players (67%) over this period (). There was no difference between URS and healthy players in shedding frequency (P = .866, Hedges’ g = 0.15). The mean for the peak EBV DNA concentration (viral load) detected in the three weeks before episodes was 1.72 ± 2.34 × 10⁻⁹ ng/µL in the healthy group and 2.99 ± 1.58 × 10⁻⁹ ng/µL in the URS group. There was no significant difference between URS and healthy players but a medium effect size was observed (P = .512, Hedges’ g = 0.57).
Table 1. Detection of BALF5 DNA in saliva provided during study weeks 6–10.
Match load
Twenty-six competitive matches were played during the 16-week monitoring period. Within this there were two notable periods of three consecutive weeks in which two matches were played per week (weeks 3–5 and weeks 8–10). For the period between weeks three–five, away games comprised 33% (2/6) of these matches. For the period between weeks 8–10, away games comprised 67% (4/6) of these matches. There was no difference between regular starters (n = 9) and nonstarters (n = 6) for any s-IgA responses (see online supplementary material).
Discussion
The primary aim of this study was to investigate the utility of monitoring saliva EBV DNA and s-IgA for evaluating risk of URS in professional team sport athletes. The main findings show that s-IgA concentration and secretion rate were significantly decreased, beginning from week eight, in advance of the two player reported URS episodes in week 10. Interestingly, this also coincided with the period that featured the most consecutive away games. In players who presented with URS, EBV (BALF5) DNA was detected in 100% at some point in the three-week period before presentation and in 67% of players who remained URS free over the same period (), although there was large variability in shedding frequency and a wide range of viral loads detected. However, due to the low number of URS episodes experienced (n = 2) it is difficult to make any firm inferences from this. Despite this, the fact that there was a medium effect size for higher peak EBV viral load in URS players compared to healthy players, in the weeks before an episode presented in URS players, warrants further investigation. It is interesting that there was a small effect size for the difference between URS and healthy players in shedding frequency but a medium effect size for the difference between URS and healthy players in peak viral load in this period. This points toward viral load being more informative, in terms of in vivo immune status and URS risk than a simple dichotomous classification of positive/negative. It also supports the theory that the detection of EBV DNA may be related to a lack of immune control over latent EBV that is also indicative of a general reduction in immune defenses. However, due to the small sample size these findings are preliminary and to explore this further, larger samples and/or capturing a higher number of URS episodes is required.
For team sport athletes, a congested fixture schedule or heavy periods of training can lead to a reduction in resting s-IgA levels (Cunniffe et al., Citation2011; Fahlman & Engels, Citation2005; Morgans et al., Citation2014; Yamauchi et al., Citation2011). A congested fixture schedule can influence physical demands, but could also impart other stressors related to, for example, travel. In the present study, s-IgA concentration and secretion rate were significantly reduced during weeks 8–12 when the team played nine matches over a period of 35 days. Although we were not able to accurately determine individual player physical loads, and we cannot classify this period as any more “congested” than others within the study (e.g., weeks three–five), it was interesting that this period from weeks 8–10 featured a higher proportion (four of six) of matches away from home, which did not occur at any other time during the monitoring period. The two illness episodes in the present study presented when relative s-IgA concentration and secretion rate fell significantly, although in the weeks before URS presentation this dropped below 40% of healthy baseline (and differed from the healthy players) only for secretion rate (not for concentration). This may suggest secretion rate is more sensitive and useful as a risk predictor in these players. It is worthy of note that seven other individuals also experienced one week when their s-IgA concentration and/or secretion rate were reduced by a similar amount. This demonstrates the multifactorial nature of URS risk as mucosal immune status is just one factor that can influence risk of experiencing URS (Simpson et al., Citation2020). Indeed, exposure to URI-causing pathogens is a key risk factor, regardless of immune status, so it is possible that the other players were not exposed during this time. It is also interesting that the two players who did experience URS during the monitoring period lived with young children (under five years of age), which could contribute to increased exposure and risk of transmission (Petrie et al., Citation2013), whereas none of the other players lived with children under five years at this time.
The physical load of training and match play was not measured in this study, which is an obvious limitation. Players could therefore only be identified as either regular first team starting players or regular substitutes based on the number of minutes played in first team matches. There was no difference in s-IgA concentration or secretion between the regular starters and nonstarters in mean healthy baseline values or at any time point throughout the monitoring period. These findings highlight that changes in s-IgA levels are responsive to more than just fluctuations in the physical load of competitive match play (including training and travel to matches), but it is worthy of note that the weekly training load is more similar between players because of the regular training that is undertaken on non-match days. All players in the first team squad experienced a reduction in relative s-IgA concentration and secretion rate during weeks 8–12, following the period with a high proportion of double-match weeks involving away games. Furthermore, the significant decline in s-IgA levels seen in week eight was preceded by two consecutive away fixtures. Traveling for away fixtures could have a negative effect on immunity via a disruption in nutrition, a reduction in sleep quality, and psychological stress. Sleep has been shown to be disturbed following evening matches in professional rugby players (Eagles et al., Citation2016) and subjectively reported sleep duration in professional football players (Fullagar et al., Citation2016). Psychological stress is known to be a significant factor in the regulation of s-IgA levels (Engeland et al., Citation2016). Furthermore, both reduced sleep (Prather et al., Citation2015) and higher levels of psychological stress (Cohen et al., Citation1991) have been shown to reduce resistance to the common cold in human viral challenge studies with URI-causing viruses (rhinovirus, respiratory syncytial virus, or coronavirus). Measurement of these additional sources of stress and immune perturbation could be included in future investigations in order to further understand the impact of each individual risk factor on overall immune health and URI risk. The inclusion of a non-playing control group (e.g., support staff and coaches at the football club) exposed to the same psychologically stressful environment, disruptions to sleep and nutrition routines, as well as the same changes in season and climate, and exposure to infections during work hours would be useful additions for future studies.
s-IgA is known to be highly variable within and between individuals. The within-player CV for absolute s-IgA concentration reported here is similar to other investigations with professional athletes (Gleeson et al., Citation1999; Neville et al., Citation2008). Other research has emphasized the importance of monitoring changes in s-IgA levels on an individual basis (Cunniffe et al., Citation2011; Gleeson et al., Citation2017; Neville et al., Citation2008) and high sampling frequency is key to allow useful individual monitoring. A strength of the present study is the protocol of weekly sampling that was used throughout the 16-week monitoring period. Furthermore, s-IgA production follows a circadian rhythm of peak production in the morning that declines throughout the day (Li & Gleeson, Citation2004). Our ability to collect samples at the same time of day each week, and after at least 36 h of match recovery, therefore also helped to reduce a potential source of additional variation in the saliva samples. This is not always possible to control in studies involving professional athletes. It would have been beneficial to monitor for longer periods and in subsequent seasons in order to capture more URS events. However, due to staffing changes at the club, measurement was only possible for the times reported here. These findings are therefore preliminary, but do provide useful insight into tools that may have practical relevance and should be considered in future studies in this field.
Conclusions
The results of this investigation confirm salivary IgA as a useful marker of URS risk but it is unclear if EBV DNA adds further utility. Monitoring changes in EBV (BALF5 gene) viral load was not a useful predictor in this study but, given the low number of URS episodes recorded, high variability for salivary EBV DNA detection, and possible larger effect size between URS and healthy players with the viral load method over dichotomous classifications, the utility of this measure requires further study with higher numbers of URS episodes captured.
Supplemental Material
Download MS Word (72.3 KB)Supplementary material
Supplemental data for this article can be accessed on the publisher’s website.
References
- Albers, R., Bourdet-Sicard, R., Braun, D., Calder, P. C., Herz, U., Lambert, C., Lenoir-Wijnkoop, I., Méheust, A., Ouwehand, A., Phothirath, P., Sako, T., Salminen, S., Siemensma, A., Van Loveren, H., & Sack, U. (2013). Monitoring immune modulation by nutrition in the general population: Identifying and substantiating effects on human health British Journal of Nutrition, 110(S2), S1–30. https://doi.org/10.1017/S0007114513001505
- Bermon, S., Castell, L. M., Calder, P. C., Bishop, N. C., Blomstrand, E., Mooren, F. C., Krüger, K., Kavazis, A. N., Quindry, J. C., Senchina, D. S., Nieman, D. C., Gleeson, M., Pyne, D. B., Kitic, C. M., Close, G. L., Larson-Meyer, D. E., Marcos, A., Meydani, S. N., Wu, D., Walsh, N. P., & Nagatomi, R. (2017). Consensus statement immunonutrition and exercise Exercise Immunology Review, 23, 8–50. https://pubmed.ncbi.nlm.nih.gov/28224969/
- Chesnokova, L. S., Nishimura, S. L., & Hutt-Fletcher, L. M. (2009). Fusion of epithelial cells by Epstein-Barr virus proteins is triggered by binding of viral glycoproteins gHgL to integrins alphavbeta6 or alphavbeta8 Proceedings of the National Academy of Sciences, 106(48), 20464–20469. https://doi.org/10.1073/pnas.0907508106
- Chidley, C. (2018). Training, nutrition and exercise immunology: The use of salivary Epstein Barr Virus DNA as a marker of in vivo immunity [Doctor of Philosophy (PhD) thesis]. University of Kent, availabe from Kent Academic Repository (KAR): https://kar.kent.ac.uk/69956/
- Cohen, S., Tyrrell, D. A., & Smith, A. P. (1991). Psychological stress and susceptibility to the common cold New England Journal of Medicine, 325(9), 606–612. https://doi.org/10.1056/NEJM199108293250903
- Cox, A. J., Gleeson, M., Pyne, D. B., Saunders, P. U., Clancy, R. L., & Fricker, P. A. (2004). ValtrexTM therapy for Epstein-Barr Virus reactivation and upper respiratory symptoms in elite runners Medicine & Science in Sports & Exercise, 36(7), 1104–1110. https://doi.org/10.1249/01.MSS.0000131957.40985.2B
- Cunniffe, B., Griffiths, H., Proctor, W., Davies, B., Baker, J. S., & Jones, K. P. (2011). Mucosal immunity and illness incidence in elite rugby union players across a season Medicine & Science in Sports & Exercise, 43(3), 388–397. https://doi.org/10.1249/MSS.0b013e3181ef9d6b
- Davison, G. (2011). Innate immune responses to a single session of sprint interval training Applied Physiology, Nutrition, and Metabolism, 36(3), 395–404. https://doi.org/10.1139/h11-033
- Eagles, A., Mclellan, C., Hing, W., Carloss, N., Lovell., D. (2016). Changes in sleep quantity and efficiency in professional rugby union players during home based training and match-play The Journal of Sports medicine and Physical Fitness, 56(5), 565–571. https://www.minervamedica.it/en/journals/sports-med-physical-fitness/article.php?cod=R40Y2016N05A0565
- Engeland, C. G., Hugo, F. N., Hilgert, J. B., Nascimento, G. G., Junges, R., Lim, H.-J., Marucha, P. T., & Bosch, J. A. (2016). Psychological distress and salivary secretory immunity Brain, Behavior, and Immunity, 52, 11–17. https://doi.org/10.1016/j.bbi.2015.08.017
- Fahlman, M. M., & Engels, H.-J. (2005). Mucosal IgA and URTI in American College Football Players: A year longitudinal study Medicine & Science in Sports & Exercise, 37(3), 374–380. https://doi.org/10.1249/01.MSS.0000155432.67020.88
- Faulkner, G. C., Krajewski, A. S., & Crawford, D. H. (2000). The ins and outs of EBV infection Trends in Microbiology, 8(4), 185–189. https://doi.org/10.1016/S0966-842X(00)01742-X
- Fullagar, H. H. K., Skorski, S., Duffield, R., Julian, R., Bartlett, J., & Meyer, T. (2016). Impaired sleep and recovery after night matches in elite football players Journal of Sports Sciences, 34(14), 1333–1339. https://doi.org/10.1080/02640414.2015.1135249
- Gleeson, M., Bishop, N. C., Oliveira, M., & Tauler, P. (2011). Daily probiotic’s (Lactobacillus casei Shirota) reduction of infection incidence in athletes International Journal of Sport Nutrition and Exercise Metabolism, 21(1), 55–64. https://doi.org/10.1123/ijsnem.21.1.55
- Gleeson, M., McDonald, W. A., Pyne, D. B., Cripps, A. W., Francis, J. L., Fricker, P. A., & Clancy, R. L. (1999). Salivary IgA levels and infection risk in elite swimmers Medicine & Science in Sports & Exercise, 31(1), 67–73. https://doi.org/10.1097/00005768-199901000-00012
- Gleeson, M., Pyne, D. B., Austin, J. P., Lynn Francis, J., Clancy, R. L., Mcdonald, W. A., & Fricker, P. A. (2002). Epstein-Barr virus reactivation and upper-respiratory illness in elite swimmers Medicine & Science in Sports & Exercise, 34(3), 411–417. https://doi.org/10.1097/00005768-200203000-00005
- Gleeson, M., Pyne, D. B., Elkington, L. J., Hall, S. T., Attia, J. R., Oldmeadow, C., Wood, L. G., & Callister, R. (2017). Developing a multi-component immune model for evaluating the risk of respiratory illness in athletes Exercise Immunology Review, 23, 52–64. https://pubmed.ncbi.nlm.nih.gov/28230530/
- Kudoh, A., Fujita, M., Kiyono, T., Kuzushima, K., Sugaya, Y., Izuta, S., Nishiyama, Y., & Tsurumi, T. (2003). Reactivation of lytic replication from B cells latently infected with Epstein-Barr virus occurs with high S-Phase cyclin-dependent kinase activity while inhibiting cellular DNA replication. Journal of Virology, 77(2), 851–861. https://doi.org/10.1128/JVI.77.2.851-861.2003
- Leicht, C. A., Bishop, N. C., & Goosey-Tolfrey, V. L. (2011). Mucosal immune responses to treadmill exercise in elite wheelchair athletes. Medicine & Science in Sports & Exercise, 43(8), 1414–1421. https://doi.org/10.1249/MSS.0b013e31820ac959
- Li, T.-L., & Gleeson, M. (2004). The effect of single and repeated bouts of prolonged cycling and circadian variation on saliva flow rate, immunoglobulin A and α-amylase responses. Journal of Sports Sciences, 22(11–12), 1015–1024. https://doi.org/10.1080/02640410410001716733
- Morgans, R., Orme, P., Anderson, L., Drust, B., & Morton, J. P. (2014). An intensive Winter fixture schedule induces a transient fall in salivary IgA in English premier league soccer players. Research in Sports Medicine, 22(4), 346–354. https://doi.org/10.1080/15438627.2014.944641
- Neville, V., Gleeson, M., & Folland, J. P. (2008). Salivary IgA as a risk factor for upper respiratory infections in elite professional athletes. Medicine & Science in Sports & Exercise, 40(7), 1228–1236. https://doi.org/10.1249/MSS.0b013e31816be9c3
- Petrie, J. G., Ohmit, S. E., Cowling, B. J., Johnson, E., Cross, R. T., Malosh, R. E., Thompson, M. G., Monto, A. S., & McVernon, J. (2013, September 25). Influenza transmission in a cohort of households with children: 2010-2011. PLoS One, 8(9), e75339. eCollection. https://doi.org/10.1371/journal.pone.0075339
- Pottgiesser, T., Wolfarth, B., Schumacher, Y. O., & Bauer, G. (2006). Epstein-Barr virus serostatus: No difference despite aberrant patterns in athletes and control group. Medicine & Science in Sports & Exercise, 38(10), 1782–1791. https://doi.org/10.1249/01.mss.0000230122.91264.3f
- Prather, A. A., Janicki-Deverts, D., Hall, M. H., & Cohen, S. (2015). Behaviorally assessed sleep and susceptibility to the common cold. Sleep, 38(9), 1353–1359. https://doi.org/10.5665/sleep.4968
- Raysmith, B. P., & Drew, M. K. (2016). Performance success or failure is influenced by weeks lost to injury and illness in elite Australian track and field athletes: A 5-year prospective study. Journal of Science and Medicine in Sport, 19(10), 778–783. https://doi.org/10.1016/j.jsams.2015.12.515
- Reid, V. L., Gleeson, M., Williams, N., & Clancy, R. L. (2004). Clinical investigation of athletes with persistent fatigue and/or recurrent infections. British Journal of Sports Medicine, 38(1), 42–45. https://doi.org/10.1136/bjsm.2002.002634
- Simpson, R. J., Campbell, J. P., Gleeson, M., Krüger, K., Nieman, D. C., Pyne, D. B., Turner, J. E., & Walsh, N. P. (2020). Can exercise affect immune function to increase susceptibility to infection? Exercise Immunology Review, 26, 8–22. https://pubmed.ncbi.nlm.nih.gov/32139352/
- Tiernan, C., Lyons, M., Comyns, T., Nevill, A. M., & Warrington, G. (2020). Salivary IgA as a predictor of upper respiratory tract infections and relationship to training load in Elite Rugby Union Players. Journal of Strength and Conditioning Research, 34(3), 782–790. https://doi.org/10.1519/JSC.0000000000003019
- Yamauchi, R., Shimizu, K., Kimura, F., Takemura, M., Suzuki, K., Akama, T., Kono, I., & Akimoto, T. (2011). Virus activation and immune function during intense training in rugby football players. International Journal of Sports Medicine, 32(5), 393–398. https://doi.org/10.1055/s-0031-1271674
- Yao, Q. Y., Rickinson, A. B., & Epstein, M. A. (1985). A re-examination of the Epstein-Barr virus carrier state in healthy seropositive individuals. International Journal of Cancer, 35(1), 35–42. https://doi.org/10.1002/ijc.2910350107