
ABSTRACT
Evaluations of the composition and biomass of photoautotrophic periphyton, nutrient concentrations of water, and concentrations of total phosphorous of benthic organic matter at eight stream sites in Middle Tennessee were used to: (1) document the composition of soft-algae and diatom assemblages, (2) assess the trophic state of the stream sites, (3) correlate trophic state to percent composition of soft-algae taxa, and (4) construct biotic indices using soft-algae taxa to help monitor trophic state. The concentration of total phosphorous of benthic organic matter was a more accurate indicator of the trophic state of the stream sites we studied relative to nutrient concentrations of water as demonstrated by correlation coefficients for nutrient concentrations to benthic concentrations of chlorophyll a, ash-free dry mass of benthic organic matter, and biotic indices which denote trophic state using diatom and soft-algae taxa. The algae trophic index developed using soft-algae taxa abundance-weighted averages of benthic concentrations of chlorophyll a correlates significantly to all of the benthic characteristics used to denote trophic state. This index is the first to utilize periphyton characteristics, as opposed to nutrient concentrations of water, to assign trophic-indicator values to soft-algae taxa in lotic systems and does not require a computer program to compute.
Introduction
Algae are a major component of the trophic base of most shallow lotic systems and assemblage composition and functional integrity are key indicators of water quality (Stancheva & Sheath Citation2016). The compositions of soft-algae assemblages of the vast majority of streams in the Interior Plateau Level III Ecoregion (Griffith et al. Citation1997; USGS Citation2016) are unknown. This lack of basic knowledge of a major component of the trophic base limits the ability of watershed managers to measure and monitor the impacts of poor quality water. This work documents the composition of algae assemblages essential to monitor the effects of water quality in eight stream reaches in seven different watersheds in the central region of the Interior Plateau Level III Ecoregion. Relationships between periphyton characteristics and percent composition of soft-algae taxa at sites with varying degrees of anthropogenic impact were used to assess the effects of trophic state on the soft-algae composition of the stream sites.
Estimation of the biomass of photoautotrophic periphyton by measurements of the concentration of benthic chlorophyll (chl) a is one of the most common methods to assess the trophic state of streams (Biggs Citation2000). Dodds et al. (Citation1998) suggested classification of temperate streams with concentrations of benthic chl a ≤ 20 mg.m−2 as oligotrophic and concentrations >70 mg.m−2 as eutrophic. Measurements of the concentration of chl a alone may not be adequate to demonstrate trophic state because the concentration of chl a is influenced by many abiotic and biotic characters (Kurle & Cardinale Citation2011). Nutrient concentrations of water samples, ash-free dry weight of benthic organic matter, and biotic indices are often used to supplement chl a concentration as indicators of trophic state.
Diatom composition is the constituent of photoautotrophic periphyton most widely used to assess trophic state because more autecological information exists for diatoms relative to soft-algae taxa (Rimet Citation2012). The structure of diatom assemblages often reflects the impacts of trophic state and siltation and thus can be used to support proposed best management practices (Smucker & Vis Citation2009). Only a few indices have been developed which utilize soft-algae taxa to evaluate the trophic state of streams (Gutowski et al. Citation2004; Schaumburg et al. Citation2004; Schneider & Lindstrøm Citation2011; Fetscher et al. Citation2014; Lebkuecher et al. Citation2015). The deficiency of the use of soft-algae assemblages as indicators of trophic state is due largely to the fact that the autecology of most soft-algae taxa is poorly understood or unknown (Passy & Larson Citation2011). More assessments of the relationship of nutrient concentrations to the abundance of soft-algae taxa are needed to better understand the impact of eutrophication on lotic systems (Stancheva & Sheath Citation2016).
A majority of streams in the central region of the Interior Plateau level III Ecoregion are nutrient-impaired due largely to nonpoint-source pollution (Lebkuecher et al. Citation2011). The cumulative effects of erosion, agricultural runoff, poorly functioning sewage systems, and urban development result in poor quality water in most watersheds. Our objectives were to document the diversity and composition of photoautotrophic periphyton at eight stream sites in Middle Tennessee, evaluate the trophic state of the stream sites, and examine the relationships of percent composition of soft-algae taxa to characteristics used to denote trophic state. The objectives were met by: (1) determinations of the composition of diatom and soft-algae assemblages, (2) evaluations of the nutrient concentrations of water and characteristics of the benthic communities including biomass, concentrations of chl a, and concentrations of total phosphorous of benthic organic matter, and (3) development of biotic indices based on soft-algae taxa abundance-weighted averages of benthic characteristics as trophic-indicator values.
Methods
Sampling site locations and dates
Eight stream sites were sampled in Middle Tennessee located in the central region of the Interior Plateau Level III Ecoregion of the United States (Appendix 1). The geologic base of the ecoregion is limestone and includes some chert, shale, siltstone, sandstone, and dolomite. The forests are Western Mesophytic and consist largely of Quercus and Carya species (Griffith et al. Citation1997; USGS Citation2016). Stream sites were sampled in May and again in August of the same year to determine the composition of soft-algae and diatom taxa during spring and summer. Four stream sites were sampled in 2015 and four stream sites were sampled in 2016. The four sites sampled in 2015 were sampled on 1 May 2015 or 2 May 2015 and again on 15 August 2015 or 16 August 2015. The four stream sites sampled in 2016 were sampled on 8 May 2016 and again on 1 August 2016 or 11 August 2016. Benthic characteristics including pigment concentrations of photoautotrophic periphyton, ash-free dry mass of benthic organic matter, and concentrations of total phosphorus of benthic organic matter were determined from samples collected August 2015 and August 2016 on the same dates samples were collected to determine algae composition in August 2015 and August 2016.
The choice of stream sites sampled reflects the attempt to pick sites ranging from severely nutrient-impaired to unimpaired based on visual assessments and listings by United States Environmental Protection Agency (USEPA Citation2016). Of the stream sites sampled in 2015, the Suggs Creek site, located in Nashville Tennessee, and the Trace Creek site, located in Waverly, Tennessee, are listed as nutrient-impaired. The Suggs Creek site appeared hypereutrophic with a visibly obvious high concentration of photoautotrophic periphyton. The Flynn and Hurricane Creek sites are both located in rural watersheds less affected by anthropogenic activity relative to most watersheds in Middle Tennessee. Although the Flynn and Hurricane Creek sites are listed as nutrient-unimpaired reference sites (TDEC Citation2009, Citation2016), reference stream sites in Middle Tennessee are not considered truly oligotrophic relative to stream sites in regions of the world with little anthropogenic activity. Of the stream sites sampled in 2016, the Jones Creek site, located 5 km downstream of the Jones Creek Wastewater Treatment Plant, and the McAdoo Creek site, located near Clarksville, TN, are listed as nutrient-impaired. The Marrow Bone and Will Hall Creek sites are not listed as nutrient-impaired or unimpaired by USEPA (Citation2016) and appear relatively nutrient-unimpaired as judged visibly by the relatively low biomass of photoautotrophic periphyton.
Sampling site morphological characteristics
Two transects from the opposing banks and 5 m apart were established at each site. Transect widths and stream depths at 1/3 intervals between the banks of each transect were measured. Stream velocity was determined as the time required for a density-neutral object to travel 5 m downstream. Stream discharge was calculated using the equation from Robins and Crawford (1954):
The percent of benthic substrates smaller than very course gravel was estimated visually in four replicate plots established with 0.25 m2 wire frames placed 1.25 m apart at midstream of each stream site. Canopy angle was estimated visually as the angle between the tops of the vegetation or topography on each bank at midstream. Stream site morphological characteristics were determined to provide more detail of the abiotic characteristics of sampling sites (Appendix 2).
Sampling cobbles to determine benthic characteristics and algae composition
Cobble sampling occurred in the established 5 m reaches at depths between 0.07 and 0.37 m and stream velocities between 0.15 and 0.67 m.s−1 (Appendix 2). Four midstream plots in each reach were established with 0.25 m2 wire frames placed 1.25 m apart. Cobbles nearest to the plot center between 12 and 18 cm diameter with most of the surface area for periphyton growth parallel to flow were removed. Four cobbles, one from each of the four plots, were used to determine the percent composition of soft-algae and diatom taxa. Algae were removed from cobbles in the field using a single-edge razor blade and scrub brush, preserved in 1% glutaraldehyde adjusted to pH 7.0 with NaOH, and concentrated by settling. Two additional cobbles were collected from each of the four plots per stream reach sampled August 2015 and August 2016. One cobble was used to determine pigment concentrations of photoautotrophic periphyton and ash-free dry mass of benthic organic matter. One cobble was used to determine the concentration of total phosphorous of benthic organic matter. These cobbles were placed in self-sealable plastic bags and transported to the lab on ice in darkness.
Pigment concentrations of periphyton and ash-free dry mass of benthic organic matter
One cobble was placed in a glass pan containing 0.1 L of 90% acetone and periphyton removed with a single-edged razor blade and scrub brush. Ten milliliters aliquots of periphyton suspended in acetone were placed in a mortar, ground with a pinch of sand and a pestle for 2 min, and filtered through Whatman no. 1 filter-paper circles. Optical density (OD) of the supernatant was determined at 664 nm to determine the concentration of chlorophyll (chl) a, then at 665 nm following acidification with 0.1 N HCl to determine the concentration of pheophytin a. Concentrations of chl a and pheophytin a were calculated as described by Eaton et al. (Citation2005).
Periphyton removed from cobble was dried by allowing the acetone to evaporate at 25 oC and ash-free dry mass determined as described by Eaton et al. (Citation2005). Ash-free dry weights were increased by the proportion of the periphyton removed to determine pigment concentrations.
The surface area of cobble from which periphyton was removed was calculated by covering the upper surface of cobble with aluminum foil, weighing the foil, and extrapolating weight to surface area (Hauer & Lamberti Citation2006). Means of periphyton characteristics were compared using Tukey–Kramer Honestly Significant Difference Tests preceded by Analysis of Variance Tests (Zar Citation2007). Assay means were considered significantly different if they differed at the experiment-wise error rate of alpha = 0.05.
Composition of soft-algae assemblages
Large filamentous algae were cut with scissors such that well-mixed aliquots of the sample could be obtained. Wet mounts on a ruled microscope slide (NeoSci, Nashua, New Hampshire) with a 16 mm2 grid divided into eight 2 mm2 squares were used to determine percent composition as described by Woelkerling et al. (Citation1976) and Schoen (Citation1988). Soft-algae within a 2 mm2 square were observed at 100 X, 400 X, and 1000 X magnification and identified to the lowest taxon possible. Taxa were recorded as units. A unit was considered one cell of unicellular taxa, one colony of colonial taxa, and each 10 µm length of filamentous taxa. Taxa were enumerated until at least 800 units counted, or for samples with very little soft-algae relative to diatoms, until at least 20 wet mounts were observed. Primary taxonomic references used to identify soft-algae taxa included Cocke (Citation1967), Prescott (Citation1982), Whitford and Schumacher (Citation1984), Anagnostidis and Komárek (Citation1988), and John et al. (Citation2011). The percent of soft-algae units and diatom units at each site was estimated by counting the number of soft-algae units and diatom units in 2 mm2 squares of the ruled microscope slide until at least 1000 units were counted.
Composition of diatom assemblages
Frustule preparation for permanent mounts followed the methods of Carr et al. (Citation1986). Organic debris and intracellular material were removed by placing concentrated frustules in 2.5% sodium hypochlorite for 1 h. Aliquots of cleaned frustules (50 µL) were pipetted onto glass cover slips, dried at 50 °C, and mounted on glass microscope slides with Permount mounting medium. All valves in the field of view at 1000 X magnification were identified and tallied until a minimum of 200 valves from each stream site were identified, the minimum number required to calculate the pollution tolerance index of diatom assemblages (KDOW Citation2002). Primary taxonomic references used to identify diatom taxa included Patrick and Reimer (Citation1966, Citation1975), Krammer and Lange-Bertalot (Citation1998), and Ponader and Potapova (Citation2007). The permanent mounts are maintained in the Austin Peay State University Herbarium in Clarksville, Tennessee.
Shannon diversity index, evenness, and percent similarity
Shannon diversity index (H’) and evenness (J) of soft-algae and diatom assemblages were calculated by the equations of Shannon and Weaver (Citation1949):where Pi = abundance of species i and S = richness (number of taxa). Percent similarities of diatom and soft-algae assemblages associated with cobble were calculated as the sum of the lower of the two percent composition values for each taxon common to two sites.
Diatom indices
The pollution tolerance index of diatom assemblages (PTI; KDOW Citation2002) was calculated aswhere nj = number of individuals of taxon j, tj = eutrophication-tolerance value (1–4) of taxon j, and N = total number of individuals assigned a eutrophication-tolerance value and tallied to calculate the index. The PTI ranges from 1 (all taxa very tolerant to eutrophic conditions) to 4 (all taxa very intolerant of eutrophic conditions). PTI values ≤2.6 correspond to eutrophic conditions (Lebkuecher et al. Citation2011).
The organic pollution index (OPI) is the percentage of diatoms tolerant of organic pollution listed in Kelly (Citation1998). OPI values of ≤20 indicate the absence of significant organic pollution, 21–40 infers some organic pollution present, and values >40 suggest a significant impact of organic pollution (Kelly Citation1998). The siltation index (SI) is the percentage of motile diatoms (Bahls Citation1993). Motile diatoms are able to avoid being buried and are tolerant of sedimentation. The SI is calculated as percentage of the motile diatoms Navicula senu lato, Nitzschia senu lato, and Surirella (Bahls Citation1993).
Soft-algae assemblage metrics and indices
The relationship of the trophic state of the stream sites with the percent composition of each soft-algae taxon sampled in August 2015 and August 2016 was assessed by calculating the abundance-weighted average (A-WA) for: (1) concentrations of chl a, (2) ash-free dry mass of benthic organic matter, and (3) concentration of total phosphorous of benthic organic matter. A-WA of a stream characteristic for a taxon is the average value of a characteristic weighted by the abundance of the taxon at each site and was calculated aswhere A-WAj is the abundance-weighted average of a stream characteristic for taxonj, nj = number of taxon units j sampled at a site, v = value for the characteristic of a site, and N = total number of taxon units j at all of the sampling sites used to calculate A-WAj. Taxa more abundant at sites with greater values for a stream site characteristic will have a greater value for the A-WA.
Three variations of the algae trophic index (ATI) were calculated to assess the impact of the trophic state of a stream site on the structure of soft-algae assemblages. An ATI is calculated aswhere nj = number of taxon units j sampled at a site, tij = trophic-indicator value for taxon j, and N = total number of taxon units at the sampling site used to calculate the index. The three variations of the ATI differed by the stream site characteristic used to calculate the trophic-indicator values. The three trophic-indicator values utilized were A-WA of concentration of chl a, A-WA of ash-free dry mass of benthic organic matter, and A-WA of the concentration of total phosphorous of benthic organic matter. Taxa not identified to species were excluded from index calculations.
Nutrient concentrations of water samples and benthic organic matter
Concentrations of nutrients in water were determined from one water sample collected at midstream and 5 cm below the surface on the same day that cobbles were sampled. We acknowledge that nutrient concentrations of water may vary from day to day and that evaluations of water samples collected on different days are optimal, however, limited funding restricted the number of nutrient analyses to 32 (analyses of four different nutrients from one water sample collected at each of the eight sites). Concentrations of total phosphorous of benthic organic matter were determined from samples scraped from cobbles, desiccated for 24 h at 50 °C, and ashed at 500 °C for 2 h. Concentrations of soluble reactive phosphorus, NO2 + NO3 nitrogen, and total nitrogen of water samples and concentrations of total phosphorous of benthic organic matter were determined following the methods of Eaton et al. (Citation2005) using a Lachat QuickChem 8000 Flow Injection Analyzer (Lachat Instruments, 5600 Lindbergh Dr., Loveland, Colorado 80538). The water samples for determinations of concentrations of SRP and NO2 + NO3 nitrogen were filtered through nitrocellulose membranes (0.45 µm pore size, 47 mm diameter, Advantec MFS Inc.) using a vacuum filtration system. Concentrations of SRP and NO2 + NO3 nitrogen were determined by the ascorbic-acid method and cadmium-reduction method, respectively. Concentrations of total nitrogen of water samples were determined by the persulfate digestion and cadmium-reduction method. Concentrations of total phosphorous of ashed benthic organics were determined by the persulfate digestion and ascorbic-acid method (Eaton et al. Citation2005).
Results
The two sites most impacted by eutrophication are the Suggs Creek site, sampled August 2015 and located in Nashville, TN, and the Jones Creek site, sampled August 2016 and located 5 km downstream of the Jones Creek Wastewater Treatment Plant as indicated by the concentrations of benthic chlorophyll (chl) a (). The concentrations of chl a at both the Suggs and Jones Creek sites are above nuisance levels (≥100 mg.m−2; Dodds et al. Citation1998). The oligotrophic concentrations of chl a at the Hurricane Creek site and the low mesotrophic concentrations of chl a at the Flynn Creek site are consistent with the listings of these sites as nutrient-unimpaired. Photoautotrophic periphyton was in excellent physiological condition as indicated by the low concentrations of pheophytin a relative to concentrations of chl a and the corresponding OD ratios of OD664 to OD665 ≥ 1.5 at all sites other than the photoautotrophic periphyton sampled at the Suggs Creek site (). Shading from the very high concentration of benthic organic matter measured as ash-free-dry mass at the Suggs Creek site may contribute to the poor physiological condition of the photoautotrophic periphyton at the site.
Table 1. Characteristics of photoautotrophic periphyton and ash-free dry mass of benthic organic matter collected August 2015 and August 2016. Mean characteristics ± SE of stream sites evaluated the same year are significantly different at the experiment-wise error rate of alpha = 0.05 if they do not share the same letter.
The high concentrations of total phosphorous of benthic organic matter at the Suggs and Jones Creek sites determined in August 2015 and August 2016 reflect the nutrient-impaired habitats of the sites (). The low concentrations of total phosphorous of benthic organic matter at the Flynn and Hurricane Creek sites are consistent with these sites listed as nutrient-unimpaired (TDEC Citation2016). Only the Jones Creek site had water concentrations for soluble reactive phosphorous, NO2 + NO3 nitrogen, and total nitrogen above the mesotrophic-eutrophic threshold (Dodds et al. Citation1998). The very high nutrient concentrations of water at the Jones Creek site most likely reflect continuous input from the Jones Creek Wastewater Treatment Plant located 5 km upstream. The low nutrient concentrations of water at the Suggs Creek site, designated as hypereutrophic by the concentration of chl a, are most likely due to the high nutrient demand by the nuisance-level concentration of periphyton at the site.
Table 2. Concentrations of total phosphorous of benthic organic matter, soluble reactive phosphorous of water, NO2 + NO3 of water, and total nitrogen of water at stream sites sampled in August 2015 and August 2016.
Concentrations of chl a and the ash-free dry mass of benthic organic matter of sites sampled in August 2015 were significantly correlated with the concentration of total phosphorous of benthic organic matter but not to the concentrations of nutrients of water samples (). These results indicate that the concentration of total phosphorous of benthic organic matter was a more accurate indicator of the trophic state of the sites sampled in August 2015 relative to the water concentration of soluble reactive phosphorous, NO2 + NO3, and total nitrogen. The eutrophic concentrations of chl a coupled with the high concentration of soluble reactive phosphorous of water at the Jones Creek site located downstream of the wastewater treatment plant ( and ) contribute to the significant correlation of the concentration of chl a to the concentration of soluble reactive phosphorous of water samples for sites sampled in August 2016.
Table 3. Pearson's correlation coefficients for concentrations of chlorophyll a and ash-free dry mass of benthic organic matter to concentrations of total phosphorous of benthic organic matter and nutrient concentrations of water samples at sites sampled August 2015 and at sites sampled August 2016. Pearson's correlation coefficients are followed by the significance of probability at the 95% confidence level in parentheses.
Diatoms were the most abundant algae relative to soft-algae at every site sampled in May 2015 and May 2016, while soft-algae were most abundant at every site sampled in August 2015 and August 2016 (). These seasonal differences for diatom and soft-algae abundances were significant as determined by Student's t-tests for both May (n = 8, p < 0.001) and August (n = 8, p < 0.001). Percent composition of cyanobacteria was significantly lower at sites sampled May 2015 and May 2016 (x̅ = 16.4 ± 5.0) relative to sites sampled August 2015 and August 2016 (x̅ = 54 ± 10.7) as determined by a Student's t-test (n = 8, p = 0.01). Percent composition of Chlorophyta at sites sampled May 2015 and May 2016 (x̅ = 9.5 ± 2.2) was not significantly different from sites sampled August 2015 and August 2016 (x̅ = 17.8 ± 8.0) as determined by a Student's t-test (n = 8, p = 0.33). These results are consistent with numerous studies of stony streams from Europe, Japan, and North America which illustrate temperature is a dominant factor controlling temporal changes in the abundance of algal groups. Diatoms dominate in the winter and often continue to be the major component of algal assemblages in spring given they are generally more abundant in cool water (Allan & Castillo Citation2009). Chlorophyta and cyanobacteria become more abundant during the late spring with cyanobacteria often becoming the most abundant algal group in the summer given they are typically more abundant at temperatures >30 oC (DeNicola Citation1996).
Table 4. Percent composition of algae groups sampled May 2015, August 2015, May 2016, and August 2016.
The 232 algae taxa identified at the sites we studied illustrate the large diversity of algae taxa in the central region of the Interior Plateau Level III Ecoregion. We identified 114 diatom taxa (Appendix 3). The two most abundant diatom taxa sampled (), Achnanthidium rivulare Potapova and Ponader (26.2% of all sites and dates) and Achnanthidium minutissimum (Kütz.) Czarn. (8.9% of all sites and dates), are common in the southeastern United States (Ponader & Potapova Citation2007). The relatively low percent composition of A. rivulare at the most eutrophic sites, Suggs and Jones Creek, relative to the other sites is consistent with the conclusions of Ponader and Potapova (Citation2007) that A. rivulare is less abundant in stream reaches with poor quality water. The composition of diatom assemblages differed between the sites as little as 24% between the Trace and Hurricane Creek sites in May 2015 to as much as 83% between the Jones and Marrow Bone Creek sites in May 2016 (). The greater percent similarity for the Trace and Hurricane Creek sites in May 2016 results from the greater dominance of A. rivulare at the two sites ().
Table 5. Most abundant diatom taxa at stream sites sampled in May 2015, August 2015, May 2016, and August 2016. Numbers in parentheses represent percent composition.
Table 6. Percent similarity of diatom assemblages between the different sites sampled May 2015, between the different sites sampled August 2015, between the different sites sampled May 2016, and between the different sites sampled August 2016.
Values for the pollution tolerance index of diatom assemblages (PTI) illustrate the trophic state of the stream sites (). Values for the PTI were lowest, which indicate most eutrophic for the Suggs Creek site among sites sampled in 2015 and for the Jones Creek site among sites sampled in 2016. Values for the SI <60 and values for the OPI <40 for stream sites other than the Jones Creek site imply that only the composition of diatom assemblages at the Jones Creek site may have been substantially impacted by siltation and organic pollution. Values for the Shannon diversity index and evenness for diatom assemblages sampled in August 2015 and August 2016 were not correlated with the trophic state of the sites as indicated by nonsignificant Pearson's correlation coefficients to concentrations of chl a, total phosphorous of benthic organics, and ash-free dry mass of benthic organics (data not shown).
Table 7. Indices and metrics of diatom assemblages at sites sampled in May 2015, August 2015, May 2016, and August 2016.
We identified 128 taxa of soft-algae (Appendix 4). The two most abundant soft-algae taxa sampled (), the filamentous chlorophyte Cladophora glomerata (17.9% of all sites and dates) and the filamentous cyanobacterium Phormidium diguetii (Gomont) Anagn. & Komárek (14.3% of all sites and dates), are widespread and abundant in the eastern United States (Prescott Citation1982; Whitford and Schumaker Citation1984). The dominance of C. glomerata at the most eutrophic sites is consistent with numerous studies which cite C. glomerata as an indicator of eutrophic conditions of both lentic and lotic systems (Mackie Citation2013; Fetcher et al. Citation2014; Stancheva & Sheath Citation2016). Phormidium diguetii is tolerant of eutrophic conditions in lentic systems (Mackie Citation2013), yet was not more abundant at the most eutrophic sites in this study. Other taxa cited as tolerant of eutrophic, lentic water and not substantially more abundant at the eutrophic sites sampled in this study include Phormidium tenue (C. Agardh) Anagn. and Komárek and Stigeoclonium tenue (Ag.) Kütz. This result is consistent with the suggestion that factors other than trophic state may be more important in lotic systems relative to lentic systems as determinants of the abundance of soft-algae taxa (Leland & Porter Citation2000).
Table 8. Most abundant soft-algae taxa at sites sampled May 2015, August 2015, May 2016, and August 2016. Numbers in parentheses represent percent composition.
The composition of soft-algae assemblages differed between sites as much as 98% between the Suggs Creek site and both the Trace and Flynn Creek sites sampled in August 2015 (). The greater similarity of composition between the assemblages at the Suggs and Flynn Creek sites (64%) and the Jones and Marrow Bone Creek sites (61%) results from similar percent compositions for C. glomerata (). The low percent similarity of soft-algae and diatom taxa of all sites between May and August sampling dates () is consistent with data from other studies which demonstrate composition of algae taxa may vary dramatically between seasons or years (Brown et al. Citation2008). The change of soft-algae composition among all sites from May to August was almost double the change of diatom composition and was significantly greater as determined by a Student's t-test (p = 0.001). We do not know the factors responsible for the differences in percent composition between sites or for the changes in percent composition between sampling dates.
Table 9. Percent similarity of soft-algae assemblages between the different sites sampled May 2015, between the different sites sampled August 2015, between the different sites sampled May 2016, and between the different sites sampled August 2016.
Table 10. Percent similarity of soft-algae and diatom assemblages between the same sites sampled May 2015 and again August 2015, between the same sites sampled May 2016 and again August 2016, and mean ± SE percent similarity of all sites sampled May and again August.
The values for the Shannon diversity index for soft-algae assemblages were lowest for the Hurricane Creek site sampled May 2015 and August 2015 () due to the dominance of Phormidium retzii (C. Agardh) Gomont at the site during May 2015 and P. diguetii during August 2015 (). Values for the Shannon diversity index and evenness for soft-algae assemblages sampled in August 2015 and August 2016 did not correspond with the trophic state of the sites as indicated by nonsignificant Pearson's correlation coefficients to concentrations of chl a, total phosphorous of benthic organics, and ash-free dry mass of benthic organics (data not shown). This result coupled with the nonsignificant effect of trophic state on the Shannon diversity index for diatom assemblages sampled in August 2015 and August 2016 supports earlier conclusions that high values for the Shannon diversity index may not imply good quality habitats in aquatic environments (Carlisle et al. Citation2008; Lebkuecher et al. Citation2015).
Table 11. Shannon diversity index and metrics for soft-algae assemblages sampled May 2015, August 2015, May 2016, and August 2016.
The A-WA of chl a for soft-algae taxa (Appendix 5) serves as trophic-indicator values. Soft-algae taxa with greater values for the A-WA of chl a (A-WAchl a) are more abundant at sites with greater concentrations of chl a and thus are more abundant at the relatively nutrient-rich stream sites. Taxa which occur at more than one site and with a low standard deviation (SD) of the A-WA, and thus a low SD to A-WA ratio, are interpreted as potential indicators of trophic state (Stancheva et al. Citation2012). There are no set guidelines for the use of A-WA and SD data to designate taxa as indicators of habitat quality (Stancheva et al. Citation2012). For our data, we consider taxa with an A-WAchl a in the upper and lower tertiles (A-WA chl a ≥ 132.5 and A-WA chl a ≤ 52.4, respectively) with a SD to A-WA ratio below the mean SD to A-WA ratio (x̅ = 0.41) as potential indicators of the most nutrient-impacted and least nutrient-impacted sites, respectively. Using these criteria and excluding taxa that occurred at only one site, taxa designated as potential indicators of nutrient-rich sites include only C. glomerata, Dactylococcopsis raphidioides Hansg., Gloeocapsopsis cyanea (Krieg) Komárek and Anagn., and Vaucheria sp. Taxa designated as potential indicators of relatively nutrient-unimpacted sites include only Chaetopeltis orbicularis Berthold, Aphanocapsa elachista West and West, and Oscillatoria subtilissima Kütz. and De Toni.
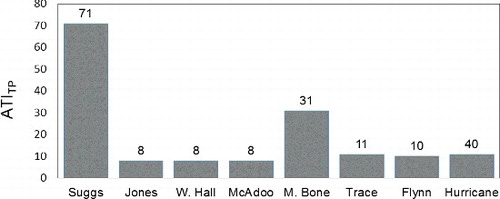
The ATI using A-WA of chl a concentrations for soft-algae taxa as the trophic-indicator values (ATIchl a; ) accurately denotes the trophic state of the stream sites (). The ATIchl a is significantly correlated with concentrations of total phosphorous of benthic organic matter, ash-free dry mass of benthic organic matter, concentrations of chl a, and PTI. The ATI using A-WA of ash-free dry mass of benthic organic matter () and the ATI using A-WA of total phosphorous concentration of benthic organic matter () as the trophic-indicator values did not correspond significantly to all of the periphyton characteristics used to indicate the trophic state of the stream sites (). None of the biotic indices were significantly correlated to water concentrations of soluble reactive phosphorous (), NO2 + NO3 (data not shown) or total nitrogen (data not shown).
Figure 1. Values for the algae trophic index using abundance-weighted average of chlorophyll a concentrations (ATIchl a) for soft-algae taxa as the trophic-indicator values of stream sites sampled August 2015 and August 2016.
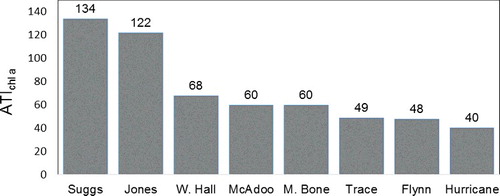
Table 12. Pearson's correlation coefficients for indices of algae assemblages sampled August 2015 and August 2016 to other site characteristics followed by the significance of probability at the 95% confidence level in parentheses. The ATI using soft-taxa abundance-weighted averages of concentrations of chlorophyll (chl) a as the trophic-indicator values is abbreviated ATIchl a. The ATI using abundance-weighted averages of ash-free dry mass of benthic organic matter as the trophic-indicator values is abbreviated ATIAFDM. The ATI using abundance-weighted averages of the concentration of total phosphorous of benthic organic matter as the trophic-indicator values is abbreviated ATITP.
Figure 2. Values for the algae trophic index using abundance-weighted average of ash-free dry mass of benthic organic matter (ATIAFDM) for soft-algae taxa as the trophic-indicator values of stream sites sampled August 2015 and August 2016.
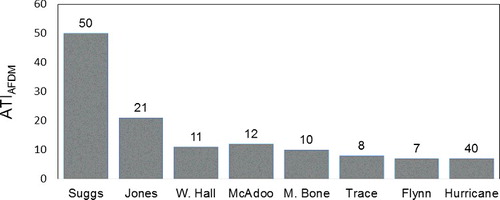
Figure 3. Values for the algae trophic index using abundance-weighted average of the concentrations total phosphorous of benthic organic matter (ATITP) for soft-algae taxa as the trophic-indicator values of stream sites sampled August 2015 and August 2016.
Discussion
The nuisance levels of benthic algae at the Suggs and Jones Creek sites illustrate a negative impact of eutrophication. Estimates of biomass alone do not advance our limited understanding of the effects of nutrient concentration on the autecology of soft-algae. Analyses of the relationships of nutrient concentration and the structure of soft-algae assemblages are essential to improve our understanding of the effect of eutrophication on periphyton communities (Stancheva et al. Citation2012). This study advances our understanding of the effects of trophic state on the composition of photoautotrophic assemblages by evaluating the percent composition of soft-algae taxa at sites with differing trophic states.
Several characteristics of soft-algae most likely contribute to the scarcity of data correlating nutrient concentration to abundance for most soft-algae taxa in lotic systems. The physical characteristics of a stream site often have a greater impact on the structure of soft-algae assemblages relative to diatom assemblages. Soft-algae taxa may be more affected by intermittent changes of water velocity due to their greater diversity of surface area relative to diatoms (Whitton Citation2012). The greater phylogenetic diversity for soft-algae relative to diatoms most likely contributes to greater differences of ecological interactions. The study by Lebkuecher et al. (Citation2015) of three mesotrophic sites and one hypereutrophic site in Sulphur Fork Creek in Middle Tennessee is the only other research we are aware of in which the changes of percent composition of both diatoms and soft-algae taxa from spring to summer were evaluated at the same sites in a lotic system. The similarity of percent composition of diatoms from spring to summer was much more consistent, ranging from 58% to 65%, relative to the similarity of percent composition of soft-algae taxa which ranged from 30% to 85%. Our results demonstrate an almost twofold greater difference in the change of soft-algae composition from spring to summer relative to diatom composition () which, if occurs in other temperate streams, may contribute to the difficulty of assigning cosmopolitan trophic-state optima to many soft-algae taxa.
The few taxa designated as reliable indicators of trophic state by this study strengthen the conclusions of earlier studies that trophic state may not be the most important factor affecting percent composition for many soft-algae species of lotic assemblages. Lebkuecher et al. (Citation2015) demonstrated that only 4 of 125 soft-algae taxa sampled from Sulphur Fork Creek in Middle Tennessee were significantly correlated to log10-transformed concentrations of soluble reactive phosphorous of water samples. No soft-algae taxa out of 221 taxa sampled streams of Washington and Idaho were designated as eutrophic indicators using a computer regression program to model log10-transformed concentrations of soluble reactive phosphorous of water samples to percent composition of soft-algae taxa (Munn et al. Citation2002). Stancheva et al. (Citation2012) designated 7 out of 180 soft-algae taxa as indicators of trophic state in streams of southern California streams using abundance-weighted averages of total phosphorous concentrations of water.
Ecoregion-specific assessments may be required to evaluate the impact of eutrophication on soft-algae assemblages (NAWQA Citation2005). Soft-algae taxa often found in nutrient-impaired streams of North America are cited as intolerant of eutrophication in Europe (Porter Citation2008). Rott and Schneider (Citation2014) reported that the optimum water concentration of total phosphorus was significantly different for 16 of 21 soft-algae taxa in Norway relative to Austria. Regression analysis indicated that the positions of many optima relative to each other were stable across Norway and Austria. Rott and Schneider (Citation2014) concluded that this result supports suggestions that identifying lotic soft-algae taxa for use as cosmopolitan trophic-indicators may be possible. Our study reveals the impact of trophic state on the percent composition of soft-algae taxa needed to understand and monitor the effects of eutrophication on soft-algae assemblages in the central region of the Interior Plateau Level III Ecoregion of the United States. More studies which correlate trophic state to percent composition of soft-algae taxa may help to lead to the designation of some soft-algae taxa as universal indicators of trophic state as has been done for many diatom taxa (Danielson et al Citation2011).
Governments worldwide require periodic determinations of the chemical constituents of water to monitor the trophic state of rivers and streams (Whitton Citation2013). The concentration of soluble reactive phosphorus of water samples is a primary criterion for assigning trophic state to reaches in rivers because soluble reactive phosphorus is the form of phosphorous available to photoautotrophs and limits primary production of most algae in most rivers (Moss et al. Citation2013). Chemical analyses of water samples may not accurately reflect trophic state because pulses of nutrient enrichment may be missed during sampling or concentrations of nutrients of water samples may be low due to high nutrient demand (Dodds Citation2006). The United States Geological Survey National Water-Quality Assessment (NAWQA) program ranked soft-algae taxa by eutrophication-tolerance based on abundance-weighted averages of log10-transformed concentrations of soluble reactive phosphorous of water samples at sites across the United States (NAWQA Citation2005). NAWQA (Citation2005) concluded that the rankings of many taxa are not accurate. The low nutrient concentrations of water samples collected at the eutrophic sites during our study, other than the Jones Creek site downstream of the wastewater treatment plant, support the suggestion by Dodds (Citation2006) that nutrient concentrations of water may underestimate the trophic state of eutrophic sites.
The five indices developed previously which utilize soft-algae taxa exclusively to evaluate trophic state of stream sites that we are aware of (Gutowski et al. Citation2004; Schamburg et al. Citation2004; Schneider & Lindstrøm Citation2011; Fetscher et al. Citation2014; Lebkuecher et al. Citation2015) are not applicable for the evaluation of the trophic state of stream sites in the Interior Plateau Level III Ecoregion. These indices are designed to assess trophic state of lotic systems in countries other than the United States (Gutowski et al. Citation2004; Schaumburg et al. Citation2004; Schneider & Lindstrøm Citation2011), or southern California (Fetscher et al. Citation2014), or are based on trophic-indicator values which are not useful at stream sites other than those used to calculate the values (Lebkuecher et al. Citation2015). The index developed by Gutowski et al. (Citation2004) and Schaumburg et al. (Citation2004) to evaluate the water quality of German rivers is based on 74 and 51 taxa, respectively, and very few of these taxa were present at the sites we sampled in Middle Tennessee. The periphyton index of trophic status (PIT; Schneider & Lindstrøm Citation2011) was developed to evaluate the trophic state of Nordic rivers. Few taxa sampled by Schneider and Lindstrøm (Citation2011) are present at the sites we sampled in Middle Tennessee and the maximum concentration of total phosphorus of water samples for which the index was developed is below the concentration of many eutrophic streams in other regions (Whitton Citation2013).
Fetscher et al. (Citation2014) used a computer program to calculate values for indices using diatom taxa, soft-algae taxa, and both diatom and soft-algae taxa to evaluate the water quality of southern California streams. The indicator values for taxa were established using numerous criteria specifically to assess the water quality of southern California streams and included landscape features, land use, and water chemistry parameters. The index using soft-algae taxa corresponds to nutrient concentrations of the stream sites and demonstrates that the structure of soft-algae assemblages can be affected by trophic state. Lebkuecher et al. (Citation2015) developed an index utilizing Pearson's correlation coefficients for log10-transformed concentrations of soluble reactive phosphorous of water samples to percent composition of soft-algae taxa as trophic-indicator values to assess the trophic state of sites in Sulphur Fork Creek located in Middle Tennessee. The index accurately denotes the trophic state of the two mesotrophic sites and one hypereutrophic site sampled because the water at the hypereutrophic site has a consistently high concentration of soluble reactive phosphorous since it is immediately downstream of a wastewater treatment plant. Because the trophic-indicator values are based on the concentration of soluble reactive phosphorous of water, which may be low at eutrophic sites not immediately downstream from a consistent source of soluble reactive phosphorous, the trophic-indicator values cannot be expanded to include additional taxa from different streams.
Our results support the long standing consensus that benthic concentrations of chl a (Dodds et al. Citation1998) and the composition of diatom assemblages (Kelly & Whitton Citation1995) are often effective indicators of the trophic state of stream sites. Use of several measurements to assess trophic state is optimal given any one measurement may not be accurate. Diatoms such as Cocconeis placentula Ehrenb. and Rhoicosphenia curvata (Kütz.) Grun. have oligotrophic to mesotrophic trophic values for the pollution tolerance index of diatom assemblages (KDOW Citation2002). Both of these taxa are epilithic and epiphytic on large, filamentous algae and may be more abundant at eutrophic sites dominated by large filamentous algae (Leland & Porter Citation2000). The ATI using abundance-weighted averages of concentrations of chl a for soft-algae taxa as trophic-state indicators (ATIchl a) accurately denotes the trophic state of the sites we studied and provides a valuable methodology supplement to monitor the trophic state of the sites. The ATIchl a has several positive features. Use of all taxa of the assemblage to calculate the index values avoids subjective exclusion of less common taxa or taxa not considered as strong indicators of trophic state. The range of the index emulates concentrations of chl a at nutrient-unimpaired and nutrient-impaired sites and thus is easy to interpret. This index is the first to utilize periphyton characteristics, as opposed to nutrient concentrations of water, to assign trophic-indicator values to soft-algae taxa and does not require a computer program to compute.
Acknowledgments
This work was supported by the Tennessee Healthy Watershed Initiative (grant number 32701-02096), a collaboration of the Tennessee Department of Environment and Conservation Division of Water Resources, Tennessee Valley Authority, Tennessee Chapter of The Nature Conservancy, and the West Tennessee River Basin Authority. Funding was also provided by the Department of Biology at Austin Peay State University and The Center for Field Biology at Austin Peay State University. We thank Drs Jennifer Greenwood, Susanne Schneider, and two anonymous reviewers for reviewing the manuscript and offering suggestions for improvement.
Disclosure statement
No potential conflict of interest was reported by the authors.
Additional information
Funding
Notes on contributors
Molly R. Grimmett
Molly R. Grimmett is a biology graduate student at Austin Peay State University in Clarksville, Tennessee.
Jefferson G. Lebkuecher
Jefferson G. Lebkuecher is a professor of biology at Austin Peay State University. Both authors study the effects of water quality on algae assemblages.
References
- Allan JD, Castillo MM. 2009. Stream ecology: structure and function of running waters. Rotterdam: Springer.
- Anagnostidis K, Komárek J. 1988. Modern approach to the classification system of cyanophytes 3 - Oscillatoriales. Arch Hydrobiol Suppl. 80:327–472.
- Bahls LL. 1993. Periphyton bioassessment methods for Montana streams. Helana (MT): Water Quality Bureau, Department of Health and Environmental Sciences.
- Biggs BJF. 2000. Eutrophication of streams and rivers: dissolved nutrient-chlorophyll relationships for benthic algae. J N Am Benthol Soc. 19:17–31.
- Brown LR, May JT, Hunsaker CT. 2008. Species composition and habitat associations on benthic algae assemblages in headwater streams of the Sierra Nevada, California. West N Am Naturalist. 68:194–209.
- Carlisle DM, Hawkins CP, Meader MR, Potapova M, Falcone J. 2008. Biological assessments of Appalachian streams based on predictive models for fish, macroinvertebrates and diatom assemblages. J N Am Benthol Soc. 27:16–37.
- Carr JM, Hergenrader JL, Troelstrup NH Jr. 1986. A simple, inexpensive method for cleaning diatoms. Trans Am Micro Soc. 105:152–157.
- Cocke EC. 1967. The Myxophyceae of North Carolina. Ann Arbor (MI): Edwards Brothers.
- Danielson TJ, Loftin CS, Tsomides L, DiFranco JL, Connors B. 2011. Algal bioassessment metrics for wadeable streams and rivers of Maine, USA. J N Am Benthol Soc. 30:1033–1048.
- DeNicola DM. 1996 Periphyton responses to temperature at different ecological levels. In: Stevenson RJ, Bothwell ML, Lowe RL, editors. Algal ecology: freshwater benthic ecosystems. San Deigo (CA): Academic Press; p. 149–181.
- Dodds WK. 2006. Eutrophication and trophic state in rivers and streams. Limnol Oceanogr. 51:671–680.
- Dodds WK, Jones JR, Welch EB. 1998. Suggested classification of stream trophic state: distributions of temperate stream types by chlorophyll, total nitrogen, and phosphorous. Water Resour. 32:1455–1462.
- Eaton AD, Clesceri LS, Rice EW, Greenberg AE. 2005. Standard methods for the examination of water and wastewater. 21st ed. Washington (DC): American Public Health Association.
- Fetscher AE, Stancheva RS, Kociolek JP, Sheath RG, Stein ED, Mazor RD, Ode PR. 2014. Development and comparisons of stream indices of biotic integrity using diatoms vs. non diatom algae vs. a combination. J Appl Phychol. 26:433–450.
- Griffith GE, Omernik JM, Azevedo SH. 1997. Ecoregions of Tennessee. EPA/600/R97/022. NHREEL. Corvallis (OR): United States Environmental Protection Agency, Western Ecological Division.
- Gutowski A, Foerster J, Schaumburg J. 2004. The use of benthic algae, excluding diatoms and Charales, for the assessment of the ecological status of running fresh waters: a case history from Germany. Oceanol Hydrobiol St. 33:3–15.
- Hauer R, Lamberti GA. 2006. Methods in stream ecology. 2nd ed. Maryland Heights (MO): Academic Press.
- John DM, Whitton BM, Brook AJ. 2011. The freshwater algal flora of the British Isles. An identification guide to freshwater and terrestrial algae. 2nd ed. Cambridge: Cambridge University Press.
- Kentucky Department of Water (KDOW). 2002. Methods for assessing biological integrity of surface waters in Kentucky. Frankfort (KY): Department for Environmental Protection, Division of Water. Available from: http://water.ky.gov/Pages/SurfaceWaterSOP.aspx
- Kelly MG. 1998. Use of the diatom trophic index to monitor eutrophication in rivers. Water Res. 32:236–242.
- Kelly MG, Whitton BA. 1995. The trophic diatom index: a new index for monitoring eutrophication in rivers. J Appl Phycol. 7:433–444.
- Krammer K, Lange-Bertalot H. 1998. Bacillariophyceae. 2. Teil: Bacillariaceae, Epithemiaceae, Surirellaceae. In: Ettl H, Gerloff J, Heynig H, Mollenhauer D, editors. Süsswasserflora von Mitteleuropa, Band 2/2. Jena: VEB Gustav Fischer Verlag; p. 596.
- Kurle CM, Cardinale BJ. 2011. Ecological factors associated with the strength of trophic cascades. Oikos. 120:1897–1908.
- Lebkuecher JG, Rainey SM, Williams CB, Hall AJ. 2011. Impacts of nonpoint-source pollution on the structure of diatom assemblages, whole-stream oxygen metabolism, and growth of Selenastrum capricornutum in the Red River Watershed of North-Central Tennessee. Castanea. 76:279–292.
- Lebkuecher JG, Tuttle EN, Johnson JL,Willis NKS. 2015. Use of algae to assess the trophic state of a stream in middle Tennessee. J Freshw Ecol. 30:346–379.
- Leland HV, Porter SV. 2000. Distribution of benthic algae in the upper Illinois River basin in relation to geology and land use. Freshw Biol. 44:279–301.
- Mackie GL. 2013. Applied aquatic ecosystem concepts. Dubuque (IA): Kendall Hunt.
- Moss B, Jeppesen E, Sondergaard M, Lauridsen TL, Liu ZW. 2013. Nitrogen, macrophytes, shallow lakes and nutrient limitation: resolution of a current controversy? Hydrobiologia. 710:3–21.
- Munn MD, Black RW, Gruber SG. 2002. Response of benthic algae to environmental gradients in an agriculturally dominated landscape. J N Benthol Soc. 21:221–237.
- NAWQA. 2005. Relationships of soft-bodied algae to water-quality and habitat characteristics in U.S. rivers: analysis of the National Water-Quality Assessment (NAWQA) Program data set. Report No. 05-08. Benjamin Franklin Parkway (PA): The Academy of natural Science. Patrick Center for Environmental Research, Phycology Section; p. 19103—1195.
- Passy SI, Larson CA. 2011. Succession in stream biofilms is an environmentally driven gradient of stress tolerance. Microb Ecol. 62:414–424.
- Patrick R, Reimer CW. 1966. The diatoms of the United States. Volume 1. Monographs Acad Nat Sci Philadelphia. 13:1–688.
- Patrick R, Reimer CW. 1975. The diatoms of the United States. Volume 2. Monographs Acad Nat Sci Philadelphia. 13:1–213.
- Ponader KC, Potapova MG. 2007. Diatoms from the genus Achnanthidium in flowing waters of the Appalachian Mountains (North America): ecology, distribution and taxonomic status. Limnologica. 37:227–241.
- Porter SD. 2008. Algal attributes: an autecological classification of algal taxa collected by the national water-quality assessment program. US Geological Survey Data Series 329. Available from: http://pubs.usgs.gov/ds/ds329/
- Prescott GW. 1982. Algae of the western great lakes area. Koenigstein: Otto Koeltz Science Publishers.
- Rimet F. 2012. Recent views on river pollution and diatoms. Hydrobiologia. 683:1–24.
- Rott E, Schneider SC. 2014. A comparison of ecological optima of soft-bodied benthic algae in Norwegian and Austrian rivers and consequences for river monitoring in Europe. Sci Total Environ. 475:180–186.
- Schaumburg J, Schranz C, Foerster J, Gutowski A, Hofmann G, Meilinger P, Schneider S, Schmedtje U. 2004. Ecological classification of macrophytes and phtobenthos for rivers in Germany according to Water Framework Directive. Limnologica. 34:283–301.
- Schneider S, Lindstrøm EA. 2011. The periphyton index of trophic status PIT: a new eutrophication metric based on non-diatomaceous benthic algae in Nordic rivers. Hydrobiologia. 665:143–155.
- Schoen S. 1988. Cell counting. In: Lobban CS, Chapman DJ, Kremer BP, editors. Experimental phycology. a laboratory manual. Cambridge (MA): Cambridge University Press; p. 16–22.
- Shannon CE, Weaver W. 1949. The mathematical theory of communication. Urbana (IL): University of Illinois Press.
- Smucker NJ, Vis ML. 2009. Use of diatoms to assess agricultural and coal mining impacts on streams and a multiassembage case study. J N Am Benthol Soc. 28:659–675.
- Stancheva R, Fetcher AE, Sheath RG. 2012. A novel quantification method for stream- inhabiting, non-diatom benthic algae, and its application in bioassessment. Hydrobiologia. 684:225–239.
- Stancheva R, Sheath RG. 2016. Benthic soft-bodied algae as bioindicators of stream water quality. Knowl Manag Aquat Ecosyst. 414:1–16.
- TDEC. 2009. Habitat quality of least-impacted streams in Tennessee. Nashville (TN): Tennessee Department of Environment and Conservation, Division of Water Pollution Control. Available from: http://www.tennessee.gov/assets/entities/environment/attachments/Habitat_Guidelines.pdf
- TDEC. 2016. The status of water quality in Tennessee. Nashville (TN): Tennessee Department of Environment and Conservation, Division of Water Pollution Control. Available from: http://tn.gov/environment/article/wr-wq-water-quality-reports-publications
- USEPA. 2016. Tennessee impaired waters. Washington (DC): Environmental Protection Agency. Available from: https://iaspub.epa.gov/tmdl_waters10/attains_impaired_waters.control?p_state=TN
- USGS. 2016. Interior plateau. Reston (VA): United States Geological Survey. Available from: https://landcovertrends.usgs.gov/east/eco71Report.html
- Whitford LA, Schumacher GJ. 1984. A manual of fresh-water algae. Raleigh (NC): Sparks Press.
- Whitton BA. 2012. Ecology of Cyanobacteria II. Their diversity in space and time. New York (NY): Springer.
- Whitton BA. 2013. Use of benthic algae and bryophytes for monitoring rivers. J Ecol Environ. 36:95–100.
- Woelkerling WJ, Kowal RR, Gough SB. 1976. Sedgwick-rafter cell counts: a procedural analysis. Hydrobiologia. 48:95–107.
- Zar JH. 2007. Biostatistical analysis. 5th ed. Englewood Cliffs (NJ): Printice Hall.
Appendices
Appendix 1. Streams sampled, year streams sampled, and locations of stream sites sampled
Appendix 2. Morphological characteristics (mean ± SE) of stream sites sampled in 2015 and 2016
Appendix 3. Percent composition of diatom taxa listed in alphabetical order at stream sites sampled May 2015, August 2015, May 2016, and August 2016
Appendix 4. Percent composition of soft-algae taxa listed in alphabetical order by phylum at sites sampled in May 2015, August 2015, May 2016, and August 2016
Appendix 5. Abundance-weighted average (A-WA) of the concentration of benthic chlorophyll a for soft-algae taxa sampled August 2015 and August 2016. The standard deviation (SD) of the abundance-weighted average and ratio of SD to abundance-weighted average (SD/A-WA) are given for taxa in which more than one algal unit was recorded