
ABSTRACT
Type-specific stream assessment systems based on biotic indicators are considered a main focus of future stream assessment in many European countries. However, there is a lack of information on type-specific differences of freshwater eco-regions in South Korea. We aimed to classify the stream types characterized by stream size and altitude. Analyzing the relationship between physical environmental variables and benthic macroinvertebrates collected between 2008 and 2015 at 1,020 sites (i.e. 13,366 samples) on a national scale in South Korea, we classified a total of five Korean stream types. All streams were divided into wadeable and non-wadeable streams using stream order and width. Wadeable streams were classified as mountain, highland, or lowland wadeable streams based on altitude. Non-wadeable streams were divided into lowland non-wadeable streams or rivers based on width. Mountain and highland streams significantly correlated with altitude, whereas others were distinctly related to stream order and width. We selected 25 indicator species sensitive to stream size and altitude. These assessments will provide preliminary information for development of a future biotic stream assessment system based on stream typology.
Introduction
Stream types can be defined as ecological zones that contain similar environmental characteristics, such as stream size, stream order, altitude, flow velocity, streambed substrates, water temperature, or stream width. Differences in physical environmental variables among stream types can result in different stream biota independent of water quality. The European Community Water Framework Directive (WFD) suggests that assessment of all types of surface waters (e.g. streams, rivers, lakes, and estuarine waters) in Europe should be based on water typologies (WFD Citation2000). European countries have approached stream typology in a variety of ways to meet the requirements of the WFD. Specifically, German river typology comprises 25 types based on physico-chemical parameters and geological classification (Arle et al. Citation2014). The United States also designed nine ecological regions that further divided the three major climatic regions for use in stream environmental assessments (EPA Citation2013). The European Union (EU)-funded project ‘The Development and Testing of an Integrated Assessment System for the Ecological Quality of Streams and Rivers throughout Europe using Benthic Macroinvertebrates (AQEM)’ was initiated to develop a framework of a type-specific assessment system for ecological status based on benthic macroinvertebrates (AQEM Citation2002). In the United Kingdom (UK), an existing classification system called ‘River Invertebrate Prediction and Classification System (RIVPACS)’ partly fulfills the demand of the WFD (Wright et al. Citation2000). In other European countries, including Greece and Portugal, official classification systems do not exist (Hering et al. Citation2004).
The ‘National Aquatic Ecological Monitoring Program (NAEMP)’ of the Ministry of Environment (MOE) and National Institute of Environmental Research (NIER) of South Korea has evaluated and monitored the ecosystem health of rivers and streams annually since 2007. NAEMP is based on biological parameters (e.g. benthic macroinvertebrates, benthic diatoms, and fish) and physico-chemical parameters (e.g. habitat-riparian quality, biochemical oxygen demand (BOD), dissolved oxygen (DO), total nitrogen (TN), total phosphorus (TP), and turbidity; Lee et al. Citation2011). Unlike streams, rivers often exhibit distinctive microhabitat characteristics that are attractive to specific species (Ward Citation1998) and support relatively low densities of invertebrates (Humphries et al. Citation1997). Some freshwater ecosystems such as large rivers can be relatively undervalued independent of water quality if all streams are evaluated on the same criteria. Yet, all streams have been evaluated on the same criteria in South Korea. Therefore, a stream assessment system considering characteristics of physical habitat is required. Furthermore, the stream classification can be a basis for improving the assessment system of rivers which can be relatively undervalued.
Stream classification concepts can be divided into three kinds of approaches: longitudinal gradient, lateral interaction, and catchment scale concepts. The longitudinal concept divides a stream into zones characterized by water temperature and flow velocity (Illies and Lazare Citation1963), stream size (Vannote et al. Citation1980), hydraulics (Stalnaker et al. Citation1989), and position of dams (Ward and Stanford Citation1995) from head waters to downstream extents. The lateral concept focuses on the relationship between biota and floodplains according to duration, frequency, and timing of a flood pulse (Junk et al. Citation1989) or type, density, and flow velocity near the riparian zone (Thorp and Delong Citation1994). The catchment scale concept emphasizes a stream's relationship to its watershed across a wide range of scales according to longitudinal, lateral, vertical, and temporal variations of abiotic environmental factors (Lorenz et al. Citation1997). The river continuum concept (RCC) (Vannote et al. Citation1980) used in this study is the most widely-used model to describe stream size classification based on longitudinal gradient concepts (Lorenz et al. Citation1997). However, identifying which concept is most suitable to classify stream types is impossible because various classification concepts can be used for different purposes.
The most important physical factors in the classification of stream type are stream size and altitude (AQEM Citation2002). Stream size associated with stream order and stream width can affect biotic stream communities according to the continuous physical gradient from the headwater to the river mouth. Strahler stream order (Strahler Citation1952) is widely used as a surrogate for stream size. Stream order includes complex characteristics such as discharge, channel length, and contributing drainage area (Hughes et al. Citation2011). Stream width is also commonly used by ecologists as a surrogate for stream size. Stream width relates with variations of flow velocity, water depth (Jiang et al. Citation2010), and drainage area (Faustini et al. Citation2009). Jun et al. (Citation2016) defined altitude to be the best parameter to differentiate benthic communities. Water temperature is closely related to the changes in altitude (Kong et al. Citation2013). For example, water temperature decreases along with higher altitude.
Thus, our goal was to classify stream types based on stream size (i.e. stream order and width) and altitude, with their own variations of benthic macroinvertebrate communities. We expect that these results will assist in the development of future stream assessment systems in South Korea based on Korean stream types.
Methods
Study area
This study was conducted in five main river basins (Hangang, Geumgang, Nakdonggang, Yeongsangang, and Seomjingang, ). These rivers have their own tributaries and other independent streams on a national scale in South Korea. South Korea has a total area of 100,295 km2, including water comprising about 2,800 km2. The topography is mainly comprised of hills and mountains (over 63% of the total land area) in the eastern area and wide plains in the western area. The mean altitude is 282 meters above sea level (m a.s.l.) which is slightly higher than Germany (263 m a.s.l.) and much lower than China (1,840 m a.s.l.), the United States (760 m a.s.l.), and Russia (600 m a.s.l.). The climate is a continental climate (hot in summer and cold in winter). Up to 50%–60% of the annual mean precipitation occurs in downpours and severe flooding is frequent during the summer monsoon period (Jun et al. Citation2016).
Figure 1. Map of South Korea, the southern half of the Korean Peninsula bordering the East Sea and Yellow Sea, Northeast Asia; and the location (grey triangles) of the 1,020 study sites (13,366 samples). Thin lines show the five main rivers with national rivers and thick line indicate the four major river basins (Hangang, Nakdonggang, Geumgang, and Yeongsangang-Seomjingang river basin).
Data collection
In 2007, all streams and rivers longer than 10 km were segmented into five or 10 km reaches and possible monitoring sites were screened on site for accessibility, representativeness, stability, and naturalness in South Korea (Lee et al. Citation2011). A Surber sampler (30 cm × 30 cm, 1 mm mesh) was used to collect benthic macroinvertebrates specimens at 1,020 sites (13,366 samples) in South Korea from 2008 to 2015. A total of three ‘replicates’ (approximately 0.27 m2 of habitat) were randomly taken from fast-flowing riffle or gliding run habitats (in the case when suitable riffles were not available) within 100 m in each site (Jun et al. Citation2016). All specimens must be sorted from detritus and inorganic materials. Then a sample consisting of 11 (EPA Citation2013) or 20 (AQEM Citation2002) ‘replicates’ should be taken from all microhabitat types at the sampling site and at least 500 specimens sorted out. However, most NAEMP sites have been sampled twice every year (spring and autumn) or once a year in either spring or autumn. The sites were located in comparatively low-altitude areas (almost all under 500 m a.s.l.) and were very accessible by vehicle. Thus, we supplemented the data using survey results of 40 sites (143 samples) that were almost all over 500 m a.s.l. in the Hangang-river basin from 2010 to 2012 (i.e. four seasons every year or partly once a year) in a program funded by the MOE/Hangang River Management Committee (HRMC).
Physical environmental variables were measured prior to benthic macroinvertebrate sampling. Altitude (m a.s.l.) data of the NAEMP sampling sites was provided from OPENmate Inc. (Seoul, Korea) and data of the HRMC-funded project was registered using a Triton 500 GPS (Magellan Inc., San Dimas, CA, USA). Stream width (m) from bank-to-bank was measured in the field with a Sport 600 laser range finder (Bushnell Inc., Overland Park, KS, USA). Stream orders (Strahler Citation1952) of each study site were decided using a map drawn on a scale of 1:50,000. In addition, the field survey procedures and after-field process (e.g. hand-sorting, identification, and preservation of specimens) followed the NAEMP guidelines. More detailed information of the NAEMP data collection is provided elsewhere (Jun et al. Citation2016).
Stream type classification
Benthic macroinvertebrates were grouped into functional feeding groups (FFGs) (Merritt and Cummins Citation1996) based on behavioral mechanisms of food acquisition and changes in food availability, which are influenced by the size of the stream or river (Allan and Castillo Citation2007) rather than morphological taxonomy only. The major FFGs are shredder (shredded live or dead plant matter), collector (collected suspension or deposited organic matter), scraper (scraped off periphyton or attached algae), and predator (consume other living animal tissues). Every benthic macroinvertebrate specimen was identified to the lowest feasible taxonomic level (generally genus or species level) to assign each to their suitable FFG. Functional composition was described in terms of mean individual abundance/m2 and relative composition (%) based on the individual number of FFGs according to the gradient of the physical environmental variables, including stream order, stream width, and altitude.
When we classified stream types in South Korea, we considered biotic characteristics as the determining factor of biogeographical boundaries. Especially, we focused on mean individual abundance (individuals/m2) of shredder (SH) and collector-filterer (CF) to confirm which was preferable for small or large streams. For example, each FFG presents differently in the mountain and lowland streams, according to their preference for stream size influenced by stream order, stream width, and altitude. Based on these characteristics, we classified five stream types in South Korea. All stream sizes were divided into three stream order groups: wadeable streams, transitional zones, and non-wadeable streams. Transitional zones were assigned to wadeable streams or non-wadeable streams based on stream width. Wadeable streams were classified as mountain streams, highland streams, and lowland wadeable streams according to their altitude (m a.s.l.). Lastly, non-wadeable streams were divided into lowland non-wadeable streams or rivers according to width.
Multivariate statistical analyses
Hierarchical cluster analysis (HCA; Johnson Citation1967) is a method which seeks to build a tree of the data that successively merges similar groups. HCA was applied to individual abundance/m2 data of benthic macroinvertebrates in each stream type. McQuitty's linkage (Sokal Citation1958; McQuitty Citation1966) and Sorensen's (Bray–Curtis) distance method (Bray and Curtis Citation1957) were used to calculate the stream type distances and verify whether or not the five Korean stream types had been adequately classified according to their biogeographical gradient. A hierarchical agglomerative polythetic procedure was employed to the established cluster. Vertical lines represent stream types and horizontal lines represent distances between pairs of stream types in terms of Sorensen's (Bray–Curtis) distances, which originated from the cluster analysis between pairs of stream types, between a stream type and a group of stream types, and between groups of stream types.
Canonical correspondence analysis (CCA; Ter Braak Citation1986) is a method for measuring the linear relationship between two multivariate sets of variables. CCA was performed to capture the relationship between type-specific streams of South Korea and three physical environmental variables and to identify the physical environmental variables that mostly affected each stream type. Two sets of data matrices were used in CCA. The main matrix had a total 642 species listing the benthic macroinvertebrates presented in this study, including average individual abundance/m2 at each sampling site. The second matrix had three physical environmental variables (stream order, stream width, and altitude). Weighted average (WA) scores of the species scores were used to present where the site is in the ordination space. Pearson correlation coefficient analysis was used to compare relationships between axes of CCA and which axes could be more affected by physical environmental variables. Spearman's rank correlations coefficient analysis was used to compare relationships among physical environmental variables. HCA and CCA were performed using PC-ORD (MjM Software, version 6.19, Glenede beach, OR, USA). Pearson and Spearmen's correlation coefficient analysis was performed with PASW for Windows 8, version 6.3 (SPSS Inc., Chicago, IL, USA).
Indicator species analysis (ISA) (Dufrene and Legendre Citation1997) was performed to identify the distribution weights of benthic macroinvertebrates using quantitative and binary (presence/absence) data. Distribution of a species’ average abundance across all stream types (relative abundance) and the percentage of number of sampling in each group in which a species was present (relative frequency) were used for ISA. The values of relative abundance on each species necessarily sum to 100 across all stream types, whereas the values of relative frequency on each species do not sum to 100. The indicator values are a combined product of the species relative abundance with its frequency of occurrence in the various groups of sites. Lastly, we were to find indicator species sensitive to stream types along with stream size and altitude using the indicator values. Monte Carlo randomization test was performed to provide the proportion-based p-value indicating the statistical significance of the observed indicator value.
Results
Relationships among physical environment variables
We present stream width (m), altitude (m, above sea level), stream temperature (°C, mean annual), streambed substrate (phi value of ratio of the substrate surface area), stream depth (m), and flow velocity (cm/s) in subsequent box-plot comparisons with Strahler order () prior to the analysis of the relationship between biota and the physical environment. Stream width and depth steadily increased with the increase of stream order but others did not. Stream order and stream width showed significant positive correlation each other (r = 0.822, p < 0.01; ). Stream width presented a stronger correlation with stream depth (r = 0.428, p < 0.01) than stream order (r = 0.395, p < 0.01). Altitude presented the most significant negative correlation with water temperature (r = −0.454, p < 0.01), followed by substrate size (r = −0.400, p < 0.01; ).
Figure 2. Box and whisker plots of measures of Strahler order versus physical characteristics of the classes of streams based on the 1:120,000-scale for stream width (a), altitude (b), stream temperature (c), streambed substratum (d), stream depth (e), and flow velocity (f). Fifth and 95th percentiles (black circles), 10th and 90th percentiles (vertical dashed line), quartiles (box ends), medians (solid horizontal lines within boxes), and averages (dotted horizontal lines within boxes).
Table 1. Spearman's rank correlations (r) among physical environmental variables.
Relationships between biota and physical environment
Stream size
As stream order ((a)) and stream width ((c)) increased, mean individual abundance/m2 of SHs significantly decreased, whereas CFs distinctly increased, except for the seventh-order and over 600 m streams. Relative composition (%) of CFs based on the individual number also showed similar patterns with mean individual abundance of CF according to stream order ((b)) and stream width ((d)). Relative composition of each CG and SC also slightly decreased with stream order and stream width. However, distribution patterns in both stream order and stream width of SHs, PIs (Piercers), PEs (Predators), and unknowns could not be confirmed because they occupied only a small proportion of the FFGs.
Figure 3. Distribution patterns of FFGs along with stream size characterized by both stream order and stream width. (a) Mean individual abundance/m2 and standard error of CF and SH according to stream order; (b) relative composition (%) of FFG according to stream order; (c) mean individual abundance/m2 and standard error of CF and SH according to stream width; and (d) relative composition (%) of FFG according to stream width.
Based on these results, we classified stream size into zones using stream order (an implied vertical gradient) and stream width (an implied lateral gradient) based on biogeographic characteristics of CF and SH, which showed distinct distribution patterns in mean individual abundance/m2 as stream order and width increased (). All streams were longitudinally divided into wadeable streams (first- to third-order streams), transitional zones that could show environmental characteristics of either wadeable or non-wadeable stream (fourth- and fifth-order streams), and non-wadeable streams (sixth and seventh order streams) according to stream order. Stream size was laterally divided into small (under 15 m), middle (15 to 75 m), and large (over 75 m) streams according to stream width.
Table 2. Classification of stream size focused on vertical (stream order) and lateral (stream width) gradients. A large number of samples (13,366) were used for classification of stream size based on distribution patterns of FFGs with the classification approach for streams and rivers of the EPA (Flotemersch et al. Citation2006).
Altitude
Mean individual abundance/m2 of SHs presented a rapid decrease from the highest altitude to 200 m a.s.l. and then showed a gradual decrease, while CFs showed a steady increase, except under 50 m a.s.l., as altitude decreased ((a)). Relative composition (%) of CFs did not show significant distribution patterns, unlike CFs showing increasing patterns in relative composition (%) in stream order and width increase. However, CGs, which is composed of two kinds of collector feeders, slightly increased as altitude decreased ((b)). SCs also showed continuous decreases of relative composition in altitude decreasing, but others (SH, PI, PE, CG, and the unknown group) showed little differences in altitude.
Figure 4. Distribution patterns of FFGs along with altitude: (a) mean individual abundance and standard error of CF and SH and (b) relative composition (%) of FFG.
Based on these results, we classified altitude (an implied altitudinal stream gradient) into zones based on biogeographic characteristics of CFs and SHs which had distinct distribution patterns in mean individual abundance/m2 as altitude decreased (). Altitude was divided into high-altitude streams (over 450 m a.s.l.), mid-altitude streams (200–450 m a.s.l.), and low-altitude stream (under 200 m a.s.l.), while WFD has described the characterization of surface water body types, including altitude typology (high: >800 m, mid-altitude: 200–800 m, lowland: <200 m).
Table 3. Classifications of altitude focused on altitude. A large number of samples (13,366) were used for classification of altitude based on distribution patterns of FFGs with descriptors of the ecoregion of the WFD (WFD Citation2000).
Classification of stream types
Stream type classification procedures
We classified five stream types of South Korea based on types of stream size and altitude (). All streams were categorized as either wadeable stream (first- to third-order streams or a stream width under 75 m among fourth- and fifth-order streams) or non-wadeable stream (sixth- and seventh-order streams, or a stream width 75 m and over among fourth- and fifth-order streams) focused on vertical and lateral stream gradients characterized by stream order and width. Wadeable streams were classified into mountain streams (450 m a.s.l. and over), highland streams (under 450 to 200 m a.s.l. and over), and lowland streams (under 200 m a.s.l.) focused on altitude. Non-wadeable streams were divided into two groups lowland non-wadeable stream (stream width 600 m and under) and river (over 600 m) according to width, focused on the characteristics of the lateral gradient.
Figure 5. Five stream types of South Korea focused on vertical, lateral, and altitude characteristics of streams using types of stream size and altitude. A large number of samples (13,366) were used for the classification of Korean stream types. Wadeable streams were divided into mountain, highland, and lowland wadeable streams. Non-wadeable streams were divided into lowland non-wadeable streams and rivers.
Biotic and abiotic relationships with Korean stream types
SHs and CFs showed opposite distribution patterns from each other in mean individual abundance/m2, along with a longitudinal gradient of five stream types, as they showed similar patterns in each physical environmental variable (stream order, stream width, and altitude). Particularly, mean individual abundance/m2 of SHs showed a drastic decrease from mountain to lowland wadeable streams and then gradually decreased from lowland streams to rivers. CFs, on the other hand, increased constantly from mountain to lowland wadeable streams and then rapidly decreasing with respect to rivers after a drastic increase with respect to non-wadeable stream ((a)).
Figure 6. Distribution patterns of CF and SH along with stream types and clustering characteristics of stream types: (a) mean individual abundance/m2 and standard error of CF and SH according to stream types; and (b) dendrogram of five stream types based on mean individual abundance/m2 of benthic macroinvertebrates using the McQuitty's linkage and Sorensen's (Bray–Curtis) distance method (MO, mountain stream; HI, highland stream; LW, lowland wadeable stream; LN, lowland non-wadeable stream; RI, river).
We used HCA to identify whether stream types have been adequately classified according to physical environmental variables or not. As shown in the HCA dendrogram, two groups (streams and rivers) can be distinguished below a linkage distance of <0.31 ((b)). Depending on the distance, different explanations can be inferred. Mountain (MO)/highland (HI) and lowland wadeable (LW)/lowland non-wadeable (LN) can form two distinct groups just below a linkage distance of 0.18, with the river (RI) forming a separate group. Thus, we expected that five Korean stream types were appropriately distinguished according to their biogeographical characteristics.
CCA was used to relate physical environmental variables to 1,020 sampling sites along with stream types ((a)). The total variance in the species data was 13.61 ((a)). The altitude parameter was located in the opposite direction from stream order and stream width ((b)). Axis 1 (eigenvalue: 0.335) represented the altitude, where high-altitude streams were ordinated towards the right side and low-altitude streams were on left side. Thus, mountain, highland, and a few lowland wadeable streams were significantly affected by altitude whereas most lowland wadeable streams, lowland non-wadeable streams, and rivers located on left side of Axis 2 (eigenvalue: 0.133) were more influenced by stream order and width than altitude. Three physical environmental variables (stream order, stream width, and altitude) had significant correlations with the two axes. Especially, altitude presented the most significant correlation with Axis 1 (r = 0.811, p < 0.01) ((b)). Stream order was the most significant contributor (r = −0.498, p < 0.01) with Axis 2, followed by stream width (r = −0.341, p < 0.01). Based on these results, we suggest that each stream size and altitude is appropriate for determination of benthic macroinvertebrate assemblages in high- or low- altitude environments.
Figure 7. Canonical correspondence analysis (CCA) multivariate ordination diagram relating 1,020 sampling sites to three physical environmental variables in South Korea. The plots present the ordination of sampling sites (a), and arrow length is proportional to relative importance (b) of the stream order, stream width, and altitude. W: wadeable stream, NW: non-wadeable stream.
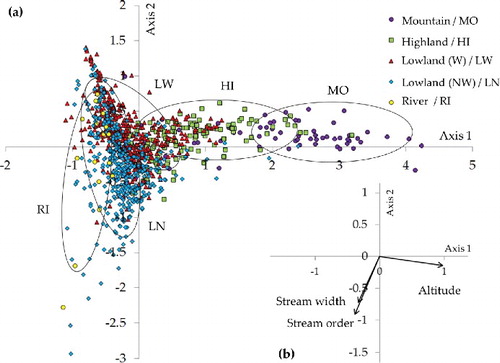
Table 4. Result of ordinations by canonical correspondence analysis (CCA) of data on 1020 sampling sites within a physical environmental (a) and Pearson correlation coefficients for the first three axes (b).
Indicator species of Korean stream types
We selected indicator species which were mostly distributed in a single stream type using ISA. However, we excluded many species that showed wide distribution patterns and irregular distribution patterns (p > 0.05) across several stream types (). Rare species (i.e. those that exist only in a few microhabitats with low occurrence) were also removed, although they were present (p < 0.05) in a single stream type (Scopura laminata Uchida and Bleptus fasciatus Eaton). Twenty five species (Mollusca: one species, Annelida: two species, Isopoda: one species, Decapoda: three species, Ephemeroptera: five species, Odonata: one species, Plecoptera: three species, Hemiptera: one species, Coleoptera: one species, Diptera: two species, and Trichoptera: five species) ranked in the top five in each stream type in terms of indicator values, and were selected as the indicator species sensitive to Korean stream types, along with stream size and altitude. Indicator values of each indicator species (p < 0.05) in a single stream type showed significant differences with indicator species in other stream types. Especially, indicator species with preferences for mountain streams showed distinct distributions in mountain streams, whereas others showed slightly wider distribution patterns in each stream type.
Table 5. Twenty-five indicator species (p < 0.05) sensitive to stream types, along with stream size and altitude in each stream type: (i) preference for mountain stream, (ii) preference for highland stream, (iii) preference for lowland wadeable stream, (iv) preference for lowland non-wadeable stream, and (v) preference for rivers. Monte Carlo randomization test results provided the proportion-based p-value indicating the statistical significance of the observed indicator value.
Discussion
A biotic stream assessment system that can indicate the gradient of both physical and chemical environmental variables is required because the existing simple chemical monitoring may not detect the integrative health condition of the aquatic ecosystem due to degradations of the physical environment (Judy et al. Citation1984). Physical environmental variables, including stream order (Vannote et al. Citation1980), altitude (Ormerod et al. Citation1994), flow velocity (Nelson and Lieberman Citation2002), streambed substrates (Merz and Ochikubo Chan Citation2005; Xuehua et al., Citation2009), water temperature (Harper and Peckarsky Citation2006), and stream width (Heino et al. Citation2005), are not only important determinants of biotic organisms, but also provide information on nonchemical stressors. However, a complete stream assessment system based on type-specific ecosystems is globally unavailable, although both stream classification and stream assessment system have a long history during the past centuries. Little is known of the relationship between biological assemblages and the physical environmental gradient which remains scarce in South Korea. Thus, we classified streams of South Korea into five types to provide information regarding (i) the distribution patterns of benthic macroinvertebrates, along with physical environmental variables; (ii) indicator species that preferred specific physical environments characterized by stream size and altitude; and (iii) basic information for establishing the future biotic stream assessment system based on type-specific ecoregions.
Criteria to classify streams
Stream and river (lotic ecosystems) size was the major factor influencing the structure of benthic macroinvertebrate communities (Heino et al. Citation2005). Stream size, which increases with downstream distance under natural conditions, can be divided into two stream types (wadeable and non-wadeable) characterized by stream depth (vertical gradient). Wadeable and non-wadeable streams can be defined as a reach the investigator can or cannot wade along its longitudinal (Meador et al. Citation1993) or lateral section (i.e. from bank to bank) (Edsall et al. Citation1997). Non-wadeable streams often exhibit distinctive microhabitats that are attractive to some species (Ward Citation1998; Kantor et al. Citation2001), including Odonata, Hemiptera, and Coleoptera, different from wadeable streams. However, sampling protocols for the bioassessment of lotic ecosystem have focused on wadeable streams because, until quite recently, sampling in wadeable streams is easier compared to non-wadeable streams (Barbour et al. Citation1999). Habitat assessment is also usually limited from non-wadeable studies (Goldstein et al. Citation2000). Non-wadeable stream physical habitat field sampling approaches (Peck et al. Citation2005) and applications of quantitative physical habitat sampling in continental-scale monitoring and assessment (Hughes and Peck Citation2008; Paulsen et al. Citation2008) have become relatively commonplace in recent years. Thus, we have to continue to consider the physical environmental characteristics of non-wadeable streams in stream assessment systems. Environmental standards for defining wadeable or non-wadeable streams are diverse across the country (Flotemersch et al. Citation2006), although there is no international consensus on what criteria should be used to differentiate the stream type. Stream size can be generally designated by using stream order (Strahler Citation1952; Sheehan and Rasmussen Citation1999) or drainage area (Reash Citation1999). Specifically, Vannote et al. proposed that broad characteristics of stream size can be grouped into headwaters (first–third orders), medium-sized streams (fourth–sixth orders), and large rivers (greater than sixth-order) based on stream order (Illies and Lazare Citation1963). In the US, the Ohio Environmental Protection Agency (EPA) (Ohio EPA, Citation1989) defined stream size using drainage area/k m2 (i.e. headwaters: ∼1 to <20, wading: 20 to <200, small rivers: 200 to <1,000, and large rivers: ≥1,000. Furthermore, the US EPA designated stream size using both stream order and drainage area with transitional zones from wadeable to non-wadeable, because stream size cannot be clearly separated into two types, but rather gradually changes (Flotemersch et al. Citation2006). Most recently, Germany defined stream size using drainage area according to the EU-WFD (Arle et al. Citation2014). Many other physical environmental parameters have also been used for define stream size (average water depth (Stalnaker et al. Citation1989), stream width (Simonson et al. Citation1994), mainstem length (Wilhelm et al. Citation2005), and mean annual discharge/m3 (Ward and Stanford Citation1982).
The first physical environmental variable that we used for differentiating stream size into wadeable stream, transitional zone, and non-wadeable stream was stream order, rather than drainage area, because biotic communities can present differently according to differences of stream size in a single drainage area. For example, we suggest that some different biotic communities may prefer the first-order streams to the second-order streams, although they occur in the both of them in a single drainage area. The second physical environmental variable that we used among other parameters was stream width because that entailed other gradient characteristics of physical environmental variables including flow velocity, water depth, and substrate size (Jiang et al. Citation2010). Thus, we expect that both stream order and width are appropriate for classification of stream size.
Stream temperature affects the growth rate and emergence timing of benthic macroinvertebrates (Ward and Stanford Citation1982), and also the distribution patterns of benthic macroinvertebrates with respect to altitude. Stream temperature has a linear relationship with air temperature (Pilgrim et al. Citation1998; Morrill et al. Citation2005) and generally decreases along with higher altitude. Furthermore, WFD suggests that classification of bioregions in European countries include altitude (high: >800 m, mid-altitude: 200–800 m, and lowland <200 m) (WFD Citation2000). Altitude is also one of the most important parameters of distribution patterns of benthic macroinvertebrates in South Korea, but altitude presents comparatively poor relationships under 100 m a.s.l. compared to high altitude (Jun et al. Citation2016). Based on the above descriptions, we decided that the stream size parameter alone has not proven to be a predictor of whether a stream is mountain or lowland at similar stream sizes. Thus, we used altitude for classification of wadeable streams to reflect stream temperatures because stream temperature measured on long-term and regular bases were not measured in the same sampling sites during the field survey.
Biotic and Abiotic characteristics of Korean stream types
The RCC is an important model in stream ecology, which can describe structural and functional characteristics of biotic communities along the longitudinal gradient with stream size (Illies and Lazare Citation1963). Benthic macroinvertebrates can be grouped into FFGs according to the RCC model influenced by stream size (Heino et al. Citation2005). Distribution patterns of FFGs (shredder, collector-gatherer, CF, scraper, predator, piercer, and unknown) have best accounted for the gradient of physical environmental variables. For example, the FFG composition of benthic macroinvertebrate assemblages should shift from the shredder-dominated headwaters to the collector-dominated lower reaches in large rivers (Vannote et al. Citation1980; Minshall et al. Citation1983) according to RCC with their own preferences of primary food resources. However, scrapers showed the highest abundances in the middle stream or large rivers (Edsall et al. Citation1997) and others also showed little significant distribution patterns.
When we classified five Korean stream types, we considered the different aspects related with distribution patterns of both shredders and collectors. As we had expected, shredders and CFs showed significant opposite distributions to each other according to stream order, stream width, and altitude, except that all taxa showed drastic declines in the lowest reach (seventh-order, width >600 m, and <50 m a.s.l.) of each physical environmental variable ( and ). Abundance of benthic macroinvertebrate commonly decreases in large rivers that showed habitat characteristics of pools of deeper water depth, lower velocity, and finer bed materials than riffles of the upper stream (Carter and Fend Citation2001). We presume that these results may reflect drastic environmental changes from small to mid-sized, and large streams, and do not reflect sampling efficiency or differences in sampling procedures. Korean stream types also showed significant differences between each other according to the longitudinal gradient by dividing streams into three groups: (i) mountain and highland streams; (ii) lowland wadeable stream and lowland non-wadeable stream; and (iii) rivers in the HCA ((b)). Especially, mountain and highland streams which showed significant relationship with altitude were clearly discriminated from lowland wadeable streams and lowland non-wadeable streams, and rivers, which related significantly with stream order and width in CCA (). Based on these results, we expect that Korean stream types adequately reflect stream size and altitude of Korean streams according to RCC because both shredders and collectors showed significant distribution patterns from mountain streams via highland, lowland wadeable stream, lowland non-wadeable streams to rivers, like they showed in three physical environmental variables.
Germany is one of the European countries that currently meets the requirements of the WFD. Firstly, Germany distinguished eco-regions into three altitudinal types (alpine, highlands, and lowlands) and one independent type (i.e. organic streams, floodplains, and lake outflows). Secondly, four eco-region types were classified into 25 specific watercourse types with further sub-types based on several physical parameters (stream size and channel substrates) and physico-chemical water conditions with geological classification (siliceous, calcareous, and organic status) (Arle et al. Citation2014). We also classified Korean stream types using physical parameters of stream order, stream width, and altitude () whereas geological classification was not considered because it has not been measured for water management in South Korea. Unfortunately, lentic ecosystem were also excluded from this study owing to scarcity in long-term studies on lentic macroinvertebrate and physical environmental variables at fixed sampling sites in South Korea. Therefore, further examinations related with geological study are required for decisions into whether geological characteristics have to be considered or not. Furthermore, measurement of diurnal, seasonal, and long-term variations of lentic ecosystems are also required for more specific classifications of Korean water bodies in the future.
Indicator species of Korean Stream Types
Indicator species have been used as convenient assessment tools of environmental status for a long time (Tomas Citation1972; Zonneveld Citation1983). Additionally, benthic macroinvertebrate assemblages are commonly used as the indicator for rapid stream assessment (Plafkin et al. Citation1989; Smith et al. Citation1999). They have been successfully used to assess water quality (Shubert Citation1984; Rosenberg et al. Citation1986). Studies of Yoon et al. (Citation1992a; Citation1992b; Citation1992c) were the first case of indicator species with their own indicator value based on water quality of Korean benthic macroinvertebrates. The relationship between organic pollutants and benthic macroinvertebate communities with their own indicator values were already well known to many stream ecologists in South Korea (Won et al. Citation2006; Kong et al. Citation2012). Furthermore, distribution patterns and indicator values of many benthic macroinvertebrate taxa based on physical environmental variables (e.g. stream temperature (Kong et al. Citation2013) and streambed substrate (Kong and Kim Citation2016) have been studied years ago. Most recently, biotic stream assessment systems based on physical environmentally specific ecoregions are regarded as a future-oriented method. Nevertheless, even studies on stream typology based on physical environmental variables, along with distributions of benthic macroinvertebrates, are insufficient.
Indicator values of species can be calculated by four kinds of approaches: (i) mean number of individuals (Kong et al. Citation2012); (ii) actual mean number of individuals (Kong and Kim Citation2016); (iii) relative frequency of occurrence (Kong et al. Citation2013); and (iv) combined relative abundance with frequency (i.e. relative mean abundance with relative frequency of occurrence) (Dufrene and Legendre Citation1997; Kong and Kim Citation2016) assigned to each physical environment type. We used the combined relative abundance with frequency, which showed the highest correlations with streambed substrate rather than others (Kong and Kim Citation2016) to calculate indicator values of 25 indicator species that we proposed as candidate species, which mainly showed preference for a single stream type (). Thus, we expect that the 25 indicator species will help to understand stream ecosystem variations. Still, other approaches also need to be checked in further research of stream-specific assessment systems.
Biota can be divided into two groups according to whether those able to adapt to diverse environments or adapt to only a specific environment. The former are commonly called the euryhabitat species (having a wide distribution) and the later are stenohabitat species (having a narrow distribution) (Bingchuan Citation1987). Stenohabitat species with higher value of indicator species can help us to understand differences within biogeographic environments of stream ecosystem. Especially, indicator species of mountain wadeable stream including Protonemura KUa, Taenionema KUc, Megarcys ochracea Klapalek, Rhyacopila articulate Morton, and Arctopsyche ladogensis Kolenati, have also been selected as candidate indicator species that are sensitive and vulnerable to warmth, along with climate change, in a previous study (Kong et al. Citation2013). Thus, indicator species and some rare species, such as S. laminata Uchida and B. fasciatus Eaton need to be continuously traced and managed to help understand the complex degradations of stream ecosystem because they have combined potential to interpret the physico-chemical environmental characteristics.
Conclusions
Analyzing the 642 species of benthic macroinvertebrate distributions according to stream size and altitude in South Korea, we propose five Korean stream types and 25 indicator species sensitive to variations of stream size and altitude. We expect that Korean stream types can be applicable to the dividing biogeographic differences of Korean streams. Furthermore, this study is expected to be used for development of a future biotic stream assessment system based on stream typology. We have to constantly keep tracing and conserving the habitats of indicator species because they will assist in interpreting physical changes of stream ecosystem. Studies of the influence of geological factors on streams and constant lentic ecosystem surveys are required for more complete classifications of Korean water bodies in future studies.
Acknowledgements
This study was performed under the two projects: (i) ‘National Aquatic Ecosystem Health Survey and Assessment’, which was funded by the Ministry of Environment (MOE) and the National Institute of Environmental Research; and (ii) ‘Effects of Climate Change on Aquatic Ecosystem and Control Measures’, which was funded by the MOE and Hangang River Management Committee, South Korea. The authors would like to thank all the researchers who participated in the projects for their efforts in the field survey and after field process.
Disclosure statement
No potential conflict of interest was reported by the authors.
Additional information
Notes on contributors
Jin-Young Kim
Jin-Young Kim is a PhD researcher at Watershed Ecology Research Team, Water Environment Research Department in National Institute of Environmental Research, South Korea with interests in freshwater ecology related to benthic macroinvertebrates.
Pil-Jae Kim
Pil-Jae Kim is a PhD candidate at the Department of Life Science in Kyonggi University where he has studied sampling method of benthic macroinvertebrates in freshwater stream sediment.
Soon-Jin Hwang
Soon-Jin Hwang is a professor at the Department of Environmental Health Science in Konkuk University where he researches freshwater ecology related to control of harmful algae and epilithic diatom.
Jae-Kwan Lee
Jae-Kwan Lee is a senior researcher and department head at Water Environment Research Department in National Institute of Environmental Research, South Korea with interests in freshwater environment research.
Su-Woong Lee
Su-Woong Lee is a senior researcher and team leader at Watershed Ecology Research Team, Water Environment Research Department in National Institute of Environmental Research, South Korea with interests in freshwater ecology research.
Chang-Hee Park
Chang-Hee Park is a senior researcher at Watershed Ecology Research Team, Water Environment Research Department in National Institute of Environmental Research, South Korea with interests in freshwater ecology research.
Jeong-Suk Moon
Jeong-Suk Moon is a researcher at Watershed Ecology Research Team, Water Environment Research Department in National Institute of Environmental Research, South Korea with interests in freshwater ecology research.
Dong-Soo Kong
Dong-Soo Kong is a professor at the Department of Life Science, Kyonggi University where he researches freshwater ecology related to aquatic organisms such as benthic macroinvertebrate, fish, and algae.
References
- Allan JD, Castillo MM. 2007. Stream ecology: structure and function of running waters. Dordrecht: Springer Science & Business Media.
- AQEM CONSORTIUM. 2002. Manual for the application of the AQEM system. A comprehensive method to assess European streams using benthic macroinvertebrates, developed for the purpose of the water framework directive, version, 1. Contract No: EVK1-CT1999-00027, EU Projects.
- Arle J, Blondzik K, Claussen U, Duffek A, Grimm S, Hilliges F, Hoffmann A, Leujak W, Mohaupt V, Naumann S, et al. 2014. Environmental policy, water resources management in Germany. Part 2. Water quality, federal ministry of environment, nature conservation, building and nuclear safety, 53048 Bonn. Bonn: Federal Ministry for the Environment, Nature Conservation, Construction and Nuclear Safety; p. 37–58.
- Barbour MT, Gerritsen J, Snyder B, Stribling J. 1999. Rapid bioassessment protocols for use in streams and wadeable rivers. Washington (DC): USEPA.
- Bingchuan X. 1987. Biogeographical provincialism and biomigratory barriers during the permo-carboniferous in China. GeoJournal. 14:429–434.
- Bray JR, Curtis JT. 1957. An ordination of the upland forest communities of Southern Wisconsin. Ecol Monogr. 27:325–349.
- Carter JL, Fend SV. 2001. Inter-annual changes in the benthic community structure of riffles and pools in reaches of contrasting gradient. Hydrobiologia. 459:187–200.
- Dufrene M, Legendre P. 1997. Species assemblages and indicator species: the need for a flexible asymmetrical approach. Ecol Monogr. 67:345–366.
- Edsall TA, Behrendt TE, Cholwek G, Frey JW, Kennedy GW, Smith SB. 1997. Use of remote-sensing techniques to survey the physical habitat of large rivers. Ann Arbor (MI): US Geological Survey, Great Lakes Science Center.
- EPA. 2013. National rivers and streams assessment 2008-2009 a collaborative survey. Washington (DC): Environmental Protection Agency.
- Faustini JM, Kaufmann PR, Herlihy AT. 2009. Downstream variation in bankfull width of wadeable streams across the conterminous United States. Geomorphology. 108:292–311.
- Flotemersch JE, Stribling JB, Paul MJ. 2006. Concepts and approaches for the bioassessment of non-wadeable streams and rivers. Washington (DC): US Environmental Protection Agency, Office of Research and Development.
- Goldstein RM, Lorenz D, Niemela S. 2000. Development of a stream habitat index for use with an index of biotic integrity in the St. Croix River Basin, Minnesota. Mounds View (MN): US Department of the Interior, US Geological Survey, Branch of Information Services; p. 2000 [ distributor].
- Harper MP, Peckarsky BL. 2006. Emergence cues of a mayfly in a high-altitude stream ecosystem: potential response to climate change. Ecol Appl. 16:612–621.
- Heino J, Parviainen J, Paavola R, Jehle M, Louhi P, Muotka T. 2005. Characterizing macroinvertebrate assemblage structure in relation to stream size and tributary position. Hydrobiologia. 539:121–130.
- Hering D, Moog O, Sandin L, Verdonschot PFM. 2004. Overview and application of the AQEM assessment system. Hydrobiologia. 516:1–20.
- Hughes RM, Peck DV. 2008. Acquiring data for large aquatic resource surveys: the art of compromise among science, logistics, and reality. J N Am Benthol Soc. 27:837–859.
- Humphries P, Growns JE, Serafina LG, Hawking JH, Chick AJ, Lake PS. 1997. Macroinvertebrate sampling methods for lowland Australian rivers. Hydrobiologia. 364:209–218.
- Hughes RM, Kaufmann PR, Weber M. 2011. National and regional comparisons between Strahler order and stream size. J N Am Benthol Soc. 30:103–121.
- Illies J and Lazare B. 1963. Problems and methods of the classification and ecological zonation of running water, considered mainly from a faunistic point of view [Problèmes et méthodes de la classification et de la-zonation écologique des eaux courantes, considérées surtout-du point de vue faunistique]. French. Stuttgart: E. Schweizerbart.
- Jiang XM, Xiong J, Qiu JW, Wu JM, Wang JW, Xie ZC. 2010. Structure of macroinvertebrate communities in relation to environmental variables in a subtropical Asian river system. Int Rev Hydrobiol. 95:42–57.
- Johnson SC. 1967. Hierarchical clustering schemes. Psychometrika. 32:241–254.
- Judy Jr RD, Seeley PN, Murray TM, Svirsky SC, Whitworth MR. 1984. 1982 National fisheries survey. Volume I. Technical report: Initial findings, DTIC Document. Washington (DC): Department of the Interior, US Fish and Wildlife Service.
- Junk WJ, Bayley PB, Sparks RE. 1989. The flood pulse concept in river-floodplain systems. Can Spec Publ Fish Aquat Sci. 106:110–127.
- Jun Y-C, Kim N-Y, Kim S-H, Park Y-S, Kong D-S, Hwang S-J. 2016. Spatial distribution of benthic macroinvertebrate assemblages in relation to environmental variables in Korean nationwide streams. Water. 8:27.
- Kantor S, Naiman R, Bilby RE. 2001. River ecology and management: lessons from the pacific coastal ecoregion. Ann Arbor (MI): Springer Science & Business Media.
- Kong D, Kim JY. 2016. [Development of benthic macroinvertebrates streambed index (BMSI) for bioassessment of stream physical habitat]. J Korean Soc Water Environ. 32:1–14. Korean.
- Kong D, Kim JY, Son SH, Oh MW, Choi AR, Byeon MS. 2013. Development and application of Korean thermality index (KTI) for biological assessment on climate change. J Korean Soc Water Environ. 29:114–126. Korean.
- Kong D, Son SH, Kim JY, Won DH, Kim MC, Park JH, Chon TS, Lee JE, Park JH, Kwak IS, et al. 2012. In Development and application of Korean benthic macroinvertebrates index for biological assessment on stream environment, 2012 Spring Conference and water environmental forum of Yeongsan River; South Korea. Korean J Ecol Environ. p. 114–126. Korean.
- Lee S-W, Hwang S-J, Lee J-K, Jung D-I, Park Y-J, Kim J-T. 2011. Overview and application of the national aquatic ecological monitoring program (NAEMP) in Korea. Ann Limnol - Int J Lim. 47:S3–S14.
- Lorenz CM, Van Dijk GM, Van Hattum AGM, Cofino WP. 1997. Concepts in river ecology: implications for indicator development. Regul Rivers: Res Mgmt. 13:501–516.
- McQuitty LL. 1966. Similarity analysis by reciprocal pairs for discrete and continuous data. Educ Psychol Meas. 26:825–831.
- Meador MT, Hupp CR, Cuffney TF, Gurtz ME. 1993. Methods for characterizing stream habitat as part of the national water-quality assessment program. Open-file report 93-408. Reston, Va.
- Merritt RW, Cummins KW. 1996. An introduction to the aquatic insects of North America. Dubuque (IA): Kendall Hunt.
- Merz JE, Ochikubo Chan LK. 2005. Effects of gravel augmentation on macroinvertebrate assemblages in a regulated California river. River Res App. 21:61–74.
- Minshall GW, Petersen RC, Cummins KW, Bott TL, Sedell JR, Cushing CE, Vannote RL. 1983. Interbiome comparison of stream ecosystem dynamics. Ecol Monogr. 53:1–25.
- Morrill JC, Bales RC, Conklin MH. 2005. Estimating stream temperature from air temperature: implications for future water quality. J Environ Eng. 131:139–146.
- Nelson SM, Lieberman DM. 2002. The influence of flow and other environmental factors on benthic invertebrates in the Sacramento river, USA. Hydrobiologia. 489:117–129.
- Ohio EPA. 1989. Biological criteria for the protection of aquatic life. Columbus (OH): Ohio Environmental Protection Agency, Division of Water Quality Monitoring and Assessment. Vol. III.
- Ormerod SJ, Rundle SD, Wilkinson SM, Daly GP, Dale KM, Juttner I. 1994. Altitudinal trends in the diatoms, bryophytes, macroinvertebrates and fish of a Nepalese river system. Freshwater Biol. 32:309–322.
- Paulsen SG, Mayio A, Peck DV, Stoddard JL, Tarquinio E, Holdsworth SM, Van Sickle J, Yuan LL, Hawkins CP, Herlihy AT, et al. 2008. Condition of stream ecosystems in the US: an overview of the first national assessment. J N Am Benthological Soc. 27:812–821.
- Peck DV, Averill DK, Herlihy AT, Hughes RM, Kaufmann PR, Klemm DJ, Lazorchak JM, McCormick FH, Peterson SA, Cappaert MR, et al. 2005. Environmental monitoring and assessment program – surface waters western pilot study: Field Operations Manual for Non-Wadeable Rivers and Streams. EPA/620/R-06/003, 2006.Washington (DC): US Environmental Protection Agency.
- Pilgrim JM, Fang X, Stefan HG. 1998. Stream temperature correlations with air temperatures in Minnesota: implications for climate warming. J Am Water Resour Assoc. 34:1109–1121.
- Plafkin JL, Barbour MT, Porter KD, Gross SK, Hughers RM. 1989. Rapid bioassessment protocols. Washington(DC): US Environmental Protection Agency.
- Reash R. 1999. Considerations for characterizing Midwestern large river habitats: assessing the sustainability and biological integrity of water resources using fish communities. Boca Raton (FL): CRC Press; p. 463–474.
- Rosenberg DM, Danks H, Lehmkuhl DM. 1986. Importance of insects in environmental impact assessment. Environ Manage. 10:773–783.
- Sheehan RJ, Rasmussen JL. 1999. Large rivers. In: Kohler C, WAH, Editors Inland fisheries management in North America. 2nd ed. Bethesda (MD): American Fisheries Society; p. 529–559.
- Shubert LE. 1984. Algae as ecological indicators. In: Algae as ecological indicators. New York: Academic Press.
- Simonson TD, Lyons J, Kanehl PD. 1994. Guidelines for evaluation of fish habitat in Wisconsin streams. St. Paul (MN): General Technical Report NC-164, USDA Forest Service.
- Smith MJ, Kay WR, Edward DHD, Papas PJ, Richardson KSJ, Simpson JC, Pinder AM, Cale DJ, Horwitz PHJ, Davis JA. 1999. AUSRIVAS: using macroinvertebrates to assess ecological condition of rivers in Western Australia. Freshwater Biol. 41:269–282.
- Sokal RR. 1958. A statistical method for evaluating systematic relationships. Univ Kans Sci Bull. 38:1409–1438.
- Stalnaker CB, Milhous RT, Bovee KD. 1989. In: Hydrology and hydraulics applied to fishery management in large rivers. International Large River Symposium Ottawa (ON): Department of Fisheries and Oceans.
- Strahler AN. 1952. Hypsometric (area-altitude) analysis of erosional topography. Geol Soc Am Bull. 63:1117–1142.
- Ter Braak CJ. 1986. Canonical correspondence analysis: a new eigenvector technique for multivariate direct gradient analysis. Ecology. 67:1167–1179.
- Thomas WA. 1972. Indicators of environmental quality: an overview. In: Thomas WA, Editor Indicators of environmental quality. New York: Springer: Plenum Press; p. 1–5.
- Thorp JH, Delong MD. 1994. The riverine productivity model: an heuristic view of carbon sources and organic processing in large river ecosystems. Hoboken (NJ): Wiley; p. 305–308.
- Vannote RL, Minshall GW, Cummins KW, Sedell JR, Cushing CE. 1980. The river continuum concept. Can J Fish Aquat Sci. 37:130–137.
- Ward J. 1998. Riverine landscapes: biodiversity patterns, disturbance regimes, and aquatic conservation. Biol Conserv. 83:269–278.
- Ward JV, Stanford JA. 1982. Thermal responses in the evolutionary ecology of aquatic insects. Annu Rev Entomol. 27:97–117.
- Ward JV, Stanford JA. 1995. The serial discontinuity concept: extending the model to floodplain rivers. Regul Rivers: Res Mgmt. 10:159–168.
- WFD. 2000. E.U. Directive 2000/60/EC of the European parliament and of the council establishing a framework for the community action in the field of water policy. Brussels: The European Parliament and the Council of the European Union.
- Wilhelm JG, Allan JD, Wessell KJ, Merritt RW, Cummins KW. 2005. Habitat assessment of non-wadeable rivers in Michigan. Environ Manage. 36:592–609.
- Won DH, Jun YC, Kwon SJ, Hwang SJ, Ahn KG, Lee JK. 2006. Development of Korean saprobic index using benthic macroinvertebrates and its application to biological stream environment assessment. J Kor Soc Water Quality. 22:768–783. Korean.
- Wright JF, Sutcliffe DW, Furse MT. 2000. Assessing the biological quality of fresh waters: RIVPACS and other techniques. Freshwater biological association. Ambleside: The RIVPACS International Workshop.
- Xuehua D, Zhaoyin W, Mengzhen X, Zhang K. 2009. Effect of streambed sediment on benthic ecology. Int J Sediment Res. 24:325–338.
- Yoon IB, Kong DS, Ryu JK. 1992a. Studies on the biological evaluation of water quality by benthic macroinvertebrates (1) - Saprobic valency and indicative value. Korean J Environ Biol. 10:24–49. Korean.
- Yoon IB, Kong DS, Ryu JK. 1992b. Studies on the biological evaluation of water quality by benthic macroinvertebrates (2) – effects of environmental factors to community. Korean J Environ Biol. 10:40–55. Korean.
- Yoon IB, Kong DS, Ryu JK. 1992c. Studies on the biological evaluation of water quality by benthic macroinvertebrates (3) – macroscopic simple water quality evaluation. Korean J Environ Biol. 10:77–84. Korean.
- Zonneveld I. 1983. Principles of bio-indication. In: Bes EPH, Haeck J, Editors. Ecological indicators for the assessment of the quality of air, water, soil, and ecosystems. Enschede: Springer; p. 207–217.