
Abstract
While there is substantial support for the river continuum concept (RCC) using aquatic macroinvertebrates, nearly all of this support has come from studies using benthic specimen counts or relative biomass as the basis for comparing sites. We instead assessed the RCC using the ash-free dry mass (AFDM) of winged adult Ephemeroptera, Plecoptera, and Trichoptera (EPT) specimens. Insects were sampled at 13 sites along a 100 km 2nd–4th order reach of the Pine River in northern Lower Michigan using ultraviolet lights. Specimens were identified to the genus level and the AFDM of each functional feeding group (FFG) was calculated. Forty-two environmental and river morphological variables were tested for their ability to predict differences in EPT FFG biomass. A determined environmental gradient relating to increasing river size predicted over 80% of FFG biomass differences. Biomass of each individual FFG increased along the determined gradient, except for scrapers which decreased at the most downstream sites. The number of EPT genera also increased along the gradient. Our results were similar to those of previous studies, except that shredders nearly doubled in importance compared to RCC predictions, suggesting a greater ecological impact of shredders on forested streams than is typically reported.
Introduction
The river continuum concept (RCC) (Vannote et al. Citation1980; Doretto et al. Citation2020) predicts changes in variables such as canopy cover, availability and type of organic carbon, and the relative importance of different macroinvertebrate functional feeding groups (FFGs) as rivers widen. It also provides a null model against which deviations from predicted continuity can be compared. While probably an oversimplification that ignores patchy discontinuities along a stream gradient based on differences in local habitats (Thorp et al. Citation2006; Collins et al. Citation2018; Houghton et al. Citation2018; Maasri et al. Citation2021), the RCC nonetheless provides a strong conceptual framework for evaluating river systems, especially as spatial scale increases and the relative importance of local habitats diminishes (Grubaugh et al. Citation1996; Tomanova et al. Citation2007; Rosi-Marshall et al. Citation2016; Curtis et al. Citation2018; Larsen et al. Citation2019; Pollice et al. Citation2020). Nearly all studies evaluating the RCC and its effects on the stream biota have done so by using relative counts or biomass of benthic specimens as the basis of their metrics.
Using the relative importance of benthic specimens to evaluate the RCC has two inherent challenges. First, the success of sampling benthic aquatic insects is dependent on sampling effort (Cao et al. Citation2002) and the specific sampling device used. Many common benthic collecting devices over-emphasize shallow habitats with uniform substrate, while under-sampling large woody debris, the undersides of large boulders, deep-water pools, bank habitats, and near-shore vegetation (Gerth and Herily Citation2006; Chessman et al. Citation2007; Cao and Hawkins Citation2011). Second, since most studies of FFG composition are of relative (not absolute) abundance, it is difficult to know if a perceived decrease in the relative abundance of a FFG represents an actual decrease, or is instead an increase concealed by greater increases in the other FFGs.
The objective of this study was to assess continuity in a temperate forested river by determining differences in FFGs between sites using the total organic biomass of winged adult Ephemeroptera, Plecoptera, and Trichoptera (EPT) specimens. Benthic EPT specimens are frequently used in biomonitoring protocols due to their abundance, broad distribution, wide and representative distribution in all FFGs, and general sensitivity to changes in water quality (Kitchin Citation2005; Masese and Raburu Citation2017; South et al. Citation2018). Adult EPT specimens, particularly those of the Trichoptera, are attracted to ultraviolet lights regardless of FFG or natal microhabitat (Dohet Citation2002; Wright et al. Citation2013). Thus, by sampling adult EPT with ultraviolet lights, our goal was to test river continuity using a novel technique.
Materials and methods
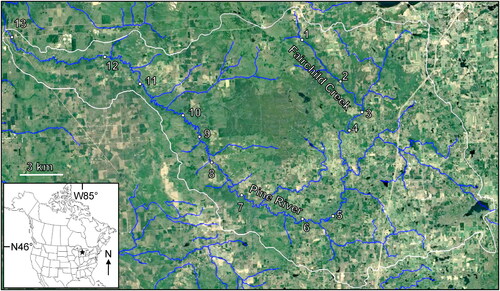
Sampling occurred at 13 sites along a ∼100 km reach of the Pine River, a designated ‘Wild and Scenic’ river (www.rivers.gov) in northern Lower Michigan (). The headwaters of the Pine, Fairchild Creek, drained a watershed of 22 km2 and had a mean annual discharge of 10 cfs, whereas our most downstream site drained almost 700 km2 and discharged 320 cfs (Hill et al. Citation2016). All of our study sites had >90% intact riparian canopy cover (Hill et al. Citation2016) and there were no dams along the entire tested continuum. The curved shape of the river and easy road access made sampling 13 sites in a single night logistically feasible. Below our most downstream site, the Pine River joined a reservoir of the Manistee River; thus, to avoid the confounding effects of a dam we did not sample any further downstream.
Figure 1. Location of the 13 sampling sites along the continuum of the Pine River. Sampling site numbers correspond to and . White line approximates the border of the Pine River watershed. Base map © Google, TerraMetrics.
Samples were collected from each of the 13 sites on 08, 11, 14, and 19 July, 2020, the peak flight period for aquatic insects of the region (Houghton Citation2018). Our objective was a time interval sufficient enough to maintain sample independence, while also avoiding changes in adult assemblages due to emergence phenology which would have resulted from samples with a greater time interval between them. Due to light failure, inadvertently spilling a sample, or other logistical issues, some sites had a sample size of 3 instead of 4 (). Specimens were sampled starting at dusk for 2 h using 28 × 19 cm white plastic pans (Wright et al. Citation2013; Brakel et al. Citation2015). Each pan was filled with 80% ethanol and an 8-watt ultraviolet light was placed diagonally across the top as an attractant. Samples were only collected if daytime temperature exceeded 25° C, dusk temperature exceeded 18° C, and there was no perceivable precipitation or wind at dusk (Houghton Citation2004). Since aquatic insects collected with an ultraviolet light trap placed within 40 m of a habitat accurately reflect the assemblage of that habitat (Sode and Wiberg-Larson Citation1993; Petersen et al. Citation1999; Sommerhäuser et al. Citation1999; Brakel et al. Citation2015; Pereira et al. Citation2021), and our sampling sites were separated by 2–10 km each, dispersal of adults between sites, while certainly possible, was considered unimportant.
Table 1. Each site’s position from upstream (1) to downstream (13), GPS coordinates, and the number of samples collected at that site. Site numbers are in .
Due to the large number collected, specimens were subsampled by dividing the 28 × 19 cm pans into 12 equal sections and counting specimens from four of the sections after a random mixing of the entire sample. Selected specimens were identified to the genus level using Burian (Citation2019), DeWalt and Kondratieff (Citation2019), or Houghton (Citation2012). Species-level identification was not possible, since morphological characteristics necessary for species-level identification were not present on females of some species, as well as many subimago mayflies. Specimens were coded with their affinity for 1 of 5 different FFGs based on Merritt et al. (Citation2019): filtering collectors, gathering collectors, predators, scrapers, and shredders. Due to their consistently low biomass, algal piercers were not included in analyses. Codes consisted of ′0′ for no affinity for an FFG, ′1′ for low affinity, ′2′ for moderate affinity, ′3′ for high affinity, and ′4′ for near exclusive affinity (Chevenet et al. Citation1994). These codes were converted to proportions: 0 = 0.0, 1 = 0.25, 2 = 0.50, 3 = 0.75, and 4 = 1.0, to multiply by the determined biomass for each genus (Beauchard et al. Citation2017). This approach more accurately reflected the feeding plasticity of aquatic insects than pure categorization, and also lessened the need for species-level identification (Dolédec et al. Citation2000; Gayraud et al. Citation2003; Tomanova et al. Citation2007).
Ash-free dry mass (AFDM) values for each genus were taken from Houghton’s (Citation2021a) determination for EPT genera of northern Michigan. The handful of genera without a determined value were assigned the value of a genus of similar size. While this approach did not reflect interspecific differences in body size, nor any differences due to sex, specific habitat, larval food quality, or emergence timing (Svensson Citation1975, Wagner Citation2002, Wagner Citation2005), it still allowed for a more precise determination of FFG differences between sites than simply counting specimens, while also preserving vouchers. All specimens are deposited in the Hillsdale College Insect Collection (HCIC).
Forty-two candidate variables associated with each sampling site were examined for their ability to predict changes in EPT FFG biomass. Variables were determined at four different spatial scales: the specific sampling site, the 100 m riparian mask surrounding the stream within its local (HUC-12) catchment, the entire local catchment, and the entire upstream watershed. Because we did not want to assume a priori that all downstream changes to EPT FFG biomass were caused exclusively by changes in river size, we also tested several variables not directly related to RCC predictions to determine their relative importance.
Elevation (1) was determined using Google Earth Pro (GE). Stream width (2) was estimated at each sampling site using the ruler function in GE. Stream length (3) was, likewise, estimated in GE by measuring the entire stream length from first discernable channel to the sampling site. Strahler order (4) (Strahler Citation1957), mean summer stream temperature (5), stream discharge (6), and total watershed area (7) were determined using the USEPA NHDPlus and StreamCat databases (Hill et al. Citation2016) (watersgeo.epa.gov/watershedreport), accessed throughout January-April 2021. Base flow as a percentage of total stream flow (8, 9, 10), the percentage of organic matter in the surrounding soil (11, 12, 13), soil permeability (14, 15, 16), mean distance to bedrock (17, 18, 19), mean distance to water table (20, 21, 22), total runoff value (23, 24, 25), percent impervious surface (26, 27, 28), mean water volume stored in impoundments divided by total land surface area (29, 30), percent land cover as native forest, wetland, or grassland (31, 32, 33), percent non-native plants (34, 35, 36), density of roads (37, 38, 39), and population density of people (40, 41, 42) were also determined using the USEPA StreamCat database. All variables were at the riparian, catchment, and watershed scale, except for impoundment storage, which was not available at the riparian scale.
Differences in FFG biomass between sites were examined with a non-metric multidimensional scaling (NMDS) ordination using the program PC-ORD v. 7 for Windows (Peck Citation2016). NMDS was chosen for its ability to ordinate mixed data types, including null values (Legendre and Legendre Citation2012). The primary data matrix consisted of the mean AFDM values for each FFG at each site. This value was determined by multiplying the number of specimens of each genus trapped in each of the 3–4 samples per site by the genus’ FFG affinity proportions and by its determined or assigned AFDM value. The mean biomass for each FFG per site was then determined from these values. The secondary data matrix consisted of values of the 42 candidate predictor variables per site. All percentage data were logit transformed before analysis (Warton and Hui Citation2011). The NMDS ordination was conducted using the default program settings, 250 randomized runs, and a Bray-Curtis distance measure. A Monte Carlo test was conducted on each determined axis to assess its difference from a random ordination structure (Dexter et al. Citation2018). Coefficients of determination (r2) for the relationships between ordination distances and the original n-dimensional space distance were also determined in PC-ORD using a Bray-Curtis distance measure (Peck Citation2016). This analysis calculated the percentage of variance explained by each determined NMDS axis in the calculated distance matrix. Second degree polynomial regression models of AFDM values for each FFG individually (dependent variable) were assessed based on values of determined significant NMDS axes (independent variable).
Results
Forty-seven samples were analyzed (), consisting of 77,908 specimens from nine Ephemeroptera genera, five Plecoptera genera, and 36 Trichoptera genera (). Trichoptera dominated all sampling sites and constituted nearly 87% of the overall biomass. The genera with greatest total biomass were Lepidostoma (Trichoptera: Lepidostomatidae) (11943 mg), Ceraclea (Trichoptera: Leptoceridae) (6052), Hydropsyche (Trichoptera: Hydropsychidae) (4169), Leptocerus (Leptoceridae) (2351), and Brachycentrus (1156). Collectively, those five genera represented almost 72% of the total assemblage biomass.
Table 2. Mean specimen abundance values for each of the 50 EPT taxa caught in this study, rounded to the nearest whole number. Site numbers correspond to and .
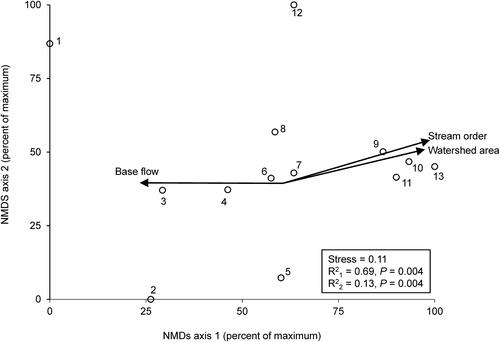
The NMDS ordination of mean FFG AFDM for all 13 sampling sites produced two significant axes, with 84% of the variance in the data explained by axis 1 and 4% explained by axis 2 (). The variables with the strongest (r2 >0.50) correspondences to axis 1 were stream order (variable 4), watershed area (7), base flow as a percentage of total stream flow at the watershed level (10), discharge (6), width (2), and mean summer temperature (5). The percentage of non-native plants at the catchment level (35) was the only variable that had a strong (r2 >0.50) correspondence with axis 2.
Figure 2. NMDS ordination of the 13 sampling sites based on mean EPT FFG biomass per site. P-values from a Monte Carlo test of non-random ordination structure. Arrow lengths denote strength of correspondence of FFG biomass with axis 1 values, only r2 > 0.50 shown. N = 3–4 per site ().
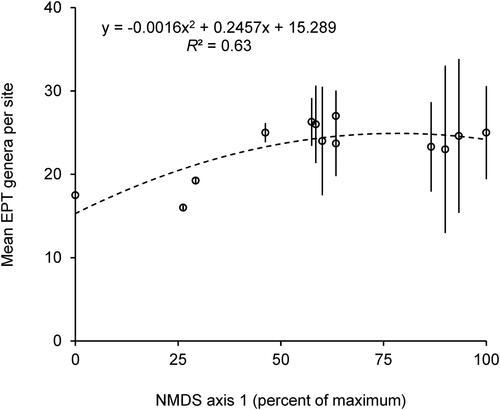
The mean biomass per site increased along axis 1 for all FFGs (), except for scrapers which decreased at the most downstream sites. Number of EPT genera collected also increased along axis 1 (). Similar graphs were not constructed for axis 2 due to its weak explanatory power.
Figure 3. Second degree polynomial regression models of mean (±SE) AFDM (dependent variable) based on axis 1 scores from (independent variable) for filtering collectors (A), gathering collectors (B), predators (C), scrapers (D), shredders (E). Summary equations and R2 values in separate box. Each marker represents the mean (±SE) of 1 of the 13 sampled sites. N = 3–4 per site.
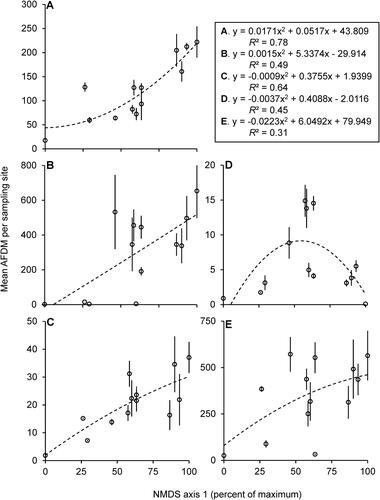
Figure 4. Second degree polynomial regression model of mean (±SE) number of EPT genera caught (dependent variable) based on axis 1 scores from (independent variable) for the 13 sampling sites, with summary equation and R2 values. Each marker represents the mean (±SE) of 1 of the 13 sampled sites. N = 3–4 per site.
Discussion
Our results generally supported the tenets of the RCC. Specifically, increasing river size was the most important predictor of changes in EPT FFG biomass and genus richness. Most of our specific variables predicting changes in FFG biomass, such as increasing watershed area and discharge, were direct measures of increasing river size. Others, such as increasing temperature and decreasing importance of base flow, typically correlate with increasing river size in temperate forested ecosystems (Allan Citation2004; Houghton Citation2021b). Many previous studies have similarly demonstrated a correspondence between river size and changes in FFGs (Vannote et al. Citation1980; Grubaugh Citation1996; Tomanova et al. Citation2007; Rosi-Marshall et al. Citation2016; Curtis et al. Citation2018; Doretto et al. Citation2020). Most of these studies, however, have tested a limited number of variables, thereby maintaining the possibility that untested variables (e.g., land use) may be of greater importance than river size along the continuum. In our study, the demonstrated low importance of the many environmental variables tested further supported river continuity and the singular importance of river size and its associated variables as important predictors.
Our results also supported some of the predicted changes of specific FFGs along the river continuum (Vannote et al. Citation1980; Doretto et al. Citation2020). Specifically, collectors are predicted to continually increase in relative abundance as rivers widen and suspended seston accumulates. Scrapers (‘grazers’ in some papers) are predicted to increase as rivers widen and sunlight penetration to the water surface increases, but then decrease as rivers further widen due to corresponding increases in depth and turbidity attenuating the available photosynthetic light. Overall taxonomic richness is likewise predicted to increase into the middle stream orders, probably reflecting the transition from net stream heterotrophy to net autotrophy, before decreasing again in higher orders as streams revert back to net heterotrophy (Vannote et al. Citation1980; Tomanova et al. Citation2007). Since our results encompassed only up to a 4th order river, we observed a binomial response from scrapers, but did not sample a large enough river to observe one for genus richness.
Some of our results and subsequent interpretations differed from previous studies of the RCC. Because the original RCC (Vannote et al. Citation1980) and most later studies (see Doretto et al. Citation2020) tested changes in relative specimen abundance or biomass, it has previously not been possible to discern whether the determined decreases of some FFGs, such as shredders, represented actual decreases or were merely smaller increases relative to those of other FFGs. Our results demonstrated the latter scenario, as all FFGs increased along the continuum of the Pine River. Houghton (Citation2021a) found similar results in both a disturbed and an undisturbed river of northern Michigan, ∼300 km north of the Pine River. For all three rivers, the larger increase of collectors relative to that of shredders (; Houghton 2021a) could be interpreted as decreasing relative abundance of shredders with increasing river size, even though shredders actually increased. Since our study ended at a 4th order river, it was not clear if this increase in shredders continued further along the continuum.
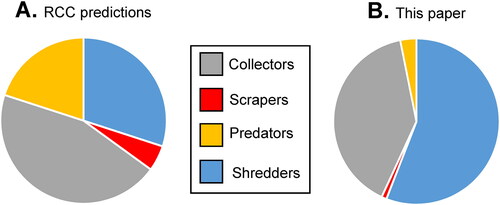
Our results further differed from previous studies due to our utilizing adult biomass values instead of that of benthic larvae. approximates the predicted percentages of collectors (combination of gathering collectors and filtering collectors), scrapers, predators, and shredders in 1st to 4th order streams based on a simple visual estimation of the original RCC graph (Vannote et al. Citation1980). This result was based on the relative biomass of benthic specimens. When constraining our data to the relative biomass of adult FFGs (), shredders more than doubled in importance relative to RCC predictions, and represented nearly 2/3 of the total assemblage. The only other studies of changes in aquatic insect biomass along a river continuum (Houghton and Lardner Citation2020; Houghton Citation2021a) have found similar results, suggesting that the importance of shredders in temperate woodland streams has been underestimated in previous assessments of the RCC.
Figure 5. Approximate relative biomass of each FFG as predicted by Vannote et al. (Citation1980) for 1st–4th order streams (A), compared to the data in our study when expressed as relative determined biomass (B).
This disparity regarding shredders was probably due to the difficulty of sampling their benthic stage. As mentioned early, many common benthic sampling techniques are biased towards shallow habitats of uniform substrate, which are typical habitats for collectors and scrapers, but not shredders (Cao and Hawkins Citation2011). Conversely, sampling the adult EPT specimens which have left the natal habitat mitigates such bias. Moreover, since shredders are some of the largest aquatic insects (Houghton Citation2021a), any differences in the number of specimens caught will have a noticeable influence on the overall biomass values of the assemblage.
Due to its limited sampling period, it is likely that our study also underestimated the importance of shredders, as well as that of scrapers, in the Pine River. Within northern forested streams, the mid-July sampling period typically captures the greatest biomass and taxonomic richness (Houghton Citation2018). EPT species of these environments, however, emerge from late April until early October — and a few species of Plecoptera emerge during winter and early spring. The September emergence, in particular, contains additional species, particularly within the shredder genera Lepidostoma, Limnephilus and Pycnopsyche, and within the scraper genus Neophylax (Trichoptera: Thremmatidae). In streams of Minnesota and Michigan, for example, the biomass of Pycnopsyche species alone can approximate that of all July-emergent shredders combined, while the biomass of Neophylax species can approximate that of all combined scrapers (Houghton Citation2012; Houghton Citation2021a). The former observation suggests even further the importance and chronic underestimation of shredders in temperate forested streams, while the latter may explain how our determined relative importance of scrapers in the Pine River () was less than that predicted by the RCC.
Other limitations of this study related to the inherent difficulties of field sampling. Our sampling was limited to a relatively short (100 km) continuum of a single river, and only included 2nd–4th orders reaches. A thorough testing of the RCC should also include high-order reaches. Unfortunately, undisturbed and undammed large rivers are difficult to find within the northern US and elsewhere, and river disturbance can greatly confound conclusions about the RCC (Houghton and DeWalt Citation2021). In addition, while the efficacy of ultraviolet lights for sampling Trichoptera is well established (Houghton et al. Citation2011; Wright et al. Citation2013; Brakel et al. Citation2015; Houghton Citation2018), such efficacy is less clear for Ephemeroptera or Plecoptera (Houghton Citation2021a). Thus, some portion of the July EPT emergence could have been missed due to sampling limitations. Lastly, in order to sample 13 sites in a single evening for an identical time period, multiple field crews were utilized, which could have led to variation in samples due to subtle changes in the behavior of personnel (Cao and Hawkins Citation2011). Fortunately, ultraviolet light trapping is a simple technique that is easy to standardize, thus mitigating such variation.
In summary, adult EPT biomass generally reflected predicted changes in river continuity, although the results also suggested a previous under-estimation of shredders within northern temperate ecosystems and probably elsewhere. Because the biomass of organic carbon contained in aquatic organisms directly reflects watershed conditions (Zuellig and Schmidt Citation2012; Venarsky et al. Citation2020), this greater importance of shredders should probably be incorporated into future refinements of the RCC. Further research will be needed to determine the prevalence and applicability of our observations to other river types and sizes.
Acknowledgments
We thank Julianna Battig, Maxwell Boyle, William Chamberlin, Henrey Deese, Kelly Edsall, Margaret Kearny, Robert Kintz, Faith Linton, Brooklyn Little, Jeremy Luce, Megan Phelps, Kaitlyn Rowland, Emma Shea, Noah Stinnett, Daniel Votel, and Mia Young for assistance in the laboratory and field. Google Earth base maps were used following permission guidelines (https://www.google.com/permissions/geoguidelines/attr-guide/). This is paper #32 of the GH Gordon BioStation Research Series.
Disclosure statement
No potential conflicts of interest were reported by the authors.
Data availability statement
Data are available on the Open Science Framework site: https://osf.io/nqfdh/.
Additional information
Funding
References
- Allan JD. 2004. Landscapes and riverscapes: the influence of land use on stream ecosystems. Annu Rev Ecol Evol Syst. 35(1):257–284.
- Beauchard O, Veríssimo H, Queirós AM, Herman PMJ. 2017. The use of multiple biological traits in marine community ecology and its potential in ecological indicator development. Ecol Indicators. 76:81–96.
- Brakel K, Wassink LR, Houghton DC. 2015. Nocturnal flight periodicity of the caddisflies (Trichoptera) in forest and meadow habitats of a first order Michigan stream. Great Lakes Entomol. 48:33–44.
- Burian SK. 2019. Chapter 13, Ephemeroptera. In: Merritt, RW, Cummins KW, and Berg MB, editors. An introduction to the aquatic insects of North America. 5th ed. Dubuque (IA): Kendall/Hunt.
- Cao Y, Hawkins CP. 2011. The comparability of bioassessments: a review of conceptual and methodological issues. J North American Benthol Society. 30(3):680–701.
- Cao Y, Larsen DP, Hughes RM, Angermeier PL, Patton TM. 2002. Sampling effort affects multivariate comparisons of stream assemblages. J N Am Benthol Soc 21:701–714.
- Chessman B, Williams S, Besley C. 2007. Bioassessment of streams with macroinvertebrates: effect of sampled habitat and taxonomic resolution. J N Am Benthol Soc 26:546–565.
- Chevene F, Doleadec S, Chessel D. 1994. A fuzzy coding approach for the analysis of long-term ecological data. Freshwater Biol. 31(3):295–309.
- Collins SE, Matter SM, Buffam I, Flotemersch JE. 2018. A patchy continuum? Stream processes show varied responses to patch- and continuum-based analyses. Ecosphere. 9(11):e02481.
- Curtis WJ, Gebhard AE, Perkin JS. 2018. The river continuum concept predicts prey assemblage structure for an insectivorous fish along a temperate riverscape. Freshwater Sci. 37(3):618–630.
- DeWalt RE, Kondratieff BC. 2019. Chapter 16, Plecoptera. In: Merritt, RW, Cummins KW, and Berg MB, editors. An introduction to the aquatic insects of North America. 5th ed. Dubuque (IA): Kendall/Hunt.
- Dexter E, Rollwagen-Bollens G, Bollens SM. 2018. The trouble with stress: a flexible method for the evaluation of nonmetric multidimensional scaling. Limnol Oceanogr Method. 16(7):434–443.
- Dohet A. 2002. Are caddisflies an ideal group for the biological assessment of water quality in streams? Proceedings of the 10th International Symposium on Trichoptera – Nova Supplementa Entomologica. Keltern, Germany; p. 507–520.
- Dolédec S, Olivier JM, Statzner B. 2000. Accurate description of the abundance of taxa and their biological traits in stream invertebrate communities: effects of taxonomic and spatial resolution. FAL. 148(1):25–43.
- Doretto A, Piano E, Larson CE. 2020. The river continuum concept: lessons from the past and perspectives for the future. Can J Fish Aquat Sci. 77(11):1853–1864.
- Gayraud S, Statzner B, Bady P, Haybachp A, Scholl F, Usseglio-Polatera P, Bacchi M. 2003. Invertebrate traits for the biomonitoring of large European rivers: an initial assessment of alternative metrics. Freshwater Biol. 48(11):2020–2045.
- Gerth W, Herily AT. 2006. Effect of sampling different habitat types in regional macroinvertebrate bioassessment surveys. J N Am Benthol Soc 25:501–512.
- Grubaugh JW, Wallace JB, Houston ES. 1996. Longitudinal changes of macroinvertebrate communities along an Appalachian stream continuum. Can J Fish Aquat Sci. 53(4):896–909.
- Hill RA, Weber MA, Leibowitz SG, Olsen AR, Thornbrugh DJ. 2016. The Stream Catchment (StreamCat) Dataset: a database of watershed metrics for the conterminous United States. J Am Water Resour Assoc. 52(1):120–128.
- Houghton DC, Albers BA, Fitch WT, Smith EG, Smith MC, Steger EM. 2018. Serial discontinuity in naturally alternating forest and floodplain habitats of a Michigan (USA) stream based on physicochemistry, benthic metabolism, and organismal assemblages. J Freshwater Ecol. 33(1):139–155.
- Houghton DC, Berry EA, Gilchrist A, Thompson J, Nussbaum MA. 2011. Biological changes along the continuum of an agricultural stream: influence of a small terrestrial preserve and use of adult caddisflies in biomonitoring. J Freshwater Ecol. 26(3):381–397.
- Houghton DC, DeWalt RE. 2021. If a tree falls in the forest: terrestrial habitat loss predicts caddisfly (Insecta: Trichoptera) assemblages and functional feeding group biomass throughout rivers of the North-central United States. Landscape Ecol. 36(10):3018–3061.
- Houghton DC, Lardner R. 2020. Ash-free dry mass values for northcentral USA caddisflies (Insecta, Trichoptera). ZooKeys. 951:37–46.
- Houghton DC. 2004. Biodiversity of Minnesota caddisflies (Insecta: Trichoptera): delineation and characterization of regions. Environ Monit Assess. 95(1–3):153–181.
- Houghton DC. 2012. Biological diversity of Minnesota caddisflies. ZK. 189:1–389.
- Houghton DC. 2018. When to sample adult caddisflies: data from a five-year study of a first-order Michigan (USA) stream. Journal of Freshwater Ecology. 33(1):211–221.
- Houghton DC. 2021a. A tale of two habitats: whole-watershed comparison of disturbed and undisturbed river systems in northern Michigan (USA), based on adult Ephemeroptera, Plecoptera, and Trichoptera assemblages and functional feeding group biomass. Hydrobiologia. 848(15):3429–3446.
- Houghton DC. 2021b. Assessment of stream conditions and anthropogenic disturbance of the northcentral United States. J Freshwater Ecol. 36(1):1–12.
- Kitchin PL. 2005. Measuring the amount of statistical information in the EPT index. Environmetrics. 16(1):51–59.
- Larsen S, Bruno MC, Vaughan IP, Zolezzi G. 2019. Testing the River Continuum Concept with geostatistical stream-network models. Ecological Complexity. 39:100773.
- Legendre P, Legendre L. 2012. Ordination in reduced space. In: Legendre P, Legendre L, editors. Numerical Ecology. 3rd edition. Amsterdam (NL): Elsevier; p. 425–520.
- Maasri A, Thorp JH, Kotlinski N, Kiesel J, Erdenee B, Jähnig SC. 2021. Variation in macroinvertebrate community structure of functional process zones along the river continuum: New elements for the interpretation of the river ecosystem synthesis. River Res Applic. 37(4):665–674.
- Masese FO, Raburu PO. 2017. Improving the performance of the EPT index to accommodate multiple stressors in Afrotropical streams. African J Aquatic Sci. 42(3):219–233.
- Merritt RW, Cummins KW, Berg MB. 2019. An introduction to the aquatic insects of North America. 5th ed. Dubuque (IA): Kendall/Hunt.
- Peck J. 2016. Multivariate analysis for ecologists. Step-by-step. MJM Software, Gleneden Beach, Oregon; p. 192.
- Pereira R, Rodrigues GG, Calor AR, Vasconcelos SD. 2021. Field assessment of the efficiency of two sampling techniques for adult caddisflies (Insecta: Trichoptera). Int J Trop Insect Sci. 41(1):903–908.
- Petersen I, Winterbottom JH, Orton S, Friberg N, Hildrew AG, Spiers DC, Gurney† WSC. 1999. Emergence and lateral dispersal of adult Plecoptera and Trichoptera from Broadstone Stream, U.K. Freshwater Biol. 42(3):401–416.
- Pollice A, Jona-Lasinio G, Gaglio M, Blanchet FG, Fano EA. 2020. Modelling the effect of directional spatial ecological processes for a river network in Northern Italy. Ecol Indicators. 112:106144.
- Rosi-Marshall EJ, Vallis KL, Baxter CV, Davis JM. 2016. Retesting a prediction of the river continuum concept: atochthonous versus allochthonous resources in the diets of invertebrates. Freshwater Sci. 35(2):534–543.
- Sode A, Wiberg-Larsen P. 1993. Dispersal of adult Trichoptera at a Danish forest brook. Freshwater Biol. 30(3):439–446.
- Sommerhäuser M, Koch P, Robert B, Schumacher H. 1999. Caddisflies as indicators for the classification of riparian systems along lowland streams. In Malicky H, Chantaramongkol, editors. Proceedings of the 9th International Symposium on Trichoptera; Jan 5–10 1998; Chiang Mai: Faculty of Science, Chiang Mai University; p. 337–348.
- Strahler AN. 1957. Quantitative analysis of watershed geomorphology. Trans AGU. 38(6):913–920.
- South EJ, DeWalt RE, Cao Y. 2018. Relative importance of Conservation Reserve Programs to aquatic insect biodiversity in an agricultural watershed in the Midwest, USA. Hydrobiologia 829:323–340.
- Svensson BW. 1975. Morphometric variation of adult Potamophylax cingulatus (Trichoptera) reflecting environmental heterogeneity in a south Swedish stream. Oikos. 26(3):365–377.
- Thorp JH, Thoms MC, Delong MD. 2006. The riverine ecosystem synthesis: biocomplexity in river networks across space and time. River Res Applic. 22(2):123–147.
- Tomanova S, Tedesco PA, Campero M, Van Damme PA, Moya N, Oberdorff T. 2007. Longitudinal and altitudinal changes of macroinvertebrate functional feeding groups in neotropical streams: a test of the river continuum concept. FAL. 170(3):233–241.
- Vannote RL, Minshall GW, Cummins KW, Sedell JR, Cushing CE. 1980. The river continuum concept. Can J Fish Aquat Sci. 37(1):130–137.
- Venarsky MP, Stewart-Koster B, Hunt RJ, Jardine TD, Bunn SE. 2020. Spatial and temporal variation of fish community biomass and energy flow throughout a tropical river network. Freshwater Biology 65: 1781–1792.
- Wagner R. 2002. The influence of temperature and food on size and weight of adult Chaetopteryx vilosa (Fabricius) (Insecta: Trichoptera). FAL. 154(3):393–411.
- Wagner R. 2005. The influence of stream water temperature on size and weight of caddisflies (Insecta, Trichoptera) along the Breitenbach 1983–1991. archiv_hydrobiologie. 163(1):65–79.
- Warton DI, Hui FKC. 2011. The arcsine is asinine: the analysis of proportions in ecology. Ecology. 92(1):3–10.
- Wright DR, Jr., Pytel AJ, Houghton DC. 2013. Nocturnal flight periodicity of the caddisflies (Insecta: Trichoptera) in a large Michigan river. J Freshwater Ecol. 28(4):463–476.
- Zuellig RE, Schmidt TS. 2012. Characterizing invertebrate traits in wadeable streams of the contiguous US: differences among ecoregions and land uses. Freshwater Sci. 31(4):1042–1056.