
 ?Mathematical formulae have been encoded as MathML and are displayed in this HTML version using MathJax in order to improve their display. Uncheck the box to turn MathJax off. This feature requires Javascript. Click on a formula to zoom.
Abstract
For sustainable conservation and management of wetlands, it is essential to quantify the evolution progress and driving mechanisms of wetlands. This study examined Baiyangdian Wetland as a research area, and remote images and statistical yearbooks were used as data sources. Dominant zones of wetland were defined based on spatial characteristics of land cover frequency. A transfer matrix and random forest were used to analyze the evolution process and driving mechanism of typical wetlands in the North China Plain. Based on the results, following conclusions were arrived: (1) There was significant spatial differentiation of land cover frequency characteristics in the Baiyangdian wetland, with the cultivated land-dominated zone, the aquatic vegetation-dominated zone, and the water body-dominated zone being the three core zones of wetland ecosystem evolution. (2) There was a frequent and significant change of the Baiyangdian wetland due to extreme climatic conditions. Between 1987 and 2017, the built-up land area and the water body area increased by 4.62 and 16.17 km2, respectively, while the aquatic vegetation area decreased by 20.70 km2. A combination of natural and human factors caused changes in the wetland’s structure. (3) The driving mechanisms of ecosystem evolution in the Baiyangdian wetland were influenced significantly by space, time, and land cover types. Specifically, on a spatial scale, social factors were the predominant factors contributing to changes in water body and cultivated land in the cultivated land-dominant zone and the aquatic vegetation-dominant zone. In contrast, natural factors were the dominant factors leading to changes in aquatic vegetation. There was a greater contribution from social factors to the driving mechanism of changes in the water body, aquatic vegetation, and cultivated land in the water body-dominant zone than from natural factors. On a temporal scale, it was primarily influenced by natural factors in the early stages and socio-economic factors in the late stages, with the year 2002 serving as a turning point. The scale of land cover types can be seen primarily in the differences among the agricultural lands, aquatic vegetation, and water body. In particular, the Secondary Industry Out Value (SIOV) was highly sensitive to changes in the cultivated area. In addition, cumulative evaporation (EC) has been identified as the main factor responsible for the evolution of aquatic vegetation, which is closely related to the changes in water body.
1. Introduction
Wetlands are called the "kidneys of the earth" and serve important ecological functions. For centuries, wetlands have been fragmented due to human activities and global climate change (Yuan et al. Citation2015; Bedford Citation1996). Especially for the North China Plain, as one of China’s grain production areas, wetland resources have been overdeveloped. Due to land reclamation, illegal occupation, and sand mining, several wetlands have been converted into drylands, paddy fields, and aquaculture ponds (Liu et al. Citation2006). As a result, wetlands have been seriously degraded, and their area has been substantially reduced (Lu et al. Citation2000).
To protect and utilise wetland resources effectively, it is crucial to understand the long-term evolution process, rules, and driving mechanisms of wetland ecosystems. The most intuitive reflection of wetland evolution processes is land use and land cover change (LUCC) (Halls and Magolan Citation2019; Hou et al. Citation2020). Both natural and human factors contribute to the LUCC in wetlands (Wu et al. Citation2022; Hu et al. Citation2012). Climate, hydrology, topography, and biodiversity are among the natural factors that affect the evolution of land cover, particularly on a large scale (Zhou et al. Citation2008; Gong et al. Citation2013; Cui et al. Citation2013). It is important to note that natural factors mainly contribute to the basement change, and a long-term gradual process is required for this change (Gong et al. Citation2013). Meanwhile, the economy, science and technology, culture, and policy are human factors that have a greater impact on small areas, resulting in rapid changes in the landscape (Zhou et al. Citation2008; Zhang et al. Citation2021; Zhao et al. Citation2021a). However, studying driving forces across a wide area may obscure spatial differences due to hydrology, vegetation succession, and human intervention in smaller areas in smaller regions (Zhao et al. Citation2023). For instance, Sica et al. discovered significant differences in the driving mechanisms of landscape patterns among five landscape units in the Parana River delta in Argentina, based on land cover types and spatial locations (Sica et al. Citation2016).
Land cover frequency is an expression parameter of wetland ecological characteristics using long-time series of remote sensing data. Besides reflecting the duration and frequency of land cover changes, it also reflects the continuous, small-scale, regular changes and regional differences of various land cover types in the wetland (Deng et al. Citation2013). According to the inundation frequency of water body, Gu et al. divided Poyang Lake into four regions: a low inundation frequency region, a medium inundation frequency region, and a high inundation frequency region. They examined the differences in vegetation distributions between the four regions (Gu et al. Citation2018). Gao et al. believed that hydrological characteristics and vegetation succession were the primary factors driving the evolution of wetlands. As a result of the relationship between the inundation frequency of water body and the cover frequency of vegetation, the Baiyangdian wetland has been divided into eight functional regions, and the landscape characteristics of these regions have been compared and analyzed (Gao Citation2020). Describing the fragile and volatile characteristics of wetlands by land cover frequency parameters has now become a new direction, which is of great significance to help understand the evolution process and driving mechanism of wetland ecosystems in different sub-regions.
As the only large freshwater lake in the North China Plain, Baiyangdian Lake provides water resources, controls floods, and regulates regional climate (Zhao et al. Citation2021b). Presently, most studies on evolution process in Baiyangdian wetlands focus on traditional analyses of land use areas or a combination of landscape ecology (Liu et al. Citation2006; Zhao et al. Citation2021a). Several scholars have also examined the dynamic evolution rule of water body (Zhao et al. Citation2021b). There is, however, a lack of clarity regarding the response relations and regional differences of different land cover frequencies, in addition to their impact on the evolution rule and driving mechanism of wetland ecosystems. Thus, with Baiyangdian wetland, a typical inland wetland in the North China Plain, as the research object, this study focuses on long-term wetland land cover frequency and the driving mechanisms of wetland evolution in different land cover type-dominant zones. The primary objectives of this study are (1) To analyze the response relationship and distribution characteristics of different land cover frequencies of the Baiyangdian wetland; (2) To determine the rule of gradual change of wetland land use types following high-frequency land cover types; (3) To evaluate the differences in driving mechanisms among the different dominant zones.
2. Study area
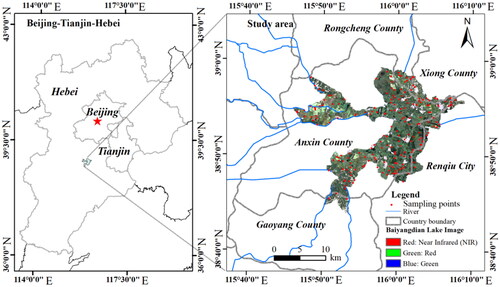
Baiyangdian is the largest natural lake in the North China Plain. It is located in the middle reaches of the Daqing River system in the Haihe River Basin. The lake was formed by converging water on the fan-edge depression at the confluence of the Yongding River and the alluvial fan of the Hutuo River in front of the Taihang Mountains. The location of the area is in Anxin County, Baoding City, Hebei Province. It is surrounded by dykes and is geographically situated at 115°45′ E-116°07′ E, 38°43′ N-39°02′ N (). The region belongs to the warm-temperate semi-arid region in the eastern monsoon zone, with significant continental climate characteristics. The average annual temperature ranges from 7.3 to 12.7 °C, with a large annual difference in temperature (Li et al. Citation2022). The average annual precipitation is 563.9 mm, with the precipitation mainly concentrating in June-September. The average annual evapotranspiration is 1369 mm (Hu et al. Citation2012).
Figure 1. Location of the study area.
3. Materials and methods
3.1. Data sources
The remote sensing data used in this study were from the Landsat 5 Thematic Mapper (TM) and Landsat 8 operational land imager (OLI) of the United States Geological Survey (USGS, https://earthexplorer.usgs.gov/). We selected 10 Landsat images covering 30 years from 1987 to 2017. The images were acquired on September 10, 1987, September 7, 1989, August 10, 1992, September 11, 1995, August 14, 1999, September 16, 2002, September 27, 2005, September 22, 2009, September 1, 2013, and September 28, 2017. Nature factors data were obtained from the National Meteorological Centre of the China Meteorological Administration (http://data.cma.cn/data/), including the Maximum land surface temperature (Max_LST), precipitation capacity (PC), evaporation capacity (EC), land surface temperature (LST), relative humidity (RH), and temperature (T) at Baoding Station from 1987 to 2017. Social factors data were obtained from the Hebei and Baoding Economic Statistical Yearbooks, including Anxin County’s gross domestic product (GDP), primary industry output value (PIOV), Secondary industry out value (SIOV), tertiary industry output value (TIOV), population (Pop), rural labor force (RLF), rural electricity consumption (REC), fishery output value (FOV), and aquatic product output (AP) from 1987 to 2017.
3.2. Research procedures
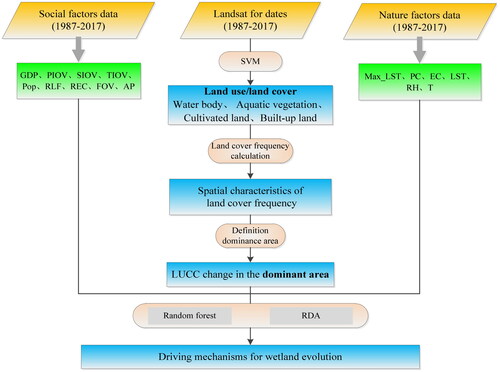
This study was conducted in four sections, as illustrated by the flow chart in . In the first step, the support vector machine was employed to classify 30 remote sensing images from 1987 to 2017. In the second step, land cover frequency was calculated for obtaining the frequency characteristic of cultivated land, aquatic vegetation, water body and built-up land in each pixel. In the third step, different dominant zones were defined and LUCC change in the dominant zones were analyzed. Lastly, 15 factors were taken into account, using the random forest method and redundancy analysis (RDA), in order to quantitatively analyze the factors driving of LUCC change in Baiyangdian wetlands.
Figure 2. Technical flow chart.
3.3. Extraction of wetland information
Support vector machine (SVM) is a new machine learning algorithm based on statistical learning theory, featuring a strong learning capability based on small samples, strong anti-noise performance, high learning efficiency, and good generalization (Liu et al. Citation2013). This technology has been successfully applied to the extraction of land cover information (Liu et al. Citation2006; Sun Citation2011; Ghayour et al. Citation2021). In this study, SVM was utilized to classify 30 remote sensing images from 1987 to 2017. The extraction results were revised in light of the actual situation of a field investigation and the use of Google Earth. The survey was conducted in September 2017 with 200 sample points (). High precision GPS was used to sample different land cover types, and the sample points were evenly distributed in the whole study area. According to the Current Land Use Classification (GB/T 21010-2017) and field investigations, the Baiyangdian wetland can be divided into four categories: water body, aquatic vegetation, cultivated land, and built-up land.
3.4. Land cover frequency calculation
The spatial superposition operation was performed according to the classification results of serial remote sensing images for obtaining the frequency characteristic of cultivated land, aquatic vegetation, water body and built-up land in each pixel. The higher the land cover frequency is, the more times a certain type of ground object type appears in the pixel points and the stronger the dominance of ground object type in the pixel point. The frequency calculation is provided in EquationEquations 1(1)
(1) and Equation2
(2)
(2) :
(1)
(1)
(2)
(2)
refers to cover frequency of class i.
refers to the wetland information image of class i at time t. t refers to the number of images.
3.5. LUCC change analysis
It is possible to observe the general trend of land cover change and its structural characteristics by analyzing the LUCC. Since hydrological conditions play a significant role in determining the evolution of wetlands, the four major periods over the past 30 years (with 1987 as its first year, 1989 as its year of extreme precipitation, 2002 as its year of extreme drought, and 2017 as its last year) were selected and transition matrices were calculated for the analysis of the LUCC change in the Baiyangdian wetland.
3.6. Driving factors of LUCC change
Wetland evolution of LUCC is influenced by both the natural environment and human activities in most cases. The factors contributing to the change in land cover are diverse and complex, interconnected, and interact with each other, with different dominant factors in different times and regions. In order to quantitatively analyze the factors driving of LUCC change in Baiyangdian wetlands, 15 factors were taken into account, including 6 natural factors and 9 social factors, using the random forest method. In the random forest analysis, only the top 10 contribution factors were selected to reduce the impact of noise factors.
4. Results
4.1. Spatial characteristics of land cover frequency in the Baiyangdian wetland
illustrates the spatial characteristics of land cover frequency in Baiyangdian. As described by the frequency distributions of cultivated land, the frequency distributions of cultivated land were generally characterized by "low in the middle and high in the surroundings" and "large-area lumpy". According to the frequency distribution of aquatic vegetation, aquatic vegetation is the land cover type with the greatest distribution in the Baiyangdian wetland. Furthermore, the distribution and changes were relatively stable. Based on the distribution of water inundation frequency, the Baiyangdian wetland’s water bodies have undergone significant changes, and the majority of water bodies have changed frequently, generally exhibiting spatial characteristics such as "high in the middle and low in the surroundings". Furthermore, it was found that the built-up distribution frequency generally exhibited dotted and scattered characteristics, with a high frequency in central villages and a low frequency in the surrounding areas ().
Figure 3. Spatial characteristics of land cover frequency in the Baiyangdian wetland.
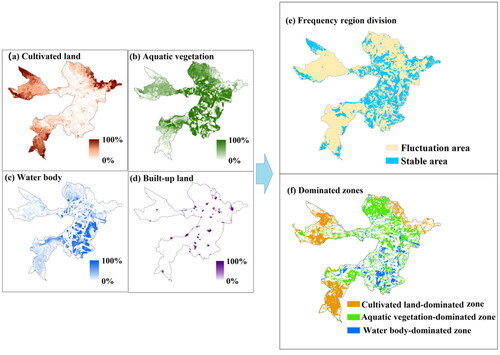
Ecological zoning was carried out based on the spatial characteristics of the land cover frequency characteristics. As a first step, the stable and fluctuation areas were defined. A zone with a land cover frequency of over 80% belonged to the stable zone, accounting for 30.3% of the entire study region. In cases where the land cover frequency was less than 80%, it indicated the zone in which the cover frequency of cultivated land, aquatic vegetation, water body, and built-up land fluctuated, constituting the zone of fluctuating land cover types, covering 69.7% of the study area (). Based on the change in cover frequency within the fluctuation area of the Baiyangdian wetland, the zones with a cover frequency of 60 to 80% were defined as the dominated zones, comprising the cultivated land-dominant zone, aquatic vegetation-dominant zone and water body-dominant zone (as the built-up land exhibits almost no fluctuation, it is not considered a dominant zone of fluctuation). The cultivated land-dominated zone was mainly distributed in the study region’s small areas with higher terrain in the south, west, northeast, and middle regions. There were mainly submerged and floating plants in the aquatic vegetation-dominant zone, presenting a certain value of appreciation. The water body-dominant zone was mostly located in the middle of the Baiyangdian study region, where wetlands consistently submerged water body throughout the year ().
4.2. Analysis of LUCC change in the dominant zones
The LUCC change analysis results for different periods are illustrated by . Based on the LUCC change analysis in the cultivated land-dominant zone, the land cover that did not change from 1987 to 1989 were primarily aquatic vegetation (14.15 km2) and cultivated land (9.77 km2). Land cover types that changed were mainly cultivated land, of which 43.07 km2 were converted to water body and 13.13 km2 into vegetation. The main land cover types that did not change from 1989 to 2002 were cultivated land (5.60 km2) and aquatic vegetation (2.34 km2), where the most obvious changes occurred primarily in water body and aquatic vegetation, transferring 43.26 km2 of water body and 29.14 km2 of aquatic vegetation to cultivated land. From 2002 to 2017, cultivated land was the only land type not transformed (60.76 km2). In contrast, the obvious changes in land cover types were primarily observed on cultivated land, and aquatic vegetation, in which 9.48 km2 of cultivated land was transformed into aquatic vegetation, 5.56 km2 of cultivated land was transformed into buildings, and 6.59 km2 of aquatic vegetation was converted into cultivated land.
Figure 4. The LUCC change analysis results for different periods in the dominated zones.
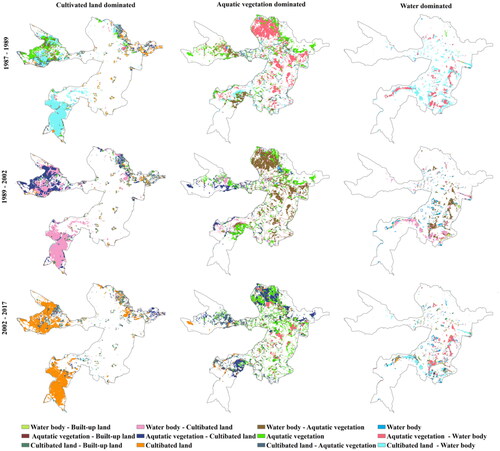
Based on the LUCC change analysis in the aquatic vegetation-dominant zone, the types of land cover that did not change from 1987 to 1989 were primarily aquatic vegetation (22.90 km2). Land cover types that changed were mainly aquatic vegetation, cultivated land and water body, in which 41.84 km2 of aquatic vegetation was transformed into water body, 11.76 km2 of cultivated land was transformed into water body, 7.04 km2 of cultivated land was transformed into aquatic vegetation, and 10.59 km2 of water body was converted into aquatic vegetation. The main land cover types that did not change from 1989 to 2002 were aquatic vegetation (25.49 km2), where the most obvious changes occurred primarily in water body and aquatic vegetation, in which 42.48 km2 of water body was converted into aquatic vegetation, 10.65 km2 of water body was converted into cultivated land, and 13.90 km2 of aquatic vegetation was converted into cultivated land. From 2002 to 2017, aquatic vegetation (31.53 km2) and cultivated land (4.70 km2) were the land cover type not transformed. In contrast, the obvious changes in land cover types were primarily observed on aquatic vegetation, and cultivated land, in which 22.92 km2 of aquatic vegetation was transformed into cultivated land, 10.81 km2 of aquatic vegetation was transformed into water body, and 17.09 km2 of cultivated land was converted into aquatic vegetation.
Based on the LUCC change analysis in the water body-dominant zone, the types of land cover that did not change from 1987 to 1989 were inconspicuous. Land cover types that changed were mainly cultivated land and aquatic vegetation, in which 20.42 km2 of cultivated land and 11.28 km2 of aquatic vegetation were converted to water body. The main land cover types that did not change from 1989 to 2002 were water body (7.00 km2), in which 12.45 km2 of water body were converted to aquatic vegetation, and 11.93 km2 of water body were converted to cultivated land. From 2002 to 2017, water body was the only land type not transformed (4.39 km2). The obvious changes in land cover types were primarily observed on cultivated land, and aquatic vegetation, in which 8.33 km2 of cultivated land was transformed in water body, 10.46 km2 of aquatic vegetation was transformed into water body.
A statistical analysis of land use data from 1987 to 2017 indicates that the area of built-up land and water body in dominant zones increased by 4.62 and 16.17 km2, respectively. In contrast, the area of aquatic vegetation decreased by 20.70 km2, while the area of cultivated land remained relatively unchanged. Nevertheless, the main land cover types of wetlands have changed frequently over the last 30 years and have been affected by extreme weather conditions. Wetland ecosystem evolution has demonstrated evident spatial heterogeneity characteristics. The transformation between aquatic vegetation and cultivated land, aquatic vegetation and water body, and cultivated land and water body in various dominant zones varied significantly.
4.3. Driving mechanisms for wetland evolution
4.3.1. Analysis of the driving factors in the cultivated land-dominant zone
Social and natural factors contributed collectively to the change in cultivated land, with social factors contributing 56.4% and natural factors contributing 43.6% (as shown in ). The top five contribution factors (the core driving factors) were REC, SIOV, Max_LST, PC, and LST. GDP, SIOV, PC, Max_LST, and EC are the core driving factors of aquatic vegetation change. Social and natural factors contributed 42.7% and 57.3%, respectively. For water body change, REC, GDP, Max_LST, PC, and EC were the core driving factors, and 62.5% was attributed to social factors while 37.5% to natural factors. Generally, Max_LST and PC were the two most stable influencing factors for land type change in the cultivated land-dominant zone.
Figure 5. Driving factors of LUCC change in the different dominated zones.
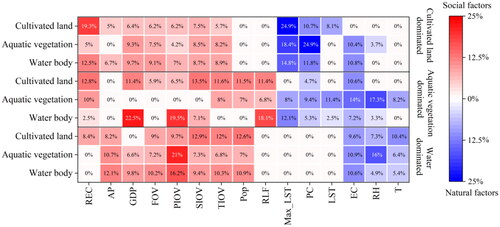
4.3.2. Analysis of driving factors in the aquatic vegetation-dominant zone
Social factors accounted for a greater proportion of changes in the cultivated land than natural factors (84.6% vs 15.4%). It was primarily REC, GDP, SIOV, TIOV, as well as Pop that were the core driving factors. Among the driving factors for aquatic vegetation change, social factors contributed 31.8%, and natural factors 68.2% with REC, PC, LST, EC, and RH are the core driving factors. In contrast, social and natural factors contributed 69.7% and 30.3%, respectively, to the driving factors for water body change. The core driving factors were GDP, PIOV, RLF, Max_LST, and EC. In general, the factors influencing land cover type change in the aquatic vegetation-dominant zone were relatively complex, without any stable influencing factors being identified.
4.3.3. Analysis of the driving factors in the water body-dominant zone
Cultivated land changes were influenced by social and natural factors, of which 72.7% contributed from social factors, whereas 27.3% contributed from natural factors. The core driving factors were PIOV, SIOV, TIOV, Pop, and T. There is a high proportion (65.7%) of social factors responsible for aquatic vegetation change, followed by natural factors (34.3%). AP, PIOV, EC, RH and T were the core driving factors. Social factors accounted for 79.0% of the driving factors for water body change, while natural factors accounted for 21.0%. The core driving factors were AP, PIOV, TIOV, Pop, and EC. As a whole, social factors presented a greater contribution to the driving mechanism of land-type change in the water body-dominant zone than natural factors.
There was a significant difference in the driving mechanism and core driving factors of different land cover types within the same dominant zone. In particular, the Max_LST and PC were two primary driving factors in the cultivated land-dominant zone. In contrast, the PIOV was the stable driving factor in the water body-dominant zone. The influencing factors for land type change in the aquatic vegetation-dominant zone were comparatively complex, and no stable influencing factors were observed.
5. Discussion
5.1. Advantages of land cover frequency in wetland studies
Generally, freshwater lake wetlands in the North China Plain are complex systems containing various land use types, including water body, aquatic vegetation, cultivated land, and built-up. The core elements of wetlands are water body (hydrological characteristics) and vegetation communities. Moreover, hydrological characteristics play an important role in the formation and change of wetland vegetation communities, which further affects the overall quality of the wetland ecosystem (Gu et al. Citation2018; Zhao et al. Citation1995). In contrast, built-up land and cultivated land are non-core elements of wetlands, which also play an essential role in understanding the patterns, processes, and functions of wetland systems (Zhang et al. Citation2008). The core and non-core elements of wetlands jointly contribute to the diversity, development, succession, and extinction of wetlands (Gao Citation2020; Deng et al. Citation2003).
Much attention is being paid to the impact of changes in the hydrological characteristics of wetlands and vegetation communities on the evolution of wetland ecosystems. Several researchers have proposed dividing wetlands into functional regions based on the inundation frequency or the correlation between inundation frequency and vegetation cover frequency to describe the details of local changes in wetlands (Lv et al. Citation2018; Song et al. Citation2018). However, the evolution of wetland cover types, particularly non-core elements such as cultivated and built-up land, cannot be adequately expressed by inundation frequency. The wetland zones were divided based on the land cover frequency in this study. The land cover types in the zone with a high cover frequency have remained stable for a long period and have been less affected by external factors. However, the low and medium-frequency regions tended to appear at the junctions between different land cover types where ecosystems were considered relatively fragile, making them suitable for short-term interference research since even accidental interference factors can significantly impact them. This study classified wetland zones with a land cover frequency between 60 and 80% into dominant zones, which had relatively stable land cover types for a long time and had regular evolution affected by natural and human factors. Furthermore, the results indicated that the distribution of wetland dominant zones had obvious spatial characteristics and landscape structure.
5.2. Difference analysis of driving mechanism in wetland ecosystem evolution
Spatial differences exist in the driving mechanisms underlying the evolution of wetland land cover types. Researchers have debated whether natural or social factors are responsible for the evolution of the wetland ecosystem (Zhou et al. Citation2008; Liu et al. Citation2006; Peng et al. Citation2021). The Baiyangdian wetland was were divided into zones based on the land cover frequency in this study. The result indicated that in zones dominated by cultivated land and aquatic vegetation, social factors contributed to the driving mechanism of changes in water body and cultivated lands to a greater extent than natural factors. In contrast, natural factors accounted for greater changes in aquatic vegetation than social factors. However, in the water body-dominant zone, social factors were found to have a greater impact on the changes in water body, aquatic vegetation, and cultivated lands than natural factors. Based on the results presented above, natural and social factors play varying roles in determining land cover types in different dominant zones. It should be noted that these conclusions differ from those obtained in formal studies in which wetlands are viewed as a whole. According to Zhang et al. (Zhang et al. Citation2016), socio-economic development is the dominant factor driving the evolution of the Baiyangdian wetland, neglecting the regional differences in wetlands.
Driving mechanisms of different land cover types were different. The three land cover types in the Baiyangdian wetland differ significantly in driving factors and contribution weights (as shown in ) due to the difference in the intensity of human and natural intervention on different underlying surfaces, which has been widely demonstrated (Salem et al. Citation2021; Yang et al. Citation2022). Also, even though the driving factors for the same land cover type in different dominant zones differed, some elements remained the same. Among which the Secondary Industry Out Value (SIOV) was very sensitive to the change of cultivated land, and cumulative evaporation (EC), closely related to the change of water body, played a significant role in the evolution of aquatic vegetation. According to the study, some key factors are relatively stable during the evolution of wetland land cover types.
There are temporal differences in the driving mechanisms underlying the evolution of wetland land cover types. It has been shown in recent studies that the contribution of wetland driving factors over different periods can be intuitively reflected through redundancy analysis (RDA) (Zhao et al. Citation2021a; Wang et al. Citation2021; Poulter Citation2012). A quantitative analysis of the land use change in the Baiyangdian wetland was conducted using the RDA method to verify whether there is a temporal difference in the driving mechanism. The results were presented in and . According to the RDA analysis model of the cultivated land-dominant zone, seven natural factors, including daily minimum surface temperature, air temperature, minimum relative humidity, cumulative evaporation, daily average evaporation, daily minimum temperature and relative humidity, primarily affecting the cultivated land-dominated zone in 1987, 1989, 1992, 1995, 1999 and 2002. Furthermore, there was one socio-economic factor, namely the secondary industry’s output value, which primarily affected 2005, 2009, 2013 and 2017. According to the results of the RDA analysis model of dominant fluctuations of aquatic vegetation, cumulative evaporation, daily average evaporation, Maximum land surface temperature (Max_LST), and daily average precipitation were the four natural factors that significantly affected aquatic vegetation in 1987, 1989, 1992, 1995, 1999, and 2009. The aquatic vegetation was affected by four socio-economic factors, including aquatic products, the output value of secondary industries, rural electricity consumption, and the total population in 2002, 2005, 2013, and 2017. In addition, it is evident that land use change in the water body-dominated zone is significantly correlated with three natural factors, namely, the temperature, cumulative evaporation, and daily average evaporation, which were primarily observed in 1987, 1989, 2002, and 2009. In addition to the above natural factors, five socio-economic factors, including the total population, the rural labor force, secondary industry, aquatic products, and fishery output value, were most prominent in 1992, 1995, 1999, 2005, 2013, and 2017. Overall, on the temporal scale, the three fluctuation zones were mainly affected by natural factors in the early stage and social factors in the late stage, with 2002 representing a turning point.
Figure 6. RDA ranking of driving factors in the cultivated land-dominated zone, the aquatic vegetation-dominated zone, and the water body-dominated zone (arrows represent driving factors, dots represent interannual time).
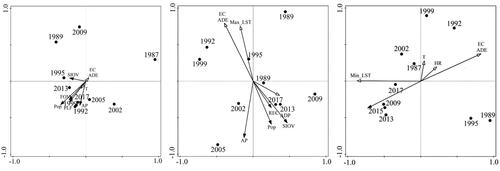
Table 1. RDA analysis results of driving factors in different dominant regions.
6. Conclusion
This study examined the land cover change of Baiyangdian wetlands in the past 30 years and its driving mechanisms. The following conclusions could be drawn from this study.
There was an obvious spatial differentiation of land cover frequency in the Baiyangdian wetland. Regarding to the spatial characteristics of land cover frequency, the low-frequency zones were located at the intersection of different types of land cover, which was very vulnerable to external factors. Alternatively, land cover types in zones with a high frequency were more stable and less affected by external factors. The defined dominant zones, in which land cover types were subject to regular changes under external factors, are crucial to understanding how wetlands evolve.
The land cover types of Baiyangdian wetlands have changed frequently over the past 30 years and show significant spatial heterogeneity in different dominant zones. Between 1987 and 2017, the area of built-up land and water body in the dominant zones of the wetland increased by 4.62 and 16.17 km2, respectively, aquatic vegetation decreased by 20.70 km2, and cultivated land remained almost unchanged. Due to the combined effect of natural and human factors, the structure and mode of land use have been transformed.
Space and time played an important role in driving the ecosystem evolution of the Baiyangdian wetland, showing obvious differentiation. The impact of space was most evident in the differences between cultivated land-dominant zones, aquatic vegetation-dominant zones, and water body-dominant zones. In terms of temporal scale, it was mainly influenced by natural factors in the early stage and by social factors in the late stage, with the year 2002 as the turning point, indicating an increase in human disturbance of wetlands. Furthermore, the driving mechanisms of different land cover types were quite different.
Acknowledgements
The authors are indebted to the editors for their valuable comments and suggestions. I am very grateful to the following funds for support of this paper: The project of science and technology of the Henan province for tackling key problems [222102320364]. The key scientific research project of Henan University [21A170004]. Beijing Municipal Natural Science Foundation–Beijing Municipal Education Commission Joint Key Project [KZ20190028042].
Disclosure statement
No potential conflict of interest was reported by the author(s).
Data availability statement
The datasets generated for this study are available from the corresponding author.
References
- Bedford BL. 1996. The need to define hydrologic equivalence at the landscape scale for freshwater wetland mitigation. Ecol Appl. 6(1):1–14. doi: 10.2307/2269552.
- Cui L, Gao C, Zhou D, Mu L. 2013. Quantitative analysis of the driving forces causing declines in marsh wetland landscapes in the Honghe region, northeast China, from 1975 to 2006. Environ Earth Sci. 71(3):1357–1367. doi: 10.1007/s12665-013-2542-5.
- Deng F, Wang X, Cai X, Li E, Jiang L, Li H, Yan R. 2013. Analysis of the relationship between inundation frequency and wetland vegetation in Dongting Lake using remote sensing data. Ecohydrology. 7(2):717–726. doi: 10.1002/eco.1393.
- Deng W, Pan XL, Luan ZQ. 2003. Advances in wetland hydrology. Adv Water Sci. 4:521–527.
- Gao XQ. 2020. Dynamic evolution of multi-temporal land cover frequency in Baiyangdian Wetland. Capital Normal University; p. 18–22.
- Ghayour L, Neshat A, Paryani S, Shahabi H, Shirzadi A, Chen W, Al-Ansari N, Geertsema M, Pourmehdi Amiri M, Gholamnia M, et al. 2021. Performance evaluation of sentinel-2 and landsat 8 OLI data for land cover/use classification using a comparison between machine learning algorithms. Remote Sensing. 13(7):1349. doi: 10.3390/rs13071349.
- Gong Z, Li H, Zhao W, Gong H. 2013. Driving forces analysis of reservoir wetland evolution in Beijing during 1984–2010. J Geogr Sci. 23(4):753–768. doi: 10.1007/s11442-013-1042-6.
- Gu J, Qin Y, Wang X, Ma JY, Guo ZH, Zou LJ, Shen XH. 2018. Changes in inundation frequency in Poyang Lake and the response of wetland vegetation. Acta Ecologica Sinica. 38:7718–7726.
- Halls JN, Magolan JL. 2019. A methodology to assess land use development, flooding, and wetland change as indicators of coastal vulnerability. Remote Sens. 11(19):2260. doi: 10.3390/rs11192260.
- Hou, Ge, Gao, Meng, Li, Yin, Liu, Feng, and Liang. 2020. Ecological risk assessment and impact factor analysis of alpine wetland ecosystem based on LUCC and boosted regression tree on the Zoige Plateau, China. Remote Sensing 12(3):368. doi: 10.3390/rs12030368.1.
- Hu S, Liu C, Zheng H, Wang Z, Yu J. 2012. Assessing the impacts of climate variability and human activities on streamflow in the water source area of Baiyangdian Lake. J Geogr Sci. 22(5):895–905. doi: 10.1007/s11442-012-0971-9.
- Li Z, Liu Y, Xie J, Wang G, Cheng X, Zhang J, Sang C, Liu Z. 2022. Impact of microecological agents on water environment restoration and microbial community structures of trench system in a Baiyangdian wetland ecosystem. J Appl Microbiol. 132(3):2450–2463. doi: 10.1111/jam.15238.
- Liu C, Xie G, Huang H. 2006. Shrinking and drying up of Baiyangdian Lake wetland: a natural or human cause? Chin GeographSc. 16(4):314–319. doi: 10.1007/s11769-006-0314-9.
- Liu Y, Zhang B, Wang L, Wang N. 2013. A self-trained semisupervised SVM approach to the remote sensing land cover classification. Computers & Geosciences. 59:98–107. doi: 10.1016/j.cageo.2013.03.024.
- Lu X, Liu H, Yang Q. 2000. Wetlands in China: feature, value and protection. Chin GeographSc. 10(4):296–301. doi: 10.1007/s11769-000-0043-4.
- Lv JX, Jiang WG, Wang WJ, Chen K, Deng Y, Li Z. 2018. Wetland landscape pattern change and its driving forces in Beijing-Tianjin-Heibei region in recent 30years. Acta Ecol Sin. 38(12):4492–4503.
- Peng JW, Liu SG, Lu WZ, Liu MC, Feng SL, Cong P. 2021. Continuous change mapping to understand wetland quantity and quality evolution and driving forces: a case study in the Liao River Estuary from 1986 to 2018. Remote Sens. 13(23):4900. doi: 10.3390/rs13234900.
- Poulter A. 2012. The ‘Europeanisation’ of cataloguing codes: an analysis of the evolution of RDA. Emerald; p. 67–84. doi: 10.1108/S1876-0562(2012)0000006007.
- Salem M, Bose A, Bashir B, Basak D, Roy S, Chowdhury IR, Alsalman A, Tsurusaki N. 2021. Urban expansion simulation based on various driving factors using a logistic regression model: Delhi as a case study. Sustainability. 13(19):10805. doi: 10.3390/su131910805.
- Sica YV, Quintana RD, Radeloff VC, Gavier-Pizarro GI. 2016. Wetland loss due to land use change in the Lower Paraná River Delta, Argentina. Sci Total Environ. 568(15):967–978. doi: 10.1016/j.scitotenv.2016.04.200.
- Song C, Ke L, Pan H, Zhan S, Liu K, Ma R. 2018. Long-term surface water changes and driving cause in Xiong’an, China: from dense Landsat time series images and synthetic analysis. Sci Bull (Beijing). 63(11):708–716. doi: 10.1016/j.scib.2018.05.002.
- Sun Z. 2011. Estimating urban impervious surfaces from Landsat-5 TM imagery using multilayer perceptron neural network and support vector machine. J Appl Remote Sens. 5(1):053501. doi: 10.1117/1.3539767.
- Wang C, Wang G, Dai L, Liu H, Li Y, Qiu C, Zhou Y, Chen H, Dong B, Zhao Y, et al. 2021. Study on the effect of habitat function change on waterbird diversity and guilds in Yancheng coastal wetlands based on structure–function coupling. Ecol Indic. 122:107223. doi: 10.1016/j.ecolind.2020.107223.
- Wu F, Mo C, Dai X. 2022. Analysis of the driving force of land use change based on geographic detection and simulation of future land use scenarios. Sustainability. 14(9):5254. doi: 10.3390/su14095254.
- Yang X, Jin X, Yang Y, Song J, Zhang T, Zhou Y. 2022. Spatially explicit changes of forestland in Taiwan Province from 1910 to 2010. J Geogr Sci. 32(3):441–457. doi: 10.1007/s11442-022-1956-y.
- Yuan J, Cohen MJ, Kaplan DA, Acharya S, Larsen LG, Nungesser MK. 2015. Linking metrics of landscape pattern to hydrological process in a lotic wetland. Landscape Ecol. 30(10):1893–1912. doi: 10.1007/s10980-015-0219-z.
- Zhang M, Gong ZN, Zhao WJ. 2016. Analysis of driving forces of Baiyangdian wetland evolution during 1984-2013. Chinese J Ecol. 35(2):499–507.
- Zhang X, Wang G, Xue B, Zhang M, Tan Z. 2021. Dynamic landscapes and the driving forces in the Yellow River Delta wetland region in the past four decades. Sci Total Environ. 787:147644. doi: 10.1016/j.scitotenv.2021.147644.
- Zhang XG, Yin XR, Feng XQ. 2008. Review of the issues related to wetland hydrology research. Wetland Sci. 6:106–115.
- Zhao CP, Gong JG, Zeng QH, Yang M, Wang Y. 2021a. Landscape pattern evolution processes and the driving forces in the wetlands of Lake Baiyangdian. Sustainability. 13(17):9747. doi: 10.3390/su13179747.
- Zhao D, Guo C, Wu D, Guo X. 2023. Different driving mechanisms of spatial heterogeneity at the community and landscape levels in the wetland ecosystem dominated by hydro-ecological processes. Hydrol Processes. 37(6). First published: 01 June 2023 doi: 10.1002/hyp.14916.
- Zhao Y, Wang S, Zhang F, Shen Q, Li J, Yang F. 2021b. Remote sensing-based analysis of spatial and temporal water colour variations in Baiyangdian Lake after the establishment of the Xiong’an new area. Remote Sens. 13(9):1729. doi: 10.3390/rs13091729.
- Zhao YK, Zhang YK, Ma DM, Zhang YT. 1995. Baiyangdian functional zone division principle. Environ Sci:S1,40–41 + 46.
- Zhou D, Gong H, Wang Y, Khan S, Zhao K. 2008. Driving forces for the marsh wetland degradation in the Honghe national nature reserve in Sanjiang Plain, Northeast China. Environ Model Assess. 14(1):101–111. doi: 10.1007/s10666-007-9135-1.