
 ?Mathematical formulae have been encoded as MathML and are displayed in this HTML version using MathJax in order to improve their display. Uncheck the box to turn MathJax off. This feature requires Javascript. Click on a formula to zoom.
Abstract
Natural resource managers need innovative and cost-effective methodologies that enable the targeted removal of aquatic invasive species (AIS). Removing AIS before they establish and spread into critical habitat for native species can mitigate invasions in freshwater systems and preserve ecosystem integrity. To address this need, we established protocols using the detection of environmental DNA (eDNA) to guide deployment of traditional fisheries trapping methods for invasive fish species removal. In a pilot study during spring 2022, we set minnow traps (one per site) in a spatially stratified random design. We also developed a quantitative polymerase chain reaction (qPCR) assay to detect eDNA from multiple closely related invasive loach species (family Cobitidae) and compared detections of eDNA with detections of fish using minnow traps. At sites where both eDNA and minnow traps were deployed, the two methods agreed on the presence of loaches approximately 79% of the time (95% CI: 60%-90%). Based on the rate at which minnow traps failed to detect loaches when eDNA samples were positive (22%; 95% CI: 11%-40%), we estimated that setting three or more replicate traps per site would improve detections with gear. This information was used to inform a more comprehensive study in spring 2023. This main study consisted of two phases: (1) a fixed-point DNA study to calibrate a model of dispersal and attenuation rate, and (2) a loach removal phase. In the removal phase, we randomly selected sites to sample for loach eDNA, plotted eDNA concentration as a GIS layer to develop heatmaps, and then placed 10 replicate traps at sites with the highest concentrations. A total of 658 loaches were removed from 68 of 77 eDNA-positive trapped sites. Our results indicate that aquatic invasive species removal is more efficient when eDNA detection techniques are combined with traditional trapping methods.
KEY POLICY HIGHLIGHTS
When planning a targeted removal strategy for aquatic invasive species (AIS), a pilot study with a simple sampling design can provide the necessary information to develop a species- and site-specific eradication plan.
Developing species-specific assays and calibrating environmental DNA (eDNA) detection probabilities for specific conditions provides a means of accurately describing species distributions initially without labor and time intensive trapping.
Guiding trapping with eDNA improves detection and increases capture success. Setting multiple traps at each eDNA-selected site maximizes removal results.
Introduction
Invasive species are a major driver of global change (Vitousek et al. Citation1996) and represent the second greatest threat to biodiversity following habitat destruction (Wilcove et al. Citation1998). Aquatic invasive species (AIS) can have devastating effects on aquatic systems (Mooney and Drake Citation1987) and the introduction of non-native fishes has been identified as one of the factors contributing to the decline of native fish populations around the world (Dudgeon et al. Citation2006). Invasive fishes can negatively impact native species’ population abundance through direct predation, direct competition for resources, habitat alterations, introduction of foreign pathogens, and general disruption of ecological processes, leading to cascading effects throughout the ecosystem (Ogutu-Ohwayo and Hecky Citation1991; Strayer et al. Citation2006).
In addition to the ecological impacts, invasive species can also be economically costly with losses spanning from millions to billions of dollars annually in the US alone (Pimentel et al. Citation2005; Pimentel Citation2007). Invasive species costs within the US are estimated to be more than $100 billion (Pimentel et al. Citation2005) due mainly to increasing globalization (Meyerson and Mooney Citation2007). Biological invasions are likely to continue as modern travel, trade, and technology use increases, so the need for more proactive and strategic approaches to AIS management is paramount (Mack et al. Citation2000; Reaser and Waugh Citation2007; Seebens et al. Citation2017). Recognizing the persistent threat of biological invasions, the US government called for federal agencies to develop innovative technologies for addressing the problem of invasive species (Executive Office of the President Citation2016; NISC, Citation2016; Martinez et al. Citation2020). Indeed, modern detection methods paired with the targeted removal of an invasive species can be much cheaper than traditional eradication efforts (Epanchin-Niell and Liebhold Citation2015; Epanchin-Niell Citation2017). The choice of eradication method(s) for AIS depends on several factors including the biology of the invasive species, ecosystem conditions, and the feasibility and logistics of project implementation. Often, a combination of mechanical removal (e.g. trapping, electrofishing, seining), chemical control (e.g. piscicides), and environmental modification (e.g. water level manipulation, thermal control) methods are needed to achieve total eradication (Rytwinski et al. Citation2019). When chemical treatments such as rotenone and environmental modifications are not viable options, management approaches for AIS removal typically rely exclusively on mechanical capture methods. These efforts may fail to produce the intended results, especially when the abundance and distribution information of invaders is lacking (Gu and Swihart Citation2004; Britton et al. Citation2011; Sigsgaard et al. Citation2015). Within the last decade, researchers and resource managers have recognized the potential of pairing eDNA sampling with traditional capture techniques to design targeted trapping strategies tailored to the specific distribution and behavior of invasive fish populations (Davison et al. Citation2017; Hinlo et al. Citation2017; Carim et al. Citation2020; Dubreuil et al. Citation2022). While this relationship has been recognized, and studies have been conducted to compare the efficacy of traditional and molecular methodologies (Dejean et al. Citation2012; Robinson et al. Citation2019; Sard et al. Citation2019; Pukk et al. Citation2021; Dubreuil et al. Citation2022), few studies exist in which eDNA has been used to inform and optimize removal efforts. The use of eDNA to complement removal efforts offers several major advantages over traditional, more indiscriminate approaches, including increased efficiency, sensitivity, reduced disturbance to habitats, and the ability to detect species even at low densities or during specific life stages (Belle et al. Citation2019; Przybyla-Kelly et al. Citation2023). This last point is critical because eradication or containment efforts are most efficient between the establishment and dispersal stage of an invasion (Hulme Citation2006; Lodge et al. Citation2006; Mehta et al. Citation2007).
Our goal was to develop and evaluate an eDNA-guided approach for the targeted removal of cryptic invasive fishes. Our study consisted of a pilot study and a main study. The objectives of the pilot study were to (1) develop and validate species-specific assays (quantitative PCR, qPCR) to detect three closely related and invasive Cobitid species, and (2) compare eDNA-based detection techniques with conventional trapping gear. The information learned through the pilot study was used to develop a more comprehensive sampling strategy in 2023. The objectives of the main study were to (1) optimize an AIS removal project by calibrating eDNA detection to the specific sampling site, and (2) evaluate an eDNA-based sampling design using concentration levels of eDNA to target specific locations for removal efforts.
Materials and methods
Study site
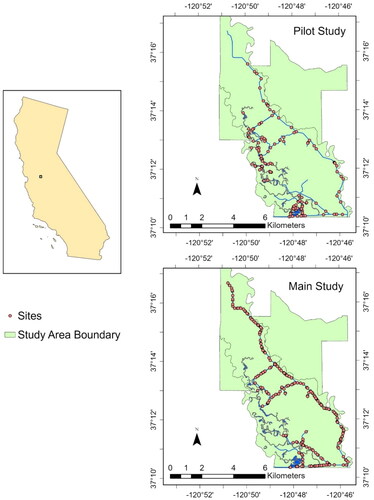
The San Luis National Wildlife Refuge (SLNWR) () is in Merced County, California, USA. The refuge is bisected in its eastern portion by the San Joaquin River and contains a mixture of habitats, including over 108 km2 of riparian woodlands, wetlands, native grasslands, vernal pools, and alkali sinks. We selected study sites in the San Luis and West Bear Creek units of the refuge for multiple reasons, including (1) proximity to the mainstem San Joaquin River, (2) the presence of large floodplain habitat, and (3) the previous collection of three loaches by refuge staff in 2019. Water is dispersed through the study area by various water delivery structures, including natural channels, constructed canals, drains, culverts, and ditches.
Figure 1. Study area within the San Luis National Wildlife Refuge (Merced County, California, USA) containing sites sampled during the 2022 pilot study and the 2023 main study. For the purposes of this map, sampled means visited for eDNA collection, trapping, or both.
Target species
Native to Asia, Paramisgurnus dabryanus (Large-Scale Loach), Misgurnus mizolepis (Fine-Scale Loach), and Misgurnus anguillicaudatus (Pond Loach) of the family Cobitidae are popular home freshwater aquarium fish that have been introduced to North American waters. Misgurnus anguillicaudatus was first discovered in 1939 near Oakland County, Michigan, USA (Schultz Citation1960) and M. mizolepis was first discovered in 1977 near Baker County, Oregon, USA (Logan et al. Citation1996). Paramisgurnus dabryanus was first detected in 2014 near the San Joaquin River in Madera County, California, USA (Kirsch et al. Citation2018). These species are frequently found in lentic or low gradient lotic habitats with muddy substrates and high turbidity (Park and Kim Citation2001); they can tolerate a wide range of water temperatures (10–30 °C) and become air breathers in anoxic environments (reviewed by Kirsch et al. Citation2018). Furthermore, they can be difficult to detect and remove because they are nocturnally benthic fish that can burrow into substrates under dewatered conditions (Meyer and Hinrichs Citation2000; Oh and Park Citation2011; Zhang et al. Citation2012).
Loaches are omnivorous benthic feeders that apparently forage opportunistically, with a diet consisting of zooplankton, macroinvertebrates, algae, and detritus (Wang and Li Citation2005; Kanou et al. Citation2007; Pyrzanowski et al. Citation2019). Loaches have also been observed to consume juvenile Central Valley Chinook Salmon (Oncorhynchus tshawytscha) in captivity (Hart Citation2024). Pyrzanowski et al. (Citation2019) hypothesized that the ability of loaches to consume a variety of foods enables the species to establish populations in a variety of habitats including those that are suboptimal for many fishes. California Central Valley floodplains represent critical habitat for multiple native fish species of conservation concern including Central Valley Spring- and Winter-run Chinook Salmon (Jeffres et al. Citation2008; Katz et al. Citation2017), Central Valley Steelhead (O. mykiss; Katz et al. Citation2013), and Sacramento Splittail (Pogonichthys macrolepidotus; Sommer et al. Citation2002) and there is concern that loaches could potentially negatively impact native fishes through competition, predation, and disease transmission (Kirsch et al. Citation2018). Loaches have been known to carry LV-1 Birnavirus, a close relative of Infectious Pancreatic Necrosis Virus that is deadly for salmonids (Chou et al. Citation1993; Urquhart Citation2013; Top-Karakuş and Karakuş Citation2022). Future efforts are needed that investigate the impacts of invasive loaches on salmonids and other sensitive native fish taxa and utilize the methods presented here to limit the spread of loaches into important native fish habitats.
Trapping gear
We used galvanized wired minnow traps to catch and remove loaches. Minnow traps were approximately 80 cm in length and 19 cm in diameter with 5 × 5 mm square-sized mesh and a 19 mm opening on each end. We baited each trap with approximately 96 g of salmon-flavored dry cat food (Acana® Bountiful Catch, Auburn, KY, USA) enclosed in mesh bait bags. The mesh bags were secured with bait holder thread (Atlas-Mike’s Bait, Inc., Ellensberg, WA, USA) and coated with salmon egg oil (Pro-Cure, Inc., Salem, OR, USA).
eDNA sample collection and processing
eDNA sample collection
We collected eDNA samples by simultaneously filtering water through three Millipore® Sterivex™-HV 0.45 μm sterile PVDF membrane filter units (Millipore Sigma, Burlington, MA, USA). A 300 cm length of silicone tubing (spooled peroxide-cured L/S 15; Masterflex®, Avantor, Radnor, PA, USA) was attached to each filter via a tube adapter (Masterflex® Fitting, polypropylene, straight, male luer to hose barb adapter, ¼ in). The opposite end of the tubing was affixed to a pole and lowered ≤ 15 cm below the water’s surface. We secured each tube into one of three Masterflex® L/S Easy-Load II peristaltic pumps and arranged in sequence to collect triplicate samples simultaneously. A brushless cordless drill and a 1.27 cm pump driver spade bit powered the pumps. We pumped water through each filter until the water flow conspicuously decreased, indicating that the filter was close to maximum particulate capacity. A beaker collected the filtrate from each sample, and we recorded the volume filtered, date, location ID, and filter replicate (A, B, or C). We capped the filters on both ends using a male luer integral lock ring inlet and female luer lock outlet cap, placed them in a labeled Ziploc® bag, and immediately placed the bag in a cooler on ice. All filters were kept on ice in the field before being transferred to a −20 °C freezer for storage.
To confirm that field equipment was contamination-free, we collected eDNA field controls at the start of each sampling day. Each field control consisted of 500 mL of Sterivex™ filtered ultra-pure water pumped using silicone tubing and peristaltic pumps as described above. Field controls were capped, labeled, placed in a Ziploc® bag, and kept on ice with the field samples collected during the corresponding sampling day. All caps and filters used during the study were sterile and single-use. Sterile tubing was used at the start of each sampling day and was re-used at multiple sampling sites. We pumped site water through the tubing for 2 min at each new location to clean the tubing between sites. During this step, water was pumped onto shore and away from the canal to avoid introducing exogenous eDNA to the new location. After the flush, filters were attached, and samples were collected as described above. Independent lab testing of this methodology by the Cramer Fish Sciences Genidaqs Laboratory (West Sacramento, CA, USA; data not published) has indicated that eDNA can be removed or diluted to levels below the detection limit with a thorough flush of the tubing.
eDNA sample processing
Samples collected during this study were sent to the Genidaqs Laboratory for processing and analysis. The DNA was isolated from Sterivex™ filters following the eDNA extraction protocol described by Miya et al. (Citation2016) with slight modifications to make the protocol compatible with the Vortex-Genie® 2 mixer (Marshall Scientific, Hampton, NH, USA). In brief, 440 µL Buffer PBS/Buffer AL/Proteinase K solution was added to each Sterivex™ filter. Filters were then incubated at 56 °C for 5 min before undergoing two 10 min room temperature vortex sessions. Between sessions, the filters were rotated 180° to ensure complete coverage of the filter membrane. The liquid was removed from the Sterivex™ cartridge using a 200 cc luer lock disposable syringe and added to a clean 1.5 mL microcentrifuge. The remaining steps followed the original protocol. Filter extraction controls were completed in parallel with samples to confirm that no contamination was introduced during the DNA extraction step. Extraction controls were generated by doubling the initial starting buffer and processing them simultaneously with field samples. All extractions were treated with Zymo® OneStep PCR Inhibitor Removal Kit (Zymo Research Corporation, Tustin, CA, USA) to purify DNA following the manufacturer’s protocol.
Pilot study
Site selection and random trapping
We selected 127 sampling sites using a spatially stratified random sampling strategy using the function st_sample (R package sf; Pebesma Citation2018). An approximately equal number of sites were selected from ponds (n = 62) and canals (n = 65) using shapefiles of waterbodies within the SLNWR. Site selection was stratified by the size of segments (either individual ponds or canal segments) represented in the shapefiles such that the number of sites in each segment was proportional to its size. No additional information about the sites (e.g. environmental characteristics, distances between sites) was used to select locations a priori. We chose this method to maximize spatial coverage, since we had no prior information about the distribution of loaches on the refuge. We generated, then randomized two lists containing pond and canal habitat sites. We worked down both lists each field day with the daily goal of visiting an approximately equal number of pond and canal sites. One baited minnow trap was set at each of the selected locations. The traps were soaked for approximately 24 h before they were removed from the environment. Environmental DNA samples were also collected at a random subset of sites comprised of 20 canal sites and eight pond sites. We measured the total length (TL) of all trapped loaches to the nearest mm before they were humanely euthanized by a rapid cranial blow. The fish samples were placed immediately on ice in the field and frozen upon return to the laboratory.
DNA extraction, sequencing, and species identification
A total of 25 loach specimens were submitted to the Genidaqs Laboratory for DNA extraction, species identification, and qPCR assay development. A total of 18 out of the 25 tissues submitted for sequencing were collected during the pilot study; one tissue sample was collected at the SLNWR prior to the pilot study, and the remaining six tissues were collected in the mainstem San Joaquin River in previous years. The DNA was extracted from the caudal fin clip of each specimen following the standard QIAGEN DNeasy® Blood and Tissue Kit protocol (QIAGEN Sciences, Germantown, MD, USA). A 675 base pair fragment of the cytochrome c oxidase subunit 1 (COI) mitochondrial DNA region was amplified using the FF2d and FR1d universal primers designed by Ivanova et al. (Citation2007). If COI sequencing failed to produce data, samples were additionally sequenced at the 12S and cytochrome b (cytb) regions using the 12S MiFish-U-F (Miya et al. Citation2015) and H1478 (Kocher et al. Citation1989) primers and cytb L14816 and H15173 (Parson et al. Citation2000) primers. The PCR amplification consisted of a 20 μL reaction volume with 1 µL DNA template, 10 µL 1x QIAGEN Multiplex PCR Master Mix, 7 µL ultra-pure water, and 2 µL forward and reverse primers (final concentration 0.2 µM). Thermocycling was performed using a C1000 Touch™ Thermal Cycler with 96-Well Fast Reaction Module (Bio-Rad, Hercules, CA, USA) optimized annealing temperature of 52˚ C, and the complete cycle profile of 5 min at 95˚ C, then 40 cycles of 95˚ C for 30 sec, 52˚ C for 30 sec, 72˚ C for 1 min, with a final extension at 72˚ C for 5 min. All PCR products were purified with the Agencourt AMPure XP PCR Purification protocol (Beckman Coulter, Inc., Brea, CA, USA) and submitted to the UC Davis Genome Center (Davis, CA, USA) for Sanger sequencing.
Sanger sequencing was successful in 24 of 25 tissue samples (see Supplementary Information). The DNA sequence data was trimmed and paired forward and reverse sequences were aligned using Geneious Prime® v. 2023.2.1 (Dotmatics, Boston, MA, USA). To genetically identify each specimen, we compared DNA sequences to known voucher specimens from the National Institutes of Health’s National Center for Biotechnology Information (NCBI) GenBank (https://www.ncbi.nlm.nih.gov/genbank) using the Basic Local Alignment Search Tool (BLAST+, Camacho et al. Citation2009). To further confirm species identification and assess genetic variation, we downloaded all genomic data available in NCBI for the three species of interest and their congeners and aligned them in Geneious Prime® v. 2023.2.1 using the Clustal Omega v. 1.2.2 algorithm (Sievers et al. Citation2011). A total of 335 (COI), 120 (cytb) and 102 (12S) sequences, including those generated for this study, were aligned and assessed for conserved regions within species that could be used in species identification and qPCR assay design. The COI gene region was determined to be the most diagnostic region and was preferentially used for species ID when possible. BLAST results and Clustal Omega alignment revealed three distinct California Central Valley genotypes that we could match to three loach species with high query coverage and sequence similarity: P. dabryanus, M. anguillicaudatus, and M. mizolepis. Of the 24 successfully sequenced samples, 17 were P. dabryanus, and one was M. mizolepis. Paramisgurnus dabryanus and M. mizolepis were the only loach species genetically determined to be present at the SLNWR based on the submitted samples. The six specimens from the mainstem San Joaquin River were genetically determined to be M. anguillicaudatus.
Assay design, optimization, and sensitivity
Two qPCR assays ([1] P. dabryanus + M. mizolepis [PD_MM] and [2] M. anguillicaudatus [MA]) were developed using the COI consensus sequences generated from the submitted specimens. We identified suitable TaqMan Minor-Groove-Binding (MGB) probe and primers using default parameters in Primer Express™ Software v.3.0.1 (Thermo Fisher Scientific, Waltham, MA, USA) (). We assessed the assay specificity in-silico by comparing the product sequence to the NCBI database using the BLAST + tool. In-silico cross-reactivity analysis indicated high specificity for both assays, with BLAST results of the assay product returning matches to voucher specimens with identical genotypes to local target specimens. We conducted primer and probe optimization following Applied Biosystems (Thermo Fisher ABI) guidelines for optimizing primer and probes for amplifying custom target sequences. Optimization was performed in triplicate, with a total reaction volume of 10 µL, 4 µL DNA template, 5 µL 1xTaqMan™ Environmental Master Mix 2.0 (Thermo Fisher ABI), 0.6 µL ultra-pure water, 0.1 µL forward and reverse primers (900 nM final concentration) and 0.2 µL of assay specific probe (60–250 nM final concentration). Thermocycling for the specificity and optimization PCR reactions was performed using the Applied Biosystems QuantStudio 3 system (Thermo Fisher ABI) for both assays under the following conditions: 10 min at 95 °C, 40 cycles of 15 sec denaturation at 95 °C and 1 min annealing/extension at 60 °C. The resulting data were analyzed using the QuantStudio™ Design & Analysis Software (Thermo Fisher ABI). Both assays performed optimally using 900 nM final concentrations for both forward and reverse primers. The optimal probe final concentrations were 200 nM and 140 nM for PD_MM and MA, respectively. Each assay was further assessed empirically with tissue-derived DNA from the three loach species and 16 additional fish species found in the Sacramento-San Joaquin Delta (). The DNA used during the empirical specificity testing was normalized to 2 ng·μL−1 (± 0.2 ng·μL−1) and analyzed in triplicate with the following PCR conditions: 4 µL DNA template, 5 µL 1xTaqMan™ Environmental Master Mix 2.0 (Thermo Fisher ABI), 0.6 µL ultra-pure water, 0.1 µL forward and reverse primers and 0.2 µL of assay specific probe with primers and probes at their respective optimized final concentrations. Empirical cross-reactivity testing revealed no cross-reactivity in either assay when template DNA of the non-target loach species was provided. Similarly, no cross-reactivity was observed when the assays were tested with 16 locally occurring fish species when total DNA from local species was normalized to 2 ng·μL−1 (± 0.2 ng·μL−1). To test the sensitivity of both assays, we created tenfold serial dilutions of P. dabryanus, M. anguillicaudatus, and M. mizolepis DNA extracted from tissue samples with a known relative starting concentration ranging from 2.0·10−7 to 2 ng·μL−1 for M. anguillicaudatus and M. mizolepis and 1.0·10−7 to 1.0 ng·μL−1 for P. dabryanus. Twelve technical replicates of each dilution were amplified using the optimized target-specific qPCR assays and the PCR cycling conditions described above. We evaluated the assay performance following the MIQE guidelines for qPCR assay publication outlined in Bustin et al. (Citation2009). The limit of detection (LOD), limit of quantification (LOQ), and coefficient of variance (CV) were calculated using the discrete method described by Klymus et al. (Citation2020). Both assays demonstrated efficiency, linear dynamic range, and precision that conform to the MIQE guidelines for publishing qPCR assays (Bustin et al. Citation2009). These metrics, along with the LOD and LOQ for each assay and target combination, are presented in .
Table 1. Primer and probe sequences, optimal final concentrations, and annealing temperature for P. dabryanus + M. mizolepis (PD_MM) and M. anguillicaudatus (MA) assays.
Table 2. Species tested for cross-reactivity with the M. anguillicaudatus and P. dabryanus + M. mizolepis assays.
Table 3. Assay performance with tenfold serial dilutions of each target.
Main study
Calibration of eDNA dispersion and attenuation rates
To understand eDNA transport and persistence in the study area, we deployed known quantities of commercially available frozen Engraulis mordax (Northern Anchovy) and Hemiramphus brasiliensis (Ballyhoo) in two canal types that best represented the physical conditions of waterways on the refuge: a small shallow canal (37.26998°, −120.84258°) and a large deep canal (37.17530°, −120.76124°). Each species was placed into separate 60 × 91 cm mesh bags with 16 g of E. mordax and 100 g of H. brasiliensis, representing the biomass of approximately one and five adult loaches, respectively, deployed at each location. These species were chosen as proxies for loaches because they do not occur locally. We recognize that eDNA shed from freshly euthanized and frozen fish of a different species would not be a perfect proxy for loach eDNA; however, we proceeded with this set-up due to time and permitting restrictions related to deploying a live fish species that was not already present in the canals. Each bag was secured to the bottom of the canal using a 2.2 kg Danforth style anchor to mimic where the target species would most likely occur in the water column. A buoy was tied to each setup to mark the location of the anchor for easy removal. We used a Garmin ETREX 22x GPS unit (Garmin Ltd., Olathe, KS, USA) to measure the distance from the position of the DNA source to establish six eDNA sampling sites 0, 10, 50, 100, 250, and 500 m downstream from the source. Flow was measured using a Global Water FP111 Flow Probe (YSI Inc., Yellow Springs, OH, USA) to calculate the time required for DNA to disperse across the 500 m sampling range. Water turbidity was also measured prior to sampling using a Hach 2100Q Turbidity Meter (Hach Co., Loveland, CO, USA). An eDNA field control was collected at the start of the day by filtering 500 mL of ultra-pure water through a single Millipore Sterivex ™ 0.45 μm sterile filter. After the calculated dispersal time had passed, we collected simultaneous triplicate eDNA samples at each sampling distance following the water filtration protocol outlined above (see ‘eDNA Sample Collection’). When sampling was complete, the eDNA sources were removed from both canal types. We repeated the eDNA sample collection process at the same locations the following day to assess if eDNA from the proxy species remained in the system after 24 h. Filters were stored on ice and transported to the Genidaqs Laboratory for eDNA extraction and analysis.
The DNA was isolated from each filter as described above (see ‘eDNA sample processing’). The extracts were analyzed for E. mordax (Sassoubre et al. Citation2016), H. brasiliensis (Bowen et al. Citation2024), and P. dabryanus/M. mizolepis eDNA using qPCR. For both canal types, each filter was analyzed with three technical qPCR replicates using the corresponding optimized primer and probe concentrations and the PCR conditions for each assay. Three replicates of a no template control (NTC) and three replicates of a positive control were added to each qPCR plate to confirm PCR integrity and plate-to-plate consistency. The NTC and positive control were produced by replacing the eDNA sample template with 4 µL of ultra-pure water or 4 µL of tissue-derived target DNA, respectively, in the PCR reaction. All reactions were performed using the Applied Biosystems QuantStudio 3 system (Thermo Fisher ABI) and the resulting data was analyzed using the QuantStudio™ Design & Analysis Software (Thermo Fisher ABI). The qPCR results for E. mordax and H. brasiliensis were modeled in R Studio using the Artemis package (Espe et al. Citation2022) to predict the probability of detecting the target organism at set distances from the source. We used the eDNA_lmer function to determine the effect size of distance and biomass on the natural logarithm of the concentration of eDNA (ln[eDNA]) for each canal type. The effect sizes were then used to compute the probability of detection (PoD) at the tested distances from the eDNA source using the p_detect function. The model output and the qPCR data generated during the calibration study were assessed to determine the downstream detection range of target eDNA relative to a sampling site to inform where minnow traps should be placed during the removal effort.
Site selection and targeted trapping
We identified a total of 300 potential sampling sites within approximately 11 km of small and large canals in a spatially random manner using the function st_sample (R package sf; Pebesma Citation2018). The initial site selection process was similar to the methods described in the pilot study; however, site selection was limited to canals in the main study because loaches were assumed not to inhabit ponds based on the pilot study results. The prioritization of how sites were visited in the field during the main study also differed. Environmental DNA sampling and loach trapping alternated weekly for six weeks to permit strategic deployment of traps based on the previous week’s eDNA results. We sampled for eDNA at the maximum number of sites possible in a five day period based on sampling logistics, hours of daylight, and weather (averaging 14 to 18 sites per day). Each site was sampled for eDNA only once prior to trapping. The sites containing the highest concentrations of loach eDNA in a given week received priority for trapping the following week. We generated heatmaps (see Supplementary Information) of the relative concentration of loach eDNA using the Kernel Density Heatmap tool in QGIS version 3.28.11 to guide trapping efforts. During trapping weeks, we trapped the maximum number of positive sites possible within a five day period (averaging two to four sites per day). We deployed 10 galvanized wired minnow traps at each site. The 10 traps were spaced evenly over a 260 m distance moving upstream from the location where loach eDNA was detected. We chose this distance based on the results of the eDNA calibration study. The traps were soaked for approximately 24 h before they were removed from the environment. Trapping efforts in a given day rotated between setting new traps and retrieving traps from the previous day. Sites were trapped only once during the study.
The alternating weekly sampling schedule allowed us to minimize contamination risks and improve logistical efficiency. Two additional weeks of only trapping were conducted after the eDNA filter budget was exhausted. The aim of the additional trapping was to maximize removal efforts using the remaining eDNA-positive sites from Week 6 that were not trapped. These two additional weeks are referred to hereafter as ‘Week 7 and Week 8’. We measured the TL of all trapped loaches to the nearest mm (except for two that were unmeasurable) before we humanely euthanized them by a rapid cranial blow. We retained and froze all loaches for a follow-up genomics study.
Statistical analysis
We compared eDNA-based detection methods with conventional trapping gear using a confusion matrix. Sensitivity and specificity calculations with confidence intervals were calculated using the confusion_matrix function in the qwraps2 package (DeWitt Citation2021). This package calculates confidence intervals using Wilson’s method (Wilson Citation1927), which is suitable for small sample sizes. We assigned eDNA as the truth value and minnow traps as the predictor value. We understand that these labels may be misleading as no attempts were made to verify that there were no loaches present at sites where both detection methods were negative.
We used the glmmTMB function in the glmmTMB package (Brooks et al. Citation2017) to fit models of mean catch for the two experiments. Model families that we considered were Poisson, negative binomial, and the truncated (hurdle) versions of the Poisson and negative binomial. We considered Poisson and negative binomial model formulations because they have good characteristics for count data; we also considered hurdle versions of these formulations because we suspected that the data for loach counts had too many zeros for these options to fit well. The dependent variable for these models was the total number of loaches caught at a site; for the main study, this was the sum of catch for all traps placed at site. All model formulations for each study shared a count model; for the pilot study, the count model only included a mean (intercept) while the model for the main study included separate terms for each week of trapping to facilitate comparisons of catch over time. All models included an offset for log of time fished (min) to account for unequal sampling effort. For the pilot study, only one trap was set at each location, so the time fished was the amount of time the single trap was in the water. For the main study, the time fished was the sum of the time that each of the traps at a site (usually 10, however trapping weeks two, four, and six each contained one site where only nine of 10 traps were recovered) were in the water. The truncated models had an additional mean (intercept) for the zero portion of the model. For each study, we chose the model with the lowest AIC value.
To compare catch between the two study designs (placing traps randomly for the pilot versus placing traps based on eDNA concentrations in the main), we used the selected models to predict catch for a single trap set for one day (24 h or 1440 min). We estimated 95% confidence intervals for the estimates by bootstrapping. The bootstrapping method we used was carried out through the boot package (Davison and Hinkley Citation1997; Canty and Ripley Citation2022) using the boot and boot.ci functions to estimate variation in the response predictions calculated by the predict.glmmTMB function using 100 replicates. The response predictions give the expected value for catch, considering both the count and zero portions of the hurdle model (i.e. mu∗(1−p) where mu is the expected value of the count portion and p is the probability of a zero in the zero portion).
Results
Pilot study
Random trapping and eDNA results
We collected 18 loaches from nine canal sites in 2022 () during 1485.25 trapping hours. No loaches were collected in ponds. We sampled 28 sites (20 canal, 8 pond) using minnow traps and eDNA and determined that positive detections for loach eDNA () and trapped loaches at given locations occurred 79% of the time (95% CI: 60%-90%; ). A total of eight loaches were also captured at sites where only minnow traps were deployed. Six of the 28 sites sampled using both methods were positive for loach eDNA, but loaches were captured at only one of those sites with a trap, giving a false omission rate of 22% (95% CI: 11%-40%; ). Loaches caught in the pilot study ranged from 30–140 mm TL (). All sites from the pilot study were tested using both assays (PD_MM and MA); however, only P. dabryanus/M. mizolepis eDNA was detected, indicating that one or both of those species were present at/or near the six positive locations. Misgurnus anguillicaudatus was not detected at any of the eDNA sites during the pilot study nor was that species determined to be present at the refuge when species identifications were confirmed through fin clippings.
Figure 2. Box plot summarizing the distribution of total lengths (TLs) of loaches caught during the pilot study and the main study. Weeks 2, 4, and 6 of trapping were preceded by eDNA sampling during Weeks 1, 3, and 5. Weeks 7–8 comprised of only trapping using the remaining eDNA positive sites that were not trapped during week 6. One minnow trap per site was used during the pilot, while ten minnow traps per site were used for the main. The open circle points represent total length outliers. The bold black line in each box represents the median length and the whiskers extend 1.5 times the interquartile range.
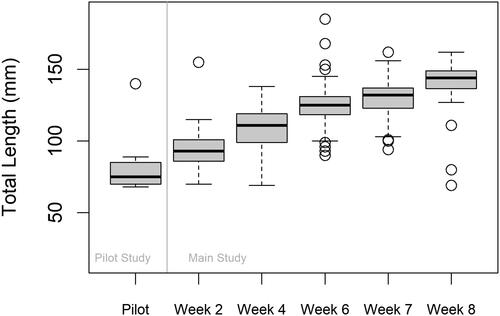
Table 4. The 2022 field effort for the pilot study.
Table 5. Sensitivity, specificity, and related rates comparing minnow traps (‘predictor’) to eDNA (‘truth’) for the pilot study.
Main study
Calibration of eDNA dispersion and attenuation rates
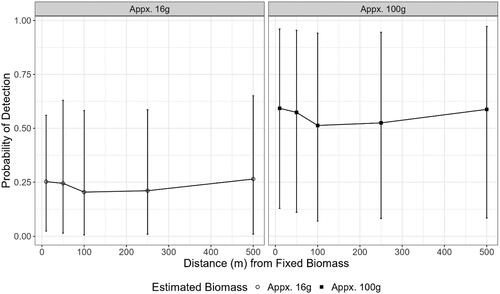
Environmental DNA from both proxy fishes was present in the small canal. Hemiramphus brasiliensis eDNA was detected at all six sampling distances while E. mordax was detected at only two sampling distances (10 m and 500 m) downstream of the DNA sources (). In the large canal, H. brasiliensis eDNA was detected at one sampling distance (100 m) and E. mordax was not detected (). When the proxy fish were removed from the system for 24 h, eDNA was detected for H. brasiliensis at two sites (10 m and 100 m) in the small canal (). However, H. brasiliensis eDNA was also detected in the field control () which suggests the occurrence of exogenous DNA contamination. There were no detections of E. mordax eDNA at any distance observed in the small canal post-removal (). There were also no eDNA detections in the large canal for the two species post removal (). Paramisgurnus dabryanus eDNA was detected in the large canal at 100, 250, and 500 m but was not observed at any distance in the small canal (). Loach eDNA was detected at 500 m for the large and small canal 24 h later (). Mean flow rates at the 0 m location in both canals were 0.1 m⋅s−1. Thus, DNA molecules are estimated to move 500 m downstream in approximately 83 min. The turbidity in the large canal was measured at 58.2 NTU whereas the small canal had a turbidity of 16.7 NTU. There was a strong positive effect of H. brasiliensis on eDNA in the small canal (= 1.39, [95% CI: 0.16–2.44]); however, the relationship between distance and eDNA was unclear (). The mean effect size of most distances modeled trended negative but credible intervals overlapped with zero, indicating a non-significant effect of distance (). The mean probability of eDNA detection in a single filter was stable at all distances tested, ranging from a low of 0.51 (95% CI: 0.07–0.94) at 100 m to a high of 0.59 (95% CI: 0.13–0.96) at 10 m from a larger biomass target (). This trend was also observed for the smaller biomass, with the lowest mean PoD observed at 100 m (
=0.21 [95% CI: 0.01–0.59]) and the highest observed at 500 m (
= 0.26 [95% CI: 0.01–0.65]) (). The PoD for the larger biomass target was significantly higher than the smaller target at all distances. Confidence intervals for these estimates were large, indicating uncertainty in the predictions ().
Figure 3. Quantitative PCR detections of E. mordax (circle) and H. brasiliensis (square) within the small and large canal during initial sampling (a and b, respectively) and 24h after the removal of the proxy fishes from the small and large canal (c and d, respectively). Each point above 0 ng·μL−1 indicates that target eDNA was detected and represents a positive technical replicate.
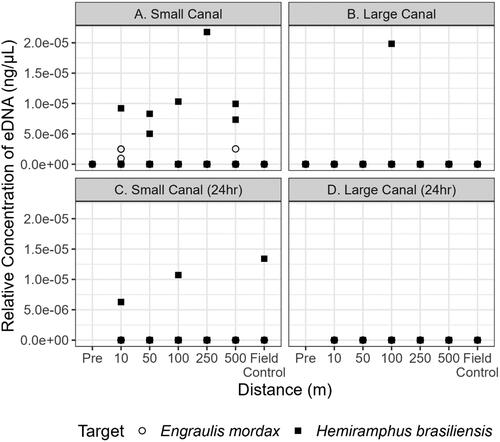
Figure 4. Quantitative PCR detections of P. dabryanus/M. mizolepis within the small and large canal during initial sampling (a and b, respectively) and 24h later within the small and large canal (c and d, respectively). Each point above 0 ng·μL−1 indicates that target eDNA was detected and represents a positive technical replicate.
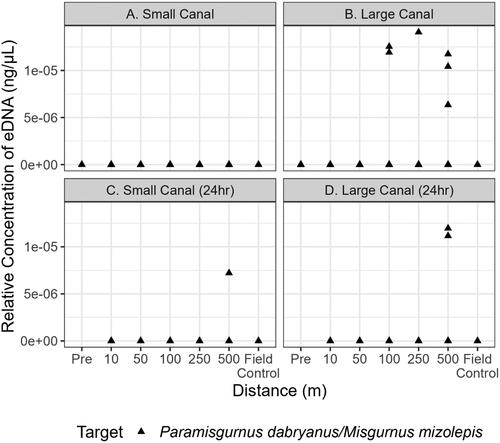
Figure 5. Artemis model output of the estimated effect size of target and distance on ln[eDNA] at the small canal location (Cq ∼ distance + target + (1|FilterID).
![Figure 5. Artemis model output of the estimated effect size of target and distance on ln[eDNA] at the small canal location (Cq ∼ distance + target + (1|FilterID).](/cms/asset/6e0b1acc-79dc-4811-9c1a-a508d865374f/tjfe_a_2378841_f0005_b.jpg)
Figure 6. Probability of detecting a small biomass (circle) and large biomass (square) in the small canal if it is present using the effect sizes of each variable as calculated by the model with three filter replicates. Points indicate mean probability of detection and bars indicate the 95% confidence intervals of that estimate.
For large canals, we estimated that we could detect a larger biomass of a target 100–250 m downstream from an eDNA site. This assumption was based on the single detection at 100 m and the predicted increase in the water quality and, therefore, filtration capacity and PoD during the drier spring/summer removal phase. For smaller canals, our maximum detection range likely exceeded 500 m. However, the strongest detections were observed at 250 m from the source. To maximize trap density near a given positive eDNA site, we chose to select a trapping range of 250 m in large and small canals plus an additional 10 m above that range to capitalize on loaches that may have been located at the edge of the boundary.
Table 6. The 2023 field effort for the main study.
Targeted trapping
A total of 250 of the 300 randomly generated canal sites were sampled for loach eDNA, with 139 (56%) of those sites testing positive for loaches using the PD_MM assay (). Overall, 77 of the 139 eDNA-positive sites were trapped (55%) (). A total of 658 loaches were caught at 68 of the 77 trapped canal sites in 2023 during 18897.4 trapping hours (). Loaches caught during the main study ranged in size from 69–182 mm TL; however, TLs increased over successive weeks of trapping (). A linear model indicated differences in TL for each group (p < 0.001).
Catch models
Traps were much more likely to catch loaches when eDNA results guided their placement. The best models for mean catch (i.e. the models with the lowest AIC values) were the truncated Poisson model for the pilot study and the truncated negative binomial model for the main eDNA study (). Model diagnostics indicated adequate fit for the catch models for both studies, but DHARMa residual tests (Hartig Citation2022) suggested that adding covariates to the model for the eDNA study could improve the predicted catch. Expected catch per trap per day was lower for the pilot study than for the main study (). At sites with single traps set randomly, catching zero loaches was about six times more likely than at sites where ten traps were placed using eDNA guidance derived from random sampling. In the pilot study, the modeled probability of catching zero loaches in 24 h was 85.9% (95% CI: 75.1%-92.5%). In contrast, during the main study, the probability of catching zero loaches in 24 h was only 13.6% (95% CI: 6.3%-27.2%). There was a clear decrease in the expected catch of loaches per day when priority was no longer given to those sites with the highest eDNA concentration ().
Figure 7. Expected mean catch per minnow trap per day (24 h or 1440 min), as predicted by the best models for each study, considering both the count and zero portions of the hurdle models. Error bars indicate the 95% confidence intervals.
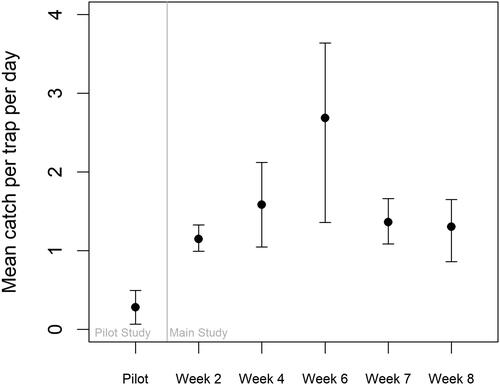
Table 7. Comparison of models for mean catch in the pilot study and the eDNA study.
Discussion
Our study demonstrates the effectiveness of an invasive species eradication plan in which removal efforts leverage a calibrated eDNA methodology where real-time, spatially specific eDNA concentrations guide the subsequent trapping effort. In addition, the initial calibration of site-specific eDNA concentrations to determine the distance upstream in which traps are placed maximizes the probability of catching and removing the source of the observed eDNA, i.e. the species targeted for removal. Our results indicate that it may be advantageous to eliminate the effort spent trapping in areas where target fish species eDNA was not present or was present in relatively low concentrations to instead focus the time- and labor-intensive trapping removal efforts on sites with relatively high eDNA concentrations.
This study also highlights the importance of gathering preliminary data through pilot studies prior to launching larger-scaled efforts. This is especially important, and often recommended, for eDNA focused studies where detection probability may vary by target species, season, space, and study area (Harrison et al. Citation2019; Ruppert et al. Citation2019). The 2022 pilot study provided baseline information for our study area regarding how to catch loaches and the minimum number of minnow traps needed to reduce detection error. Active sampling methods such as electrofishing and gill netting (Dumitraşcu and Mitrea Citation2012; Hinlo et al. Citation2018; Denys and Manné Citation2024) have been used to collect loaches, but were not employed here. Minnow traps have been used in other studies to catch loaches (Urquhart Citation2013; Belcik Citation2017) and we do not feel our use of them was a limitation as Belcik (Citation2017) showed that passive gear (minnow traps) outperformed active gear (backpack electrofishing and boat-mounted electroshocker) in catching loaches. Our pilot study results indicated that loaches were in canals, but not ponds on the refuge. This information was critical in designing the main study because we were able to focus our removal efforts in canals rather than wasting time and resources visiting ponds. Furthermore, we used the pilot study to develop the eDNA assay used in the main study. To our knowledge there is no universal eDNA method that can be applied to all species, study areas, or conditions; thus we recommend that those interested in similar sample designs conduct their own pilot studies to ensure optimal efficiency and effectiveness for their intended research purpose.
DNA sequencing and assay development
The DNA sequence comparison of the California Central Valley loaches to the genetic data available in NCBI revealed a high level of intra-species genetic variation in the COI, cytb and 12S mitochondrial regions for the three species globally. The high level of global genetic variability and/or the cryptic physical characteristics of these species resulted in inconclusive NCBI BLAST + comparisons for the cytb and 12S regions. We, therefore, selected the COI region as the most diagnostic region for species ID and assay design. However, the specimens captured in the Sacramento San-Joaquin watershed had little genetic variation within species. All specimens identified as P. dabryanus were 100% identical to one another, while M. anguillicaudatus samples exhibited some variation, resulting in 99.99–100% intra-specific sequence similarity at all sequenced regions. The lack of genetic variability observed within the California Central Valley loaches could indicate a limited introduction event, though our small sample size limits our ability to draw this conclusion. At the COI region, M. mizolepis and P. dabryanus sequences were most similar to one another, with 96.18% sequence similarity. Due to the genetic similarity of P. dabryanus and M. mizolepis (Kim et al. Citation2022), a suitable species-specific priming site could not be found, which resulted in the development of an assay that targeted both species with equal specificity. Since this study focused on species removal and not species identification, we determined that an assay that targeted both species with equal specificity was justified. Misgurnus anguillicaudatus sequences shared 83.08% and 93.53% identity with P. dabryanus and M. mizolepis, respectively. This level of variation was sufficient to design a species-specific assay for M. anguillicaudatus. The successful development and application of these qPCR assays will be a beneficial tool for future early identification of loaches in California Central Valley watersheds.
Calibration of eDNA dispersion and attenuation rates
The detection of eDNA can be highly varied and influenced by the (1) the physical characteristics of a given sampling location in lotic systems (Shogren et al. Citation2017; Harrison et al. Citation2019; Chipuriro et al. Citation2022), (2) behavior of DNA particles like decay, transport, adhesion, deposition, and resuspension (Sepulveda et al. Citation2021), and (3) unfavorable sampling conditions like high turbidity and low sampling volumes (Schumer et al. Citation2019). The purpose of the calibration study was to (1) determine the downstream detection range of eDNA to inform where traps should be placed in relation to eDNA sampling sites, and (2) determine if eDNA signal persists 24 h after the eDNA source is removed. Overall, there were more eDNA detections of the proxy fish in the small canal than in the large canal. This result was expected given that the large canal had a higher discharge, likely leading to a stronger dilution effect of the eDNA signal (Curtis et al. Citation2021). An unexpected characteristic of the large canal was the high turbidity level present at that site during sampling. California experienced an unusually wet winter during the dispersion study which caused turbidity to spike and resulted in the large canal having turbidity levels that were three times higher than those observed in the small canal. The turbid conditions greatly limited our eDNA sample filtration capacity and likely reduced our probability of detection to levels below the limit of detection, a correlation observed in previous studies (Cantera et al. Citation2019; Sepulveda et al. Citation2019). The single sporadic detection of H. brasiliensis at 100 m may be explained by the eDNA plume dispersion phenomenon described by Wood et al. (Citation2020), who predicted that larger cellular particles are polydispersed closer to the DNA source until reaching a ‘breakout phase’ at some intermediate distance during which molecules are broken down into smaller components and distributed with more lateral uniformity. In the large canal, the 100 m location was likely the distance at which lateral uniformity was highest, thus increasing the chance of detecting the target in extremely unfavorable conditions. Due to the lack of data, we could not model the data collected in the large canal. Conversely, the small canal was successfully modeled, and the PoD calculation revealed a non-significant effect of distance and a strong positive effect of biomass on the concentration of eDNA. The negligible effect of distance on eDNA concentration was unexpected since previous dispersion studies in similarly sized streams have found that eDNA signal typically declines with distance from the source (Jane et al. Citation2015; Nevers et al. Citation2020; Wood et al. Citation2020). However, it is likely that (1) the physical characteristics of the small canal allow for eDNA transport to occur across larger distances, and (2) we would have observed this trend had we sampled at distances greater than 500 m. The positive effect of the larger biomass on eDNA concentrations was apparent in both the qPCR data and the PoD calculation. This result indicates that larger groups of organisms will be easier to detect, a finding that is supported in the literature (Klymus et al. Citation2015; Karlsson et al. Citation2022). Unfortunately, due to contamination, we were unable to assess if the eDNA signal would be detectable 24 h after the eDNA source was removed. However, previous decay rate studies in lotic systems have found that eDNA decays to undetectable levels within several days or less post-removal (Pilliod et al. Citation2014; Jane et al. Citation2015; Seymour et al. Citation2018), indicating that it is unlikely that eDNA from removed loaches would persist in the system during a subsequent sampling event. This relatively fast decay rate appears to be more pronounced in sessile species such as loaches, as described by Hinlo et al. (Citation2018), who determined that eDNA from M. anguillicaudatus was undetectable in small lotic streams 4 h post-removal.
Our selection of the 250 m detection and trapping range was informed by a combination of the raw data and the modeling exercises, and was a conservative estimate of the downstream eDNA signal range calculated based on two limited biomass conditions. This range may not represent the actual detection range under all conditions since the detection range is likely to vary based on biotic (e.g. loach abundance) and abiotic (e.g. turbidity, canal volume) factors. This estimate is further confounded by the fact that freshly euthanized frozen fish were deployed during the calibration study and may not be a perfect proxy for live loaches. Nevertheless, the results of this study were an informative starting point to guide a successful eDNA-led trapping effort in a system with no previous eDNA dispersion data.
Method comparison
In the pilot study, we found that eDNA-based detection techniques and conventional trapping methods agreed 79% of the time. It is important to note that the cases for which the two detection methods disagreed (22%) consisted entirely of sites where eDNA indicated that fish were present but not captured by minnow traps. However, the false omission rate was calculated for a single minnow trap, and it can be reduced to nearly zero by incorporating three or more replicate traps into the study design. The high positive predictive value gives us confidence that positive detections with eDNA indicated that loaches were present near the sampling site.
The increased sensitivity of eDNA as a tool for aquatic species detection compared to traditional methods has also been observed in other studies. For instance, Dubreuil et al. (Citation2022) used similar techniques (qPCR and minnow trapping) to detect and capture a newly introduced AIS (Armored Catfish, Hypostomus robinii). They found that, when compared to trapping, qPCR was more sensitive at detecting the presence of armored catfish in newly occupied streams, with traps capturing the target at only 77% of positive eDNA sites and no instances of sites being positive with trapping only. Hinlo et al. (Citation2018) applied electrofishing, fyke netting, and eDNA to detect M. anguillicaudatus, and similarly highlighted the benefits of adding eDNA to increase sensitivity and compliment traditional detection methods, particularly when trying to elucidate the presence of elusive benthic species in lotic systems. Wilcox et al. (Citation2016) highlighted the sensitivity of eDNA in their eDNA detection study, which found that the probability of detection for Salvelinus fontinalis (Brook Trout), at densities of one fish per stream km was estimated at 0.18 and was greater than 0.99 for densities of fish at a population level (≥3 fish/100 m). The recognition of the power of eDNA as a management tool has led to the global application of this tool for the early detection of AIS, including fish (Wozney and Wilson Citation2017; Dubreuil et al. Citation2022), bivalves (Feist and Lance Citation2021), amphibians (Everts et al. Citation2021), and invertebrates (LeBlanc et al. Citation2020; Coster et al. Citation2021).
Conventional trapping using eDNA-guided methods removed more fish than the random trapping methods used in the pilot study, both in total and when adjusting for trapping effort. If we assume that the population of loaches in the sampling area is stable, eDNA-guided sampling appears to be much more effective than random sampling. If, however, the loach population was not stable, the higher catch per unit effort (CPUE) for eDNA-guided trapping could result from an increasing loach population. If the difference in CPUE was solely based on an increasing population, our results suggest an increase of roughly 4.2–9.9 times the population size from one year to the next, depending on the trapping week of the main study. Little information is available about population growth rates for P. dabryanus, particularly outside of their native range; however, a study on Cobitis taenia (Spined Loach) found annual changes in density as high as a 50% increase (Nunn et al. Citation2014). Another factor that might have contributed to larger CPUE values for the main study was a potential change in the size of loaches that were available to be sampled by the minnow traps. One study found that minnow trap capture probability peaked for fish between 35 and 59 mm in length, with capture probabilities being lower for fish below 35 mm than for fish larger than 59 mm (Peterson et al. Citation2015). Another study with madtoms (Noturus spp.) of similar size to the loaches captured in our study found that minnow traps showed a bias toward capturing larger individuals than other sampling methods (Wagner et al. Citation2019). Our results indicated that the length of loaches increased by nearly 50% over the 11-week span of the main study and that the pilot study caught smaller loaches overall. Loaches are known to grow quickly, and this increase in length is within the bounds of growth rates reported in feeding studies of M. anguillicaudatus (Wang et al. Citation2009). Based on the median size of loaches we caught and estimates of capture efficiency from Wagner et al. (Citation2019), retention of loaches in the pilot study was roughly 40%, but for the main study retention would range from about 75% to 100%. This suggests that the seasonal timing of trapping may be an important part of strategic planning to maximize impact on populations for loach eradication. While trapping efforts appear to be more effective for larger loaches, this must be balanced against the consideration that larger loaches are more fecund (Chu et al. Citation2012); waiting to trap loaches until they reach a size with total retention in traps may come at the expense of increased reproduction.
Management implications and future studies
The most economical control for invasive species is to prevent introduction and establishment. However, once a species becomes problematic, managers need effective strategies to detect and remove it. Managers need to decide how to allocate limited resources between gathering information about an invasive species (including surveillance) and actions to remove or control the species (Lodge et al. Citation2016). We chose to only employ minnow traps to remove loaches due to logistical and feasibility that precluded the use of other removal techniques. Given the growing unpopularity of piscicide use, especially on wildlife refuges where species of management concern can potentially be harmed, and the unique biology of loaches (e.g. capable of burrowing into substrates, capable of air breathing), careful thought by refuge managers must occur before any chemical treatment and(or) environmental modification actions (e.g. channel dewatering) are taken to completely remove loach from the area.
The steps we took in this study maximize the use of the information gathering phase by explicitly linking it to eradication planning. Our study used near real-time information to generate maps of hotspots for invasive loaches (see Supplementary Information). Mapping creates a visual pattern that can be used to prioritize and coordinate eradication efforts in a way that simple numerical results cannot. For example, this approach can be used to obtain high spatial-resolution data on the distribution of AIS, patch sizes, and patch geometry, which are important factors for determining optimal eradication strategies (Eppinga et al. Citation2021). Another benefit to this approach is that, once an assay has been developed and calibrated, it can be used to assess when eradication efforts have been successful; if unsuccessful, the results can help prioritize and direct efforts towards areas that require additional attention (Davison et al. Citation2017). Similar approaches to incorporating eDNA surveillance into eradication plans have been used for other aquatic species including Xenostrobus securis (Pygmy Mussel; Miralles et al. Citation2016) and Python bivittatus (Burmese Python; Hunter et al. Citation2019).
The techniques outlined in this paper can be utilized for other AIS to enhance ecosystem management by improving species detection, increasing expected catch per trap, and maximizing removal efforts through the placement of multiple traps at eDNA-positive sites. Future studies incorporating these methods into management plans should consider key components such as the ecology of the target species and whether the system is closed or open. For example, we understand that the time between eDNA collection/processing and trapping (approximately one week) may be too long for some species as the likelihood of capturing a highly mobile species in an open system one week after eDNA detection is less likely. This situation was not a concern in our study since the three target species likely exhibit strong site fidelity similar to Misgurnus fossilis (Meyer and Hinrichs Citation2000). Furthermore, the present study was also conducted in an enclosed system. Future studies should therefore focus on investigating the utility of eDNA guided removal efforts and rapid field-based qPCR approaches to target highly mobile species in open lotic systems.
Supplemental Material
Download MS Word (954.8 KB)Acknowledgements
The authors thank the San Luis National Wildlife Refuge staff, specifically Fumika Takahashi, Brandon Jordan, and Sean Brophy for their coordination efforts and providing access to their facilities and equipment. We also thank Genidaqs Laboratory staff for their flexibility and coordination with regards to the shipment and processing of samples. Many thanks to Gershom Bigham, Matthew Murphy, and John ‘Breck’ Wainwright for their field work assistance as well as Adriana Arrambide for her assistance with data analysis. A huge thank you to Christopher Hart for his diligence in recording all loach encounters throughout the CA Delta, his work on the AIS grants to get this study funded, and for his enthusiasm for all things loach related. Finally, we thank the two anonymous reviewers for their suggestions on how to improve an earlier draft of this paper. The findings and conclusions in this article are those of the authors and do not necessarily reflect the views of the US Fish and Wildlife Service.
Disclosure statement
The authors declare that they have no known competing financial or non-financial conflicts of interest to report.
Data availability statement
All data that supports the findings of this study are available in Dryad at https://doi.org/10.5061/dryad.n8pk0p342. Statistical code is available at https://github.com/USFWS/LFWO-Loach-eDNA.
Additional information
Funding
References
- Belcik JT. 2017. Population genetics and distribution of the oriental weatherfish, Misgurnus anguillicaudatus, in Chicago Area Waterways [master’s thesis]. Chicago, Illinois: Loyola University Chicago.
- Belle CC, Stoeckle BC, Geist J. 2019. Taxonomic and geographical representation of freshwater environmental DNA research in aquatic conservation. Aquatic Conserv. 29(11):1996–2009. doi: 10.1002/aqc.3208.
- Bowen L, Waters S, Rankin L, Thorne K, Gille D, De La Cruz S, Woo I, Lewis L, Karpenko K, Dean C, et al. 2024. A comparison of eDNA sampling methods in an estuarine environment on presence of longfin smelt (Spirinchus thaleichthys) and fish community composition. Environ DNA. 6(3):e560. doi: 10.1002/edn3.560.
- Britton JR, Pegg J, Gozlan RE. 2011. Quantifying imperfect detection in an invasive pest fish and the implications for conservation management. Biol Conserv. 144(9):2177–2181. doi: 10.1016/j.biocon.2011.05.008.
- Brooks ME, Kristensen K, Benthem KJv, Magnusson A, Berg CW, Nielsen A, Skaug HJ, Mächler M, Bolker BM. 2017. glmmTMB balances speed and flexibility among packages for zero-inflated generalized linear mixed modeling. R J. 9(2):378–400. doi: 10.3929/ethz-b-000240890.
- Bustin SA, Benes V, Garson JA, Hellemans J, Huggett J, Kubista M, Mueller R, Nolan T, Pfaffl MW, Shipley GL, et al. 2009. The MIQE guidelines: minimum information for publication of quantitative real-time PCR experiments. Clin Chem. 55(4):611–622. doi: 10.1373/clinchem.2008.112797.
- Camacho C, Coulouris G, Avagyan V, Ma N, Papadopoulos J, Bealer K, Madden TL. 2009. BLAST+: architecture and applications. BMC Bioinf. 10(1):421. doi: 10.1186/1471-2105-10-421.
- Cantera I, Cilleros K, Valentini A, Cerdan A, Dejean T, Iribar A, Taberlet P, Vigouroux R, Brosse S. 2019. Optimizing environmental DNA sampling effort for fish inventories in tropical streams and rivers. Sci Rep. 9(1):3085. doi: 10.1038/s41598-019-39399-5.
- Canty A, Ripley B. 2022. boot: bootstrap R (S-Plus) functions. R Package Version 1.3-28.1.
- Carim KJ, Bean NJ, Connor JM, Baker WP, Jaeger M, Ruggles MP, McKelvey KS, Franklin TW, Young MK, Schwartz MK. 2020. Environmental DNA sampling informs fish eradication efforts: case studies and lessons learned. N American J Fish Manag. 40(2):488–508. doi: 10.1002/nafm.10428.
- Chipuriro J, Faiq M, Li Z, Chen G. 2022. Persistence and degradation dynamics of eDNA affected by environmental factors in aquatic ecosystems. Hydrobiologia. 849(19):4119–4133. doi: 10.1007/s10750-022-04959-w.
- Chou HY, Lo CF, Tung MC, Wang CH, Fukuda H, Sano T. 1993. The general characteristics of a birnavirus isolated from cultured loach (Misgurnus anguillicaudatus) in Taiwan. Fish Pathol. 28(1):1–7. doi: 10.3147/jsfp.28.1.
- Chu Z, Lu G, Hu T, Wang H, Dai L, Huang W. 2012. Comparative analysis on fecundity of Misgurnus anguillicaudatus and Paramisgurnus dabryanus. Hubei Agri Sci. 13:2794–2796.
- Coster SS, Dillon MN, Moore W, Merovich GT.Jr 2021. The update and optimization of an eDNA assay to detect the invasive rusty crayfish (Faxonius rusticus). PLoS One. 16(10):e0259084. doi: 10.1371/journal.pone.0259084.
- Curtis AN, Tiemann JS, Douglass SA, Davis MA, Larson ER. 2021. High stream flows dilute environmental DNA (eDNA) concentrations and reduce detectability. Divers Distrib. 27(10):1918–1931. doi: 10.1111/ddi.13196.
- Davison PI, Copp GH, Créach V, Vilizzi L, Britton JR. 2017. Application of environmental DNA analysis to inform invasive fish eradication operations. Naturwissenschaften. 104(3–4):35. doi: 10.1007/s00114-017-1453-9.
- Davison AC, Hinkley DV. 1997. Bootstrap methods and their applications. Cambridge (US): Cambridge University Press.
- Dejean T, Valentini A, Miquel C, Taberlet P, Bellemain E, Miaud C. 2012. Improved detection of an alien invasive species through environmental DNA barcoding: the example of the American bullfrog Lithobates catesbeianus. J Appl Ecol. 49(4):953–959. doi: 10.1111/j.1365-2664.2012.02171.x.
- Denys GPJ, Manné S. 2024. First record of an established population of Misgurnus anguillicaudatus (Cantor, 1842) (Teleostei, Cobitidae) in France. BioInvasions Records. 13(2):529–540. doi: 10.3391/bir.2024.13.2.17.
- DeWitt P. 2021. qwraps2: quick Wraps 2. R package version 0.5.2. https://CRAN.R-project.org/package=qwraps2.
- Dubreuil T, Baudry T, Mauvisseau Q, Arqué A, Courty C, Delaunay C, Sweet M, Grandjean F. 2022. The development of early monitoring tools to detect aquatic invasive species: eDNA assay development and the case of the armored catfish Hypostomus robinii. Environ DNA. 4(2):349–362. doi: 10.1002/edn3.260.
- Dudgeon D, Arthington AH, Gessner MO, Kawabata ZI, Knowler DJ, Lévêque C, Naiman RJ, Prieur-Richard AH, Soto D, Stiassny MLJ, et al. 2006. Freshwater biodiversity: importance, threats, status and conservation challenges. Biol Rev Camb Philos Soc. 81(2):163–182. doi: 10.1017/S1464793105006950.
- Dumitraşcu OC, Mitrea I. 2012. Data upon the ichthyofauna of three reservoirs from Jiu River, Romania. South Western J Horticul Biol Environ. 3(1):1–8.
- Epanchin-Niell RS. 2017. Economics of invasive species policy and management. Biol Invasions. 19(11):3333–3354. doi: 10.1007/s10530-017-1406-4.
- Epanchin-Niell LR, Liebhold AM. 2015. Benefits of invasion prevention: effect of time lags, spread rates, and damage persistence. Ecol Econ. 116:146–153. doi: 10.1016/j.ecolecon.2015.04.014.
- Eppinga MB, Baudena M, Haber EA, Rietkerk M, Wassen MJ, Santos MJ. 2021. Spatially explicit removal strategies increase the efficiency of invasive plant species control. Ecol Appl. 31(3):e02257. doi: 10.1002/eap.2257.
- Espe MB, Johnston M, Blankenship SM, Dean CA, Bowen MD, Schultz A, Schumer G. 2022. The artemis package for environmental DNA analysis in R. Environ DNA. 4(3):523–532. doi: 10.1002/edn3.277.
- Everts T, Halfmaerten D, Neyrinck S, De Regge N, Jacquemyn H, Brys R. 2021. Accurate detection and quantification of seasonal abundance of American bullfrog (Lithobates catesbeianus) using ddPCR eDNA assays. Sci Rep. 11(1):11282. doi: 10.1038/s41598-021-90771-w.
- Executive Office of the President. 2016. Executive Order 13751, 81 FR 88609–88614.
- Feist SM, Lance RF. 2021. Advanced molecular-based surveillance of quagga and zebra mussels: a review of environmental DNA/RNA (eDNA/eRNA) studies and considerations for future directions. NB. 66:117–159. doi: 10.3897/neobiota.66.60751.
- Gu W, Swihart RK. 2004. Absent or undetected? Effects of non-detection of species occurrence on wildlife–habitat models. Biol Conserv. 116(2):195–203. doi: 10.1016/S0006-3207(03)00190-3.
- Harrison JB, Sunday JM, Rogers SM. 2019. Predicting the fate of eDNA in the environment and implications for studying biodiversity. Proc R Soc B. 286(1915):20191409. doi: 10.1098/rspb.2019.1409.
- Hart CL. 2024. Email to A. C. Goodman regarding observations of loach consuming juvenile salmonids in captivity at the US Bureau of Reclamation’s Tracy Fish Collection Facility (Tracy, CA, USA).
- Hartig F. 2022. DHARMa: residual diagnostics for hierarchical (multi-level/mixed) regression models. R package version 0.4.6. https://CRAN.R-project.org/package=DHARMa.
- Hinlo R, Furlan E, Suitor L, Gleeson D. 2017. Environmental DNA monitoring and management of invasive fish: comparison of eDNA and fyke netting. MBI. 8(1):89–100. doi: 10.3391/mbi.2017.8.1.09.
- Hinlo R, Lintermans M, Gleeson D, Broadhurst B, Furlan E. 2018. Performance of eDNA assays to detect and quantify an elusive benthic fish in upland streams. Biol Invasions. 20(11):3079–3093. doi: 10.1007/s10530-018-1760-x.
- Hinlo MRP. 2018. Improving eDNA detection probabilities for monitoring aquatic species [doctoral dissertation]. University of Canberra.
- Hulme PE. 2006. Beyond control: wider implications for the management of biological invasions. J Appl Ecol. 43(5):835–847. doi: 10.1111/j.1365-2664.2006.01227.x.
- Hunter ME, Meigs-Friend G, Ferrante JA, Smith BJ, Hart KM. 2019. Efficacy of eDNA as an early detection indicator for Burmese pythons in the ARM Loxahatchee National Wildlife Refuge in the greater Everglades ecosystem. Ecol Indic. 102:617–622. doi: 10.1016/j.ecolind.2019.02.058.
- Ivanova NV, Zemlak TS, Hanner RH, Hebert PDN. 2007. Universal primer cocktails for fish DNA barcoding. Mol Ecol Notes. 7(4):544–548. doi: 10.1111/j.1471-8286.2007.01748.x.
- Jane SF, Wilcox TM, McKelvey KS, Young MK, Schwartz MK, Lowe WH, Letcher BH, Whiteley AR. 2015. Distance, flow and PCR inhibition: E DNA dynamics in two headwater streams. Mol Ecol Resour. 15(1):216–227. doi: 10.1111/1755-0998.12285.
- Jeffres CA, Opperman JJ, Moyle PB. 2008. Ephemeral floodplain habitats provide best growth conditions for juvenile Chinook salmon in a California river. Environ Biol Fish. 83(4):449–458. doi: 10.1007/s10641-008-9367-1.
- Kanou K, Saito S, Fuchigami S, Imamura A, Imai H, Taki Y. 2007. Occurrence patterns and food habits of introduced alien loach Paramisgurnus dabryanus and native loach Misgurnus anguillicaudatus at irrigation drainages around rice fields in the Watarase River system, central Honshu, Japan. Aquacult Sci. 55(1):109–114.
- Karlsson E, Ogonowski M, Sundblad G, Sundin J, Svensson O, Nousiainen I, Vasemägi A. 2022. Strong positive relationships between eDNA concentrations and biomass in juvenile and adult pike (Esox lucius) under controlled conditions: implications for monitoring. Environ DNA. 4(4):881–893. doi: 10.1002/edn3.298.
- Katz JV, Jeffres C, Conrad JL, Sommer TR, Martinez J, Brumbaugh S, Corline N, Moyle PB. 2017. Floodplain farm fields provide novel rearing habitat for Chinook salmon. PLoS One. 12(6):e0177409. doi: 10.1371/journal.pone.0177409.
- Katz J, Moyle PB, Quiñones RM, Israel J, Purdy S. 2013. Impending extinction of salmon, steelhead, and trout (Salmonidae) in California. Environ Biol Fish. 96(10–11):1169–1186. doi: 10.1007/s10641-012-9974-8.
- Kim EM, Dong CM, Lee MN, Noh JK, Noh ES, Nam BH, Kim YO, Jung HS. 2022. Development of multiplex species-specific PCR for the simultaneous identification of three closely related species in the genera Misgurnus and Paramisgurnus. Aquacult Rep. 24:101144. doi: 10.1016/j.aqrep.2022.101144.
- Kirsch JE, Feeney RF, Goodbla A, Hart C, Jackson ZJ, Schreier A, Smith R. 2018. The first record of the large-scale loach Paramisgurnus dabryanus (Cobitidae) in the United States. J Fish Wildlife Manage. 9(1):246–254. doi: 10.3996/012017-JFWM-008.
- Klymus KE, Merkes CM, Allison MJ, Goldberg CS, Helbing CC, Hunter ME, Jackson CA, Lance RF, Mangan AM, Monroe EM, et al. 2020. Reporting the limits of detection and quantification for environmental DNA assays. Environ DNA. 2(3):271–282. doi: 10.1002/edn3.29.
- Klymus KE, Richter CA, Chapman DC, Paukert C. 2015. Quantification of eDNA shedding rates from invasive bighead carp Hypophthalmichthys nobilis and silver carp Hypophthalmichthys molitrix. Biol Conserv. 183:77–84. doi: 10.1016/j.biocon.2014.11.020.
- Kocher TD, Thomas WK, Meyer A, Edwards SV, Pääbo S, Villablanca FX, Wilson AC. 1989. Dynamics of mitochondrial DNA evolution in animals: amplification and sequencing with conserved primers. Proc Natl Acad Sci USA. 86(16):6196–6200. doi: 10.1073/pnas.86.16.6196.
- LeBlanc F, Belliveau V, Watson E, Coomber C, Simard N, DiBacco C, Bernier R, Gagné N. 2020. Environmental DNA (eDNA) detection of marine aquatic invasive species (AIS) in Eastern Canada using a targeted species-specific qPCR approach. MBI. 11(2):201–217. doi: 10.3391/mbi.2020.11.2.03.
- Lodge DM, Simonin PW, Burgiel SW, Keller RP, Bossenbroek JM, Jerde CL, Kramer AM, Rutherford ES, Barnes MA, Wittmann ME, et al. 2016. Risk analysis and bioeconomics of invasive species to inform policy and management. Annu Rev Environ Resour. 41(1):453–488. doi: 10.1146/annurev-environ-110615-085532.
- Lodge DM, Williams S, MacIsaac HJ, Hayes KR, Leung B, Reichard S, Mack RN, Moyle P, Smith M, Andow DA, et al. 2006. Biological invasions: recommendations for US policy and management. Ecol Appl. 16(6):2035–2054. doi: 10.1890/1051-0761(2006)016[2035:BIRFUP]2.0.CO;2.
- Logan DJ, Bibles EL, Markle DF. 1996. Recent collections of the exotic aquarium fishes in the freshwaters of Oregon and the thermal tolerance of oriental weatherfish and pirapatinga. California Fish Game. 82(2):66–80.
- Mack RN, Simberloff D, Mark Lonsdale W, Evans H, Clout M, Bazzaz FA. 2000. Biotic invasions: causes, epidemiology, global consequences, and control. Ecol Appl. 10(3):689–710. doi: 10.1890/1051-0761(2000)010[0689:BICEGC]2.0.CO;2.
- Martinez B, Reaser JK, Dehgan A, Zamft B, Baisch D, McCormick C, Giordano AJ, Aicher R, Selbe S. 2020. Technology innovation: advancing capacities for the early detection of and rapid response to invasive species. Biol Invasions. 22(1):75–100. doi: 10.1007/s10530-019-02146-y.
- Mehta SV, Haight RG, Homans FR, Polasky S, Venette RC. 2007. Optimal detection and control strategies for invasive species management. Ecol Econ. 61(2–3):237–245. doi: 10.1016/j.ecolecon.2006.10.024.
- Meyer L, Hinrichs D. 2000. Microhabitat preferences and movements of the weatherfish, Misgurnus fossilis, in a drainage channel. Environ Biol Fishes. 58(3):297–306. doi: 10.1023/A:1007681313916.
- Meyerson LA, Mooney HA. 2007. Invasive alien species in an era of globalization. Front Ecol Environ. 5(4):199–208. doi: 10.1890/1540-9295(2007)5[199:IASIAE]2.0.CO;2.
- Miralles L, Dopico E, Devlo-Delva F, Garcia-Vazquez E. 2016. Controlling populations of invasive pygmy mussel (Xenostrobus securis) through citizen science and environmental DNA. Mar Pollut Bull. 110(1):127–132. doi: 10.1016/j.marpolbul.2016.06.072.
- Miya M, Minamoto T, Yamanaka H, Oka S-I, Sato K, Yamamoto S, Sado T, Doi H. 2016. Use of a filter cartridge for filtration of water samples and extraction of environmental DNA. J Vis Exp. 117(117):1–8. doi: 10.3791/54741.
- Miya M, Sato Y, Fukunaga T, Sado T, Poulsen JY, Sato K, Minamoto T, Yamamoto S, Yamanaka H, Araki H, et al. 2015. MiFish, a set of universal PCR primers for metabarcoding environmental DNA from fishes: detection of more than 230 subtropical marine species. R Soc Open Sci. 2(7):150088. doi: 10.1098/rsos.150088.
- Mooney HA, Drake JA. 1987. The ecology of: biological invasions. Environment: science and Policy for Sustainable Development. 29(5):10–37. doi: 10.1080/00139157.1987.9928888.
- National Invasive Species Council (NISC). 2016. 2016-2018 NISC Management Plan. Washington.
- Nevers MB, Przybyla-Kelly K, Shively D, Morris CC, Dickey J, Byappanahalli MN. 2020. Influence of sediment and stream transport on detecting a source of environmental DNA. PLoS One. 15(12):e0244086. doi: 10.1371/journal.pone.0244086.
- Nunn AD, Tewson LH, Bolland JD, Harvey JP, Cowx IG. 2014. Temporal and spatial variations in the abundance and population structure of the spined loach (Cobitis taenia), a scarce fish species: implications for condition assessment and conservation. Aquatic Conservation. 24(6):818–830. doi: 10.1002/aqc.2451.
- Ogutu-Ohwayo R, Hecky RE. 1991. Fish introductions in Africa and some of their implications. Can J Fish Aquat Sci. 48(S1):8–12. doi: 10.1139/f91-299.
- Oh MK, Park JY. 2011. Change of skin mucus cells related to aerial exposure of Misgurnus mizolepis (Cobitidae) dwelling in a rice field. Korean J Ichthyol. 23(1):70–74.
- Park JY, Kim IS. 2001. Histology and mucin histochemistry of the gastrointestinal tract of the mud loach, in relation to respiration. J Fish Biol. 58(3):861–872. doi: 10.1111/j.1095-8649.2001.tb00536.x.
- Parson W, Pegoraro K, Niederstätter H, Föger M, Steinlechner M. 2000. Species identification by means of the cytochrome b gene. Int J Legal Med. 114(1–2):23–28. doi: 10.1007/s004140000134.
- Pebesma E. 2018. Simple features for R: standardized support for spatial vector data. R J. 10(1):439–446. doi: 10.32614/RJ-2018-009.
- Peterson JT, Scheerer PD, Clements S. 2015. An evaluation of the efficiency of minnow traps for estimating the abundance of minnows in desert spring systems. N Am J Fish Manag. 35(3):491–502. doi: 10.1080/02755947.2015.1017125.
- Pilliod DS, Goldberg CS, Arkle RS, Waits LP. 2014. Factors influencing detection of eDNA from a stream-dwelling amphibian. Mol Ecol Resour. 14(1):109–116. doi: 10.1111/1755-0998.12159.
- Pimentel D. 2007. Environmental and economic costs of vertebrate species invasions into the United States. Manag Vertebrate Inv Species Proc Int Symp. 38:2–8.
- Pimentel D, Zuniga R, Morrison D. 2005. Update on the environmental and economic costs associated with alien-invasive species in the United States. Ecol Econ. 52(3):273–288. doi: 10.1016/j.ecolecon.2004.10.002.
- Przybyla-Kelly KJ, Spoljaric AM, Nevers MB. 2023. Round goby detection in Lakes Huron and Michigan—an evaluation of eDNA and fish catches. Fishes. 8(1):41. doi: 10.3390/fishes8010041.
- Pukk L, Kanefsky J, Heathman AL, Weise EM, Nathan LR, Herbst SJ, Sard NM, Scribner KT, Robinson JD. 2021. eDNA metabarcoding in lakes to quantify influences of landscape features and human activity on aquatic invasive species prevalence and fish community diversity. Divers Distrib. 27(10):2016–2031. doi: 10.1111/ddi.13370.
- Pyrzanowski K, Zięba G, Dukowska M, Smith C, Przybylski M. 2019. The role of detritivory as a feeding tactic in a harsh environment–a case study of weatherfish (Misgurnus fossilis). Sci Rep. 9(1):8467. doi: 10.1038/s41598-019-44911-y.
- Reaser JK, Waugh J. 2007. Denying entry: opportunities to build capacity to prevent the introduction of invasive species and improve biosecurity at US Ports. Gland, Switzerland: IUCN.
- Robinson CV, Garcia de Leaniz C, Rolla M, Consuegra S. 2019. Monitoring the eradication of the highly invasive topmouth gudgeon (Pseudorasbora parva) using a novel eDNA assay. Environ DNA. 1(1):74–85. doi: 10.1002/edn3.12.
- Ruppert KM, Kline RJ, Rahman MS. 2019. Past, present, and future perspectives of environmental DNA (eDNA) metabarcoding: a systematic review in methods, monitoring, and applications of global eDNA. Global Ecol Conserv. 17:e00547. doi: 10.1016/j.gecco.2019.e00547.
- Rytwinski T, Taylor JJ, Donaldson LA, Britton JR, Browne DR, Gresswell RE, Lintermans M, Prior KA, Pellatt MG, Vis C, et al. 2019. The effectiveness of non-native fish removal techniques in freshwater ecosystems: a systematic review. Environ Rev. 27(1):71–94. doi: 10.1139/er-2018-0049.
- Sard NM, Herbst SJ, Nathan L, Uhrig G, Kanefsky J, Robinson JD, Scribner KT. 2019. Comparison of fish detections, community diversity, and relative abundance using environmental DNA metabarcoding and traditional gears. Environ DNA. 1(4):368–384. doi: 10.1002/edn3.38.
- Sassoubre LM, Yamahara KM, Gardner LD, Block BA, Boehm AB. 2016. Quantification of environmental DNA (eDNA) shedding and decay rates for three marine fish. Environ Sci Technol. 50(19):10456–10464. doi: 10.1021/acs.est.6b03114.
- Schultz EE. 1960. Establishment and early dispersal of a loach, Misgurnus anguillicaudatus (Cantor), in Michigan. Trans Am Fish Soc. 89(4):376–377. doi: 10.1577/1548-8659(1960)89[376:EAEDOA]2.0.CO;2.
- Schumer G, Crowley K, Maltz E, Johnston M, Anders P, Blankenship S. 2019. Utilizing environmental DNA for fish eradication effectiveness monitoring in streams. Biol Invasions. 21(11):3415–3426. doi: 10.1007/s10530-019-02056-z.
- Seebens H, Blackburn TM, Dyer EE, Genovesi P, Hulme PE, Jeschke JM, Pagad S, Pyšek P, Winter M, Arianoutsou M, et al. 2017. No saturation in the accumulation of alien species worldwide. Nat Commun. 8(1):14435. doi: 10.1038/ncomms14435.
- Sepulveda AJ, Al-Chokhachy R, Laramie MB, Crapster K, Knotek L, Miller B, Zale AV, Pilliod DS. 2021. It’s complicated…environmental DNA as a predictor of trout and char abundance in streams. Can J Fish Aquat Sci. 78(4):422–432. doi: 10.1139/cjfas-2020-0182.
- Sepulveda AJ, Schabacker J, Smith S, Al-Chokhachy R, Luikart G, Amish SJ. 2019. Improved detection for rare, endangered and invasive trout using a new large-volume sampling method for eDNA capture. Environ DNA. 1(3):227–237. doi: 10.1002/edn3.23.
- Seymour M, Durance I, Cosby BJ, Ransom-Jones E, Deiner K, Ormerod SJ, Colbourne JK, Wilgar G, Carvalho GR, de Bruyn M, et al. 2018. Acidity promotes degradation of multi-species environmental DNA in lotic mesocosms. Commun Biol. 1(1):4. doi: 10.1038/s42003-017-0005-3.
- Shogren AJ, Tank JL, Andruszkiewicz E, Olds B, Mahon AR, Jerde CL, Bolster D. 2017. Controls on eDNA movement in streams: transport, retention, and resuspension. Sci Rep. 7(1):5065. doi: 10.1038/s41598-017-05223-1.
- Sievers F, Wilm A, Dineen D, Gibson TJ, Karplus K, Li W, Lopez R, McWilliam H, Remmert M, Söding J, et al. 2011. Fast, scalable generation of high-quality protein multiple sequence alignments using Clustal Omega. Mol Syst Biol. 7(1):539. doi: 10.1038/msb.2011.75.
- Sigsgaard EE, Carl H, Møller PR, Thomsen PF. 2015. Monitoring the near-extinct European weather loach in Denmark based on environmental DNA from water samples. Biol Conserv. 183:46–52. doi: 10.1016/j.biocon.2014.11.023.
- Sommer TR, Conrad L, O’Leary G, Feyrer F, Harrell WC. 2002. Spawning and rearing of splittail in a model floodplain wetland. Trans Am Fish Soc. 131(5):966–974. doi: 10.1577/1548-8659(2002)131<0966:SAROSI>2.0.CO;2.
- Strayer DL, Eviner VT, Jeschke JM, Pace ML. 2006. Understanding the long-term effects of species invasions. Trends Ecol Evol. 21(11):645–651. doi: 10.1016/j.tree.2006.07.007.
- Top-Karakuş N, Karakuş U. 2022. Misgurnus anguillicaudatus (oriental weatherloach). CABI Compendium. 75:1–12. doi: 10.1079/cabicompendium.75075.
- Urquhart AN. 2013. Life history and environmental tolerance of the invasive Oriental Weatherfish (Misgurnus anguillicaudatus) in southwestern Idaho, USA [master’s thesis]. Boise, Idaho: Boise State University.
- Vitousek PM, d’Antonio CM, Loope LL, Westbrooks R. 1996. Biological invasions as global environmental change. Am Sci. 84(5):468–478.
- Wagner MD, Schumann DA, Smith BJ. 2019. Gear effectiveness and size selectivity for five cryptic madtom species (Noturus spp.). J Appl Ichthyol. 35(3):673–682. doi: 10.1111/jai.13892.
- Wang Y, Hu M, Wang W, Cao L. 2009. Effects on growth and survival of loach (Misgurnus anguillicaudatus) larvae when co-fed on live and microparticle diets. Aquacul Res. 40(4):385–394. doi: 10.1111/j.1365-2109.2008.02104.x.
- Wang YJ, Li DX. 2005. Research on biological characters and exploitations of Paramisgurnus dabryanus Sauvage. Special Wild Eco Anim Plant Res. 1:60–62.
- Wilcove DS, Rothstein D, Dubow J, Phillips A, Losos E. 1998. Quantifying threats to imperiled species in the United States. BioScience. 48(8):607–615. doi: 10.2307/1313420.
- Wilcox TM, McKelvey KS, Young MK, Sepulveda AJ, Shepard BB, Jane SF, Whiteley AR, Lowe WH, Schwartz MK. 2016. Understanding environmental DNA detection probabilities: a case study using a stream-dwelling char Salvelinus fontinalis. Biol Conserv. 194:209–216. doi: 10.1016/j.biocon.2015.12.023.
- Wilson EB. 1927. Probable inference, the law of succession, and statistical inference. J Am Stat Assoc. 22(158):209–212. doi: 10.1080/01621459.1927.10502953.
- Wood ZT, Erdman BF, York G, Trial JG, Kinnison MT. 2020. Experimental assessment of optimal lotic eDNA sampling and assay multiplexing for a critically endangered fish. Environ DNA. 2(4):407–417. doi: 10.1002/edn3.64.
- Wozney KM, Wilson CC. 2017. Quantitative PCR multiplexes for simultaneous multispecies detection of Asian carp eDNA. J Great Lakes Res. 43(4):771–776. doi: 10.1016/j.jglr.2017.05.001.
- Zhang Y, Wang H, Qin F, Liu S, Wu T, Li M, Xu P, Zhang X, Wang X, Hu G, et al. 2012. Molecular characterization of estrogen receptor genes in loach Paramisgurnus dabryanus and their expression upon 17α-ethinylestradiol exposure in juveniles. Gen Comp Endocrinol. 178(2):194–205. doi: 10.1016/j.ygcen.2012.06.004.