Particle depositional studies from nasal sprays are important for efficient drug delivery. The main influences on deposition involve the nasal cavity geometry and the nasal spray device of which its parameters are controlled by the product design. It is known that larger particle sizes (≫ 10 μm) at a flow rate of 333 ml/s impact in the anterior portion of the nose, leaving a significant portion of the nasal cavity unexposed to the drugs. Studies have found correlations for the spray cone angles and particle sizes with deposition efficiencies. This study extends these ideas to incorporate other parameters such as the insertion angle of the nasal spray and the injected particle velocity to observe its effect on deposition. A numerical method utilizing a particle tracking procedure found that the most important parameter was the particle's Stokes number which affected all other parameters on the deposition efficiency.
INTRODUCTION
Nasal drug delivery is a popular way to treat respiratory ailments such as congestion and allergies. It has become an alternative to oral and injection routes of delivering systemic drugs for a variety of diseases and its advantages have been well documented (CitationHinchcliffe and Illum 1999; CitationDjupesland et al. 2003). Information regarding particle deposition within the nasal cavity can be used for effective design of a nasal sprayer device to deliver drugs to specific targeted sites. Various studies adopting human subjects or nasal cavity replicas have found relationships for particle deposition efficiencies with nasal spray parameters, such as spray cone angle and the particle size distribution produced (CitationCheng et al. 2001; Suman et al. 1999; CitationCheng et al. 1996). However in-vivo and nasal cavity replica methods used, limit the scope of studies due to their tendency to be intrusive, time consuming and expensive in implementation. Numerical analysis allows a wider range of studies (e.g., repeatability and accuracy of a nasal spray injection released from the same location) that is based on advancements in computational models employing Computational Fluid Dynamics (CFD) techniques (CitationHörschler et al. 2003; CitationYu et al. 1998; CitationKeyhani et al. 1995). The main advantages include the graphical representation of results such as local particle deposition sites, particle and air flow path, velocity contours and vectors at any location. However one disadvantage of CFD is the reliability of results, which is dependent on the correct mathematical formulation for the process under simulation, i.e., the more realistic boundary conditions imposed along with greater degree of accuracy in the numerical algorithms of the system of equations, the more precise the solution will be. Furthermore, there is no single turbulence model that can reliably predict all turbulent flows found in practical applications with sufficient accuracy, thus more efforts are still required to improve this CFD aspect.
Spray particle deposition is determined by several parameters: (1) gas phase flow field such as velocity and turbulence effects; (2) deposition mechanisms involving the interaction between particles and its continuum; (3) particle material properties and initial spray conditions such as particle density, size, and spray cone angle.
Firstly, knowledge of the flow field allows the prediction of particle deposition which is determined by the complex geometry of the nasal cavity. CitationKelly et al. (2000) presents detailed flow patterns within a replica cast of a human nasal cavity. It was found that a small standing eddy was formed in the olfactory regions, low flow occurred in the turbinate regions and the highest velocities were reached along the floor of the nasal cavity and at the nasal valve where the cross-sectional area is smallest. This confirmed with CitationKeyhani et al.'s (1995) numerical simulation of airflow in the human nasal cavity. Furthermore, CitationKublik and Vidgren (1998) point out that due to sudden changes in geometry, turbulence production is enhanced, causing high deposition to occur at the nasal valve and at the atrium.
Secondly, particle depositional studies also involve the interaction of particles with its continuum. Lippman et al. (1980) discusses three main mechanisms for deposition of inhaled drug particles: inertial impaction, gravitational sedimentation, and Brownian diffusion. Particles in the sub-micron range will deposit by Brownian diffusion (CitationGonda and Gipps 1990), whilst inertial impaction is the dominant mechanism for particles larger than 1 μ m. Where the probability of inertial impaction,
Finally, the nasal spray device initializes the drug delivery process setting the particle's initial conditions. Recent studies have measured spray characteristics, such as particle size and spray cone angle (CitationSuman et al. 2002; CitationDayal et al. 2004; CitationEck et al. 2000). A nasal spray produces drug particles in the range of 5 μ m up to 200 μ m with a mean of 45–65 μ m and spray cone angles ranging from narrow sprays at 35° to wide sprays at 70°. CitationNewman et al. (1998) found that an increase in spray cone angle from 35° to 60° showed a reduction in size of the deposition area as less of the spray was able to penetrate the narrow nasal valve. CitationCheng et al. (2001) found that deposition in the anterior region increased with an increase in cone angles. In contrast, CitationSuman et al. (2002) found that there wasn't a significant difference in deposition patterns with respect to spray cone angles. It is argued that the changes in spray angle is unlikely to alter the distribution of droplets in the nose due to the narrow passageway of the nasal valve, compared with the spray plumes which are ten times greater. Thus the emitted plumes never have the opportunity to freely develop in the nasal cavity as they would in an unconfined space.
The differences in arguments stem from the numerous variations that exist in studying nasal spray deposition efficiencies (CitationTu et al. 2004). Moreover, the effects of the insertion angle of the spray device, the location of the insertion and the initial particle velocity were not discussed. It is the aim of this study to examine these parameters and the influence it has on the deposition of particles in the nasal cavity by numerical analysis.
GEOMETRY AND NUMERICAL METHODS
Nasal Cavity Geometry Construction
A nasal geometry was obtained through a computed tomography (CT) scan of the nose of a healthy 25 year old, healthy non-smoking Asian male (170 cm height, 75 kg mass). The constructed geometrical model of a human nasal cavity was created using the solid modelling tool GAMBIT. Slices of the three-dimensional CT image were taken at different positions from the entrance of the nasal cavity to just anterior of the larynx. The image analysis data consisted of xyz coordinates of airway perimeters for cross-sections spaced at intervals of 1 to 5 mm depending on the complexity of the anatomy. A computational mesh was generated enveloping the anatomical geometry, which was used to simulate the airflow. The mesh generation step presented the most labor-intensive part of the simulation process because of the requirement of meshing the intricate surface topology of the airway geometry. A denser mesh distribution was concentrated near the surface boundaries in regions where relatively large velocity gradients exist.
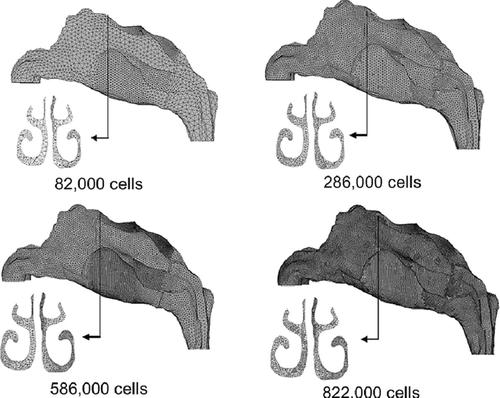
A preliminary model was created with a mesh cell count of 82,000. This coarse mesh underwent enhancement techniques to address quality criteria such as cell skewness, y+ wall boundary conditions and cell-to-cell volume change. Three further models were created, each retaining the same geometry but differing in their mesh sizes (286,000 cells, 586,000 cells, and 822,000 cells) for computation to check for grid independency through convergence of results. shows the resolution of the original coarse mesh (82,000 cells) and compares it with the enhanced models. An additional frontal view (looking into subject's face) of a coronal section, close to the beginning of the turbinate region is included.
FIG. 1 Nasal cavity models of different mesh resolutions, 82,000, 286,000, 586,000 and 822,000 cells.
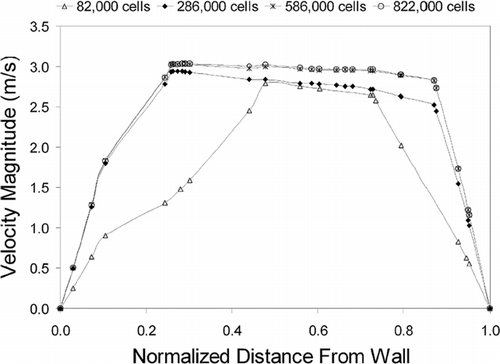
It is known that the accuracy of results increase for finer mesh, however at higher computational costs. A grid independence test, allows for the optimum mesh grid size to be determined. The Navier-Stokes equations for the gas phase were solved at 20 L/min and a velocity profile near the constricting nasal valve area was undertaken for each model and compared. shows the velocity profile converge at a mesh resolution of 586,000 cells and a further increase to 822,000 cells shows no further improvement. Therefore the nasal cavity model with 586,000 cells is used for further analysis.
FIG. 2 Velocity profiles of a coronal section near the nasal valve region for the four different nasal cavity models. The profile is taken along the line shown on the coronal section.
Numerical Methods
A generic CFD commercial code, FLUENT 6.1.2, was used to predict the flow field of the continuum gas phase under steady-state conditions by solving the full Navier-Stokes equations. These equations were discretized using the finite volume approach. The QUICK scheme was used to approximate the momentum equation while the pressure-velocity coupling was realized through the SIMPLE method. The presence of turbulent flow has been confirmed in the human nasal cavity where the flow velocity can reach as high as 22 m/s (CitationTu et al. 2004). Additionally turbulent flow was assumed and the k-ϵ turbulence model was used for flows around 200–300 ml/s (CitationKeyhani et al. 1995; CitationYan et al. 2004). The k-ϵ models are the most commonly used turbulence model, based on the assumption of isotropic turbulence and a single eddy viscosity for all three components of the velocity vector. This can cause inaccuracies for flows with high swirling action which makes the turbulence anisotropic. However for flows in the nasal cavity that exhibit low levels of swirl the k-ϵ approximation may be sufficient given the low computational costs compared with more sophisticated approaches such as Large Eddy Simulations and the Reynolds Stress Model. The gas phase Reynolds-Averaged conservation equations along with the equations for the turbulent kinetic energy and its dissipation rate can be cast in the general form:
Other constants in the turbulent transport equations are given to be C 2 = 1.9, σ κ = 1.0, and σ ϵ = 1.2, respectively.
Lagrangian Particle Tracking Model
A Lagrangian particle tracking method is used to trace the dispersion of particles about the trajectory. The Lagrangian scheme is most popular in engineering applications for the prediction of particle flows because it can easily be combined with a stochastic Discrete Random Walk (DRW) scheme, albeit with high computational costs (CitationTu 2000). Trajectories of individual particles can be tracked by integrating the force balance equations on the particle.
The CFD code, FLUENT, handles the turbulent dispersion of particles by integrating the trajectory equations for individual particles, using the instantaneous fluid velocity, u i g + u i ′(t), along the particle path during the integration process. Here, the DRW is utilized where the fluctuating velocity components u′ i that prevail during the lifetime of the turbulent eddy are sampled by assuming that they obey a Gaussian probability distribution, so that
Boundary Conditions
The nasal cavity was subjected to constant air flow rates of 20–40 L/min. The internal walls were modelled using an “enhanced wall treatment” function to consider the no-slip condition on the air flow. The particles adopted the properties of spherical water droplets, as most drug formulations are diluted with water. Initial particle conditions are assumed by analytical methods due to a lack of experimental data. The conditions for the release of particles into the constant flow rate differed for the parameter under investigation and are elucidated upon, within the relevant sections. The internal walls of the nasal cavity were set to a “trap” condition, meaning that particles touching a wall, deposit at that location.
RESULTS AND DISCUSSION
Validation using a Hybrid Method
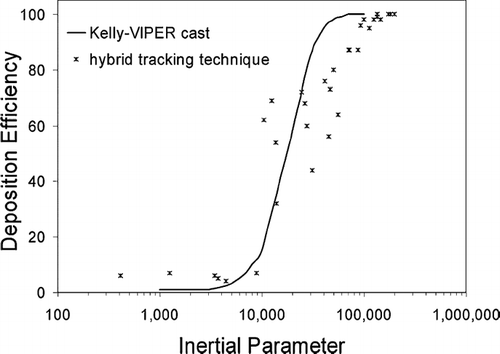
Monodispersed particles in the range of 1 μ m to 30 μ m were initially tested at gas flow rates, 20 L/min and 40 L/min. Two tracking methods, DRW tracking and mean flow tracking were applied. The results found were qualitatively similar to that found in CitationZhang et al. (2004). The DRW tracking grossly overestimates particle deposition for I < 10,000 and underestimates deposition for I > 20,000, while the mean flow tracking overestimates particle deposition for I < 8,000 and underestimates deposition for I > 10,000. It is suggested that a hybrid tracking method be used where the DRW tracking is used for larger particles where I > 10,000 and a mean flow tracking be used for I < 10,000, equivalent to d p ≈ 5.5 μ m for a flowrate of 20 L/min. Thus further analysis of deposition of particles will focus on particles in the range of 10–50 μ m. This ideal model is sufficient for the study of nasal spray particles given that its mean particle sizes are in the range of 50–70 μ m (CitationCheng et al. 2001).
The results were compared against CitationKelly et al. (2004) experimental results (). The numerical hybrid tracking simulation overestimated deposition for I > 10,000 and underpredicted deposition for I < 10,000. One reason for the discrepancy is the intersubject variability between the nasal cavity models that CitationKelly et al. (2004) obtained (53-year-old, non-smoking Caucasian male, 73 kg mass, 173 cm height) as opposed to the model used in the present study. Differences in the comparison of particle deposition efficiencies with the inertial parameter is discussed by CitationHäußermann et al. (2002), such as the limitation of the inertial parameter not taking into account the changes in airway geometry. This constant air flow rate is a measure of the average impactability of the particle over the entire domain, as it doesn't factor in the changes in velocity which is significant when the geometry under consideration is highly convoluted, narrow and complex. Furthermore, nasal cavity replicate casts with wider airways as in CitationSwift's (1991) case might cause less deposition due to secondary flow (CitationHäußermann et al. 2002). This provides some reasoning for variations in data for deposition efficiency versus inertial parameter charts. In addition CitationHäußermann et al. 's (2002) study showed that a lower flow rate (i.e., 10 L/min) had lower deposition efficiencies than a higher flow rate (i.e., 20 L/min) for the same inertial parameter.
FIG. 3 Deposition efficiency for monodisperse particles released passively from the nostril inlet subjected to airflow rates of 20 L/min, 30 L/min and 40 L/min using a hybrid tracking technique.
Air Flow Analysis
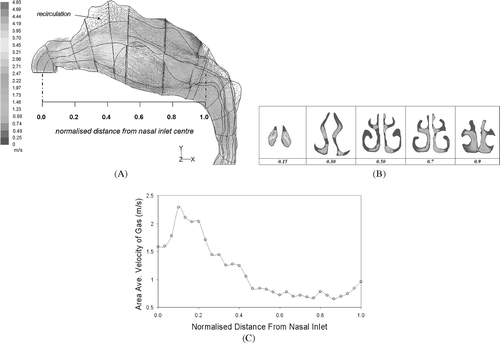
A lot of literature has covered air flow patterns within the nasal cavity, CitationZwartz and Guilmette (2001), and CitationHörschler et al. (2003), to name a few, thus a comprehensive discussion will not be undertaken in the present study. The total air flow rate through both nostrils was 20 L/min which produced an inlet velocity u in = 2.1 m/s. The flow increases at the nasal valve where the cross-sectional area is smallest and reaches a maximum area-averaged velocity of 2.28 m/s (, , ). Entering the atrium, the velocity decreases as the nasal cavity opens up. The flow remains along the middle and lower regions of the nasal cavity and close to the septum walls rather than diverging out towards the outer meatus. A region of recirculation appears in the expanding region of the cavity near the top (olfactory region). At the nasal pharynx the velocity increases once more where a decrease in area exists.
FIG. 4 (A) A velocity vector field in the horizontal plane for inlet flowrate of 20 L/min. A region of recirculation is found near the roof of the nasal cavity. The normalised distance spans from the average center of the two nostril openings in the x-axis, to the nasopharynx where the two cavities have joined completely. (B) Velocity contours at different cross-sections through the cavity. The cross-sections correspond to the normalised distance from the nasal inlet. (C) Area averaged velocity profile inside the nasal passage. Maximum averaged area occurs around 0.10–0.15, near the nasal valve region. An increase in the velocity occurs at the nasopharynx region where the cross-sectional area decreases.
Initial Particle Velocity
The initial particle velocity can be controlled in many ways such as changing the nozzle diameter and the actuation mechanism. Monodispersed particles were released uniformly in a normal direction to the inlet surface of each nostril and the average deposition within the left and right nasal cavity was recorded. Injected particle velocities were calculated based on mass conservation, assumed nasal spray geometries and our own preliminary experimental work on nasal spray nozzles, which found velocities ranging between 10 m/s to 20 m/s for 200 kpa to 500 kpa pressure actuations, respectively. Quantitatively, the results obtained by using a uniform surface injection, normal to the nostril inlets, will differ from a real nasal spray application that possesses an injection from a very small diameter. However it does provide a basis for the impactability of specific particles at different injection velocities on a qualitative level.
The injected particles have an increase in their kinetic energy, resulting in a higher initial momentum for the intended trajectory. However this energy is degenerated by the drag force acted on by the gas phase. The amount of influence the gas has on the particle is dependent on the particle Stokes number. CitationCrowe et al. (1998) presents a relationship for the particle-gas velocity ratio as a function of the Stokes number:
It is expected that the dynamic change in the particle velocity will occur within the anterior section of the nasal cavity given the order of magnitudes of the particles. The anterior third of the nasal cavity is divided into three zones and particle flow visualization and deposition patterns within this region are observed with results displayed in and , , .
FIG. 5 (A) The anterior third of the nasal cavity that has been split into three zones for investigation. Zone 1 consists of the nostril inlet surface, zone 2 includes the nasal valve region and zone 3 is the beginning of the main nasal airway-the turbinate region. (B) Total deposition in zone 1 and zone 2 of the nasal cavity for different particle injection velocity. Particles were uniformly released from the nostril inlet surface, in the normal direction at different injected particle velocities, u*. Where u* = u pi /u g .
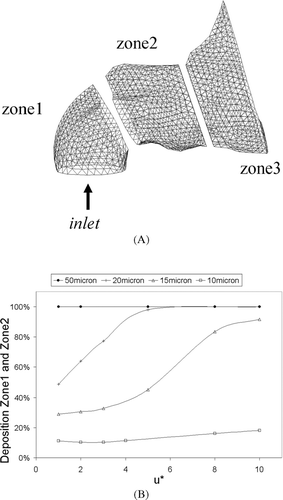
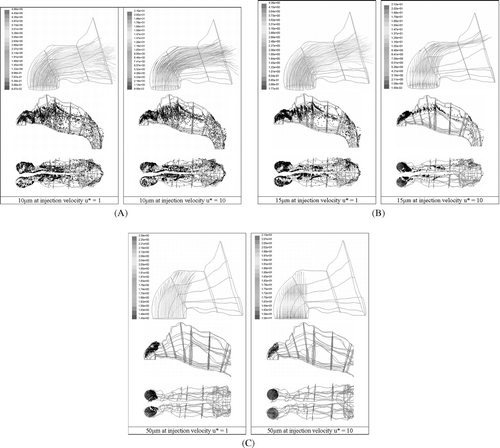
FIG. 6 (A) Deposition patterns for 10 μ m particles released uniformly from the inlet surface normal to the nostril openings at u* = 1 and u* = 10. (B) Deposition patterns for 15 μm particles released uniformly from the inlet surface normal to the nostril openings at u* = 1 and u* = 10. (C) Deposition patterns for 50 μm particles released uniformly from the inlet surface normal to the nostril openings at u* = 1 and u* = 10.
The front three zones are shown in , where they conform to that of a 90° bend. Zone1 is similar to a vertical column, Zone2 is where the particles begin to change its velocity with the gas phase whilst Zone3 will indicate those particles that were able to follow the gas phase. shows the total particle deposition in the first two zones of the nasal cavity at different particle injection velocities. A small influence on the impactability of a 10 μ m particle is observed when there is an increase in the initial particle velocity and is seen by the slight increase in deposition. The low Stokes number brings about a rapid decrease in velocity and the particle assumes the gas phase velocity before the change in direction of the flow. The influence of u* amplifies as the particle size increases, where a large proportion of particles deposit more readily in the two frontal zones.
About 70% of 15 μ m particles are able to follow the curved streamlines when u* = 1 as particle impactablility is dominated by the Stokes number. However significant deposition increases when u* > 4. The Stokes number, a ratio of the particle's relaxation time to the flow characteristic time, indicates how long it takes for the particle to adjust to the gas phase conditions. For a fixed distance (nostril opening to the top of the vestibule), an increase in u* will decrease the time taken to cover this distance. This leads to a shorter time and distance for the particle to adapt to the gas phase conditions and presents a higher impactability than that calculated by the Stokes number alone. The influence of the injected particle velocity is still felt as the gas phase begins to curve. As particle size increases, so does the relaxation time that the particle needs to adapt to flow changes. As a result significant deposition increases occur at lower u* values for larger Stokes numbers. The larger particles exhibit much higher Stokes numbers which prevents the particles from following the curved streamlines. It is observed that 50 μ m particles entrained in the flow (u* = 1) is an example of this. Therefore an injected 50 μ m particle (u* = 10) exhibiting a greater amount of initial momentum will only exacerbate the linear projectile motion of the particle. Thus it is evident that there are two forces acting against each other during the initial injection of the particles. The initial momentum force that is counteracted by the drag force which is inversely proportional to the particle Stokes number.
, , displays the deposition sites for the two extreme cases, d p = 10 μ m and d p = 50 μ m and a mid-range particle, d p = 15 μ m subjected to u* = 1 and u* = 10. 50 μm particles impact at the top of the vestibule at u* = 10, and at u* = 1, only a small proportion begin to curve albeit for a short distance before impaction. In contrast 10 μ m particles are barely affected by the increase in injection velocity with local deposition sites being concentrated near the nasal valve region and septum walls which is a qualitatively similar to CitationZwartz and Guilmette (2001). The difference in deposition occurs at the entrance region where entrained particles released near the wall deposit readily through fluctuations in the flow whereas particles at higher velocities overcome this region. The particle flow for u* = 10 enable the particles to travel further linearly which is evident in the particles adapting to the flow changes at a later stage than particles at u* = 1. This later adaption to the flow causes the particles to assume those streamlines closer to the ceiling of the nasal cavity compared with particles at u* = 1. Beyond the first two zones of the nasal cavity deposition sites are similar, locally.
Deposition of 15 μ m particles at u* = 1 are mainly concentrated within the vestibule, nasal valve regions and along the septum walls. Differences appear between the left-side and right-side of the cavity which is due to anatomical variations. The concentration of particles within the middle passage of the nasal cavity is lighter than that shown in 10 μ m particles as the larger particles have a higher concentration within the anterior section of the nasal cavity. When u* is increased to 10 the particle is no longer just governed by its Stokes number, but also by the driving force of the initial injected velocity that adds initial momentum to the particle. This increase in momentum is dissipated by the difference in velocities of the gas and particle phase. The particles travel further linearly, in the normal direction to the nostril inlet with 88% impacting at the top of the vestibule. Only 12% of particles are able to adjust to the curvature in time and these particles remain in the upper regions of the nasal cavity throughout the flow.
Insertion Angle (α)
The insertion angle, α, is the angle the nasal spray device makes away from the horizontal position (0° in the x-y plane), when looking into the side of a person's face. Particle sizes of 10 μ m to 50 μ m were used at an initial velocity of 10 m/s. A uniform surface injection released from the inlet was used to eliminate variables such as location of the nozzle tip, nozzle diameter, and spray cone angle.
Higher deposition occurred at 100° for most particles () as the particles are discharged directly into the anterior-most wall of the nasal cavity with an initial velocity of 10 m/s, affecting greatly the particles located wall-side of the inlet release. This concentration of particles can be seen in a for 15 μ m particles. Minimum deposition for smaller sized particles, 10 μ m and 15 μ m, was found when α = 70°. The 70° direction of particles enhances the ability of turning, as more particles assume the streamlines that exist on the inside curvature. Less particles deposit vertically above the release point (, ) when α = 70° compared with α = 90°. Further decreases in α, where the direction of discharge approaches the horizontal increases deposition of particles as a higher proportion of particles are now directed at the adjoining wall of the nostril, albeit a small margin. The deposition sites for α = 30° and α = 70° are similar in that particles that flow with the gas phase beyond Zone3 will behave similarly, since at this stage the particle's initial momentum generated by the injection will have been dissipated by the drag force. However the concentration of particles depositing on the adjoining wall to the nostril inlet is much greater for α = 30° than α = 70° but is able to capture this.
FIG. 7 Deposition in zone 1 and zone 2 for monodispersed particles released uniformly from the inlet surface at 10 m/s for different insertion angles. The insertion angle begins at 0° degrees for a horizontal direction aimed towards the nasal valve region and increasing through a counter-clockwise direction in the x-y axis (see ).
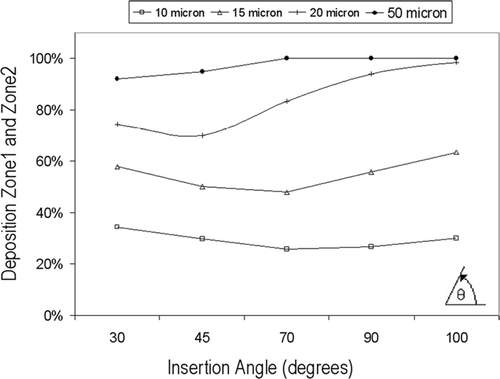
FIG. 8 (A) Deposition patterns for 15 μm particles released uniformly from the inlet surface uniformly from the inlet surface at insertion angles 100° and 90°. (B) Deposition patterns for 15 μm particles released uniformly from the inlet surface uniformly from the inlet surface at insertion angles 70° and 30°.
The deposition curve for 20 μ m, behave similarly to 10 μm and 15 μm particles, but at lower α (). Minimum deposition in the two frontal zones was found at α = 45°. Although more particles are directed into the adjoining wall, this is offset by more particles penetrating into the curvature instead of impacting straight into the roof of the vestibule as is the case when α = 90°. These larger particles require a sharper angle of insertion to avoid impacting with the roof of the vestibule, thus aiding the alignment of the particles with the 90° bend and reducing the amount of deviation required in turning. The larger the particle (20 μ m and 50 μ m), the more effective the decrease in α is. Another insertion angle that can be considered is the orientation when looking into a person's face, front-on, in the y-z plane. This was not investigated as the same ideas regarding the particle size with its dependency on initial flow conditions exist.
Full Spray Cone Angle (β)
The full spray cone angle, β, is the dispersion of particles exiting from the nozzle tip. Particles had to be released from a small diameter compared with previous particle release which used a uniform inlet release at the nostril openings to allow observation of the physical differences when changing β. Particles were released at 10 m/s from the centralized location of the nostril inlet, with a diameter of 0.8 mm and a range of β between 20° to 80°.
The smaller ranged particles, that follow the gas phase velocity more readily, are optimized when released with a narrow β as a wider β gives rise to a larger range of dispersion of particles due to the nature of a 360° spray cone. The larger dispersion creates a low ratio of favorably dispersed particles (those pointing with the flow) to those being dispersed away from the curvature (i.e., in the opposite direction) of the gas flow (). The effect of this becomes apparent as particle size increases. shows the flow for 15 μ m being centralized when β = 20° and the increase in deviation from the center when β = 80°. Deposition for β = 20° remains along the roof of the nasal cavity and near the septum walls with 28% depositing in the first two zones. At β = 80° deposition in the two frontal zones is increased to 47%, where a larger deposition area, due to the particle dispersion, occurs.
FIG. 9 Total deposition in zone 1 and zone 2 for monodispersed particles released at 10 m/s from a small internal diameter at the center of the nostril inlet surface. The spray cone angles ranged from 20° and 80°.
FIG. 10 (A) Deposition patterns for 15 μm particles released at 10 m/s from a small internal diameter at the center of the nostril inlet surface. The spray cone angles ranged from 20° and 80°. (B) Deposition patterns for 20 μm particles released at 10 m/s from a small internal diameter at the center of the nostril inlet surface. The spray cone angles ranged from 20° and 80°.
The internal location of injection is closer to the roof of the vestibule than from the surface nostril inlets. This reduces the allowable distance for particles to relax their initial conditions to the gas phase conditions, thus enhancing impaction on the roof of the vestibule. As seen earlier 20, 50 μ m particles have near 100% deposition in the front two zones. Subsequently any particle dispersion that is favorable will project the particles into the already curved streamlines, allowing them to travel further, albeit a small distance. compares the two deposition patterns for 20 μ m particles at β = 20° and β = 80°. At β = 20°, impaction occurs directly above the injection release point in a concentrated area. When β = 80°, a wider area of deposition is observed in the frontal zones, whilst those particles projected favorably towards the nasal valve are able to travel beyond the 90° bend. However its deposition is imminent and this occurs within the middle sections of the nasal cavities. Therefore an optimum β, is based on the ratio of the change in favorably dispersed particles to the number of particles that are predestined to impact on the roof of the vestibule because of their particle size.
CONCLUSION
This study demonstrates the significant influence the Stokes number plays in deposition of particles in the nasal cavity. For a flow rate of 20 L/min 10–20 μ m particles were sensitive to initial injection velocity, insertion angle, and spray cone angle as its size increased. Larger particles exhibited very high Stokes numbers which caused it to be insensitive to these parameters.
Current commercially available nasal sprays produce mean size particles of 45–60 μ m which presents a problem as larger particles (≥ 20 μ m), are relatively insensitive towards initial injection conditions and are likely to deposit in the anterior portion of the nose decreasing the drug delivery's efficiency. Producing smaller particles (≤ 20 μ m) during atomization is an option for designers, however smaller particles are more inclined to follow the gas phase flow, which can lead to deposition beyond the nasal pharynx.
This study also demonstrates the numerous variables that exist during a physical actuation of a nasal spray, which are significant given the order of magnitudes that the analysis deals within. The study isolated the parameters to investigate their effects, however in reality, these parameters and more are combined during an actuation, which maybe an explanation for the differences in results of CitationSuman et al. (2002), CitationCheng et al. (2001), and CitationNewman et al. (1998).
The ideas formulated can be used as a basis for improving the design of nasal spray devices to achieve better drug delivery such as (1) redirecting the release point of the spray (i.e., the insertion angle) to be align with the flow streamlines, (2) controlling the particle size distribution, and (3) controlling the particle's initial velocity. In the attempt to replicate actual nasal spray applications whilst isolating the investigating parameters, idealized injected conditions for the particles were used, along with the idealized nasal cavity. Further studies are needed to extend the results to other nasal cavities, to include the permeability effects of nasal hairs, and establishing more accurate initial particle conditions such as the instantaneous velocity at injection that can include swirl effects.
NOMENCLATURE
| A i | = |
convective flux |
| A 0, As | = |
model constants for realizable κ-ϵ turbulence model |
| a 1, a 2, a 3 | = |
constants for drag coefficient equation |
| C 1, C 2 | = |
model constants for realizable k-ϵ turbulence model |
| C μ | = |
coefficient in the k-ϵ turbulence mode |
| C D | = |
coefficient of drag |
| D, d | = |
diameter |
|
| = |
mean diameter |
| F x | = |
additional forces |
| F D | = |
drag forces |
| g | = |
gravitational acceleration |
| I | = |
inertial parameter |
| k | = |
kinetic turbulent energy |
| LDE | = |
local deposition efficiency |
| Le | = |
eddy length scale |
| N | = |
total number of particles trapped within total sections |
| n | = |
distribution constant, number of particles trapped within a local section |
| P | = |
pressure |
| Q | = |
flow rate |
| Re | = |
Reynolds number |
| r | = |
uniform random number |
| S | = |
source term |
| S ij , S jk , S ki , | = |
strain rates |
| T L | = |
fluid Lagrangian integral time |
| t cross | = |
eddy crossing time |
| t p | = |
particle relaxation time |
| u | = |
velocity |
| u* | = |
particle/gas velocity ratio |
| x i , x j , x k | = |
Cartesian coordinate system |
| y d | = |
mass fraction of droplets with diameters greater than d |
| Greek Letters | = | |
| α | = |
insertion angle |
| β | = |
spray cone angle |
| Γ | = |
diffusion coefficient |
| σ | = |
turbulence Prandtl number |
| ϵ | = |
turbulent dissipation rate |
| ζ | = |
normally distributed random number |
| κ | = |
turbulent kinetic energy |
| ν | = |
kinematic viscosity |
| ρ | = |
density |
| τ | = |
eddy characteristic lifetime |
| φ | = |
governing variable |
| Subscripts and Superscripts | = | |
| eff | = |
effective |
| ϵ | = |
dissipation rate of turbulent kinetic energy |
| g | = |
gas phase |
| k | = |
turbulent kinetic energy |
| p | = |
discrete particle phase |
| t | = |
turbulent phase |
Acknowledgments
The financial support provided by the Australian Research Council (project ID LP0347399) is gratefully acknowledged.
Related Research Data
REFERENCES
- Cheng , Y. S. , Holmes , T. D. , Gao , J. , Guilmette , R. A. , Li , S. , Surakitbanharn , Y. and Rowlings , C. 2001 . Characterization of Nasal Spray Pumps and Deposition Pattern in a Replica of the Human Nasal Airway . J. Aerosol Med. , 14 ( 2 ) : 267 – 280 . [INFOTRIEVE] [CSA]
- Cheng , Y. S. , Yeh , H. C. , Guilmette , R. A. , Simpson , S. Q. , Cheng , K. H. and Swift , D. L. 1996 . Nasal Deposition of Ultrafine Particles in Human Volunteers and its Relationship to Airway Geometry . Aerosol Sci. Technol. , 25 : 274 – 291 . [CSA]
- Crowe , C. , Sommerfeld , M. and Tsuji , Y. 1998 . Multiphase Flows with Droplets and Particles , 25 CRC Press LLC .
- Dayal , P. , Shaik , M. S. and Singh , M. 2004 . Evaluation of Different Parameters that Affect Droplet-Size Distribution from Nasal Sprays Using Malvern Spraytec . J. Phar. Sci. , 93 : 1725 – 1742 . [CROSSREF] [CSA]
- Djupesland , P. G. , Sketting , A. , Winderen , M. and Holand , T. 2003 . Bi-Directional Nasal Delivery of Aerosols Can Prevent Lung Deposition . J. Aerosol Med. , 17 : 249 – 259 . [CROSSREF] [CSA]
- Eck , C. R. , McGrath , T. F. and Perlwitz , A. G. 2000 . Droplet Size Distributions in a Solution Nasal Spray . Respir. Drug Deliv. , 7 : 475 – 478 . [CSA]
- Gonda , I. and Gipps , E. 1990 . Model of Disposition of Drugs Administered into the Human Nasal Cavity . Pharm. Res. , 7 : 69 – 75 . [INFOTRIEVE] [CROSSREF] [CSA]
- Häußerman , S. , Bailey , A. G. , Bailey , M. R. , Etherington , G. and Youngman , M. 2002 . The influence of breathing patterns on particle deposition in a nasal replicate cast . J. Aerosol Sci. , 33 : 923 – 933 . [CROSSREF] [CSA]
- Hinchcliffe , M. and Illum , L. 1999 . Intranasal Insulin Delivery and Therapy . Adv. Drug Delivery Rev. , 35 : 199 – 234 . [CROSSREF] [CSA]
- Hörschler , I. , Meinke , M. and Schröder , W. 2003 . Numerical Simulation of the Flow Field in a Model of the Nasal Cavity . Comput. Fluids. , 32 : 39 – 45 . [CROSSREF] [CSA]
- Kelly , J. T. , Prasad , A. K. and Wexler , A. S. 2000 . Detailed flow patterns in the nasal cavity . J Appl. Physiol. , 89 : 323 – 337 . [INFOTRIEVE] [CSA]
- Kelly , J. T. , Asgharian , B. , Kimbell , J. S. and Wong , B. A. 2004 . Particle Deposition in Human Nasal Airway Replicas Manufactured by Different Methods. Part 1: Inertial Regime Particles . Aerosol Sci. Technol. , 38 : 1063 – 1071 . [CSA]
- Keyhani , K. , Scherer , P. W. and Mozell , M. M. 1995 . Numerical Simulation of Airflow in the Human Nasal Cavity . J. Biomech. Eng. , 117 : 429 – 441 . [INFOTRIEVE] [CSA]
- Kublik , H. and Vidgren , M. T. 1998 . Nasal Delivery Systems and Their Effect on Deposition and Absorption . Adv. Drug Delivery Rev. , 29 : 157 – 177 . [CROSSREF] [CSA]
- Lippman , M. , Yeates , D. B. and Albert , R. E. 1993 . Deposition, Retention and Clearance of Inhaled Particles . Br. J. Ind. Med. , 37 : 337 – 362 . [CSA]
- Maccinnes , J. M. and Bracco , F. V. 1992 . Stochastic particle dispersion modelling and the tracer-particle limit . Phys Fluids , 4 ( 12 ) : 2809 – 2824 . [CROSSREF] [CSA]
- Morsi , S. A. and Alexander , A. J. 1972 . An Investigation of Particle Trajectories in Two-Phase Flow Systems . J. Fluid Mech. , 55 ( 2 ) : 193 – 208 . [CROSSREF] [CSA]
- Newman , S. P. , Moren , F. and Clarke , S. W. 1998 . Deposition Pattern of Nasal Sprays in Man . Rhinology , 26 : 111 – 120 . [CSA]
- Shih , T.-H. , Liou , W. W. , Shabbir , A. , Yang , Z. and Zhu , J. 1995 . A New k-ϵ Eddy Viscosity Model for High Reynolds Number Turbulent Flows . Comput. Fluids , 24 : 227 – 238 . [CROSSREF] [CSA]
- Suman , J. D. , Laube , B. L. , Lin , T. C. , Brouet , G. and Dalby , R. 2002 . Validity of In Vitro Tests on Aqueous Spray Pumps as Surrogates for Nasal Deposition . Pharma Res. , 19 : 1 – 6 . [CROSSREF] [CSA]
- Swift , D. L. 1991 . Inspiratory Inertial Deposition of Aerosols in Human Nasal Airway Replicate Casts: Implication for the Proposed NCRP Lung Model . Rad. Prot. Dosimetry , 18 ( 1/3 ) : 29 – 34 . [CSA]
- Tu , J. Y. 2000 . Numerical Investigation of Particle Flow Behavior in Particle-Wall Function . Aerosol Sci. Technol. , 32 : 509 – 526 . [CROSSREF] [CSA]
- Tu , J. Y. , Abu-Hijleh , B. , Xue , C. and Li , C. G. CFD Simulation of Air/Particle Flow in the Human Nasal Cavity . Proceedings of 5th International Conference on Multiphase Flow . Yokohama, Japan. Paper 209
- Wang , Y. and James , P. W. 1999 . On the Effect of Anisotropy on the Turbulent Dispersion and Deposition of Small Particles . Int. J. of Multiphase Flows , 25 : 551 – 558 . [CROSSREF] [CSA]
- Yan , J. , Karanjkar , A. and Branagan , M. 2004 . Dynamic Modelling and Simulation for Nasal Drug Delivery . PMPS-Drug Delivery , : 68 – 71 . August 2004[CSA]
- Yu , G. , Xhang , Z. and Lessmann , R. 1998 . Fluid Flow and Particle Diffusion in the Human Upper Respiratory System . Aerosol Sci. Technol. , 28 : 146 – 158 . [CSA]
- Zhang , Y. , Finlay , W. H. and Matida , E. A. 2004 . Particle Deposition Measurements and Numerical Simulation in a Highly Idealized Mouth-Throat . J. Aerosol Sci. , 35 : 789 – 803 . [CROSSREF] [CSA]
- Zwartz , G. J. and Guilmette , R. A. 2001 . Effect of Flow Rate on Particle Deposition in a Replica of a Human Nasal Airway . Inha. Toxicol. , 13 : 109 – 127 . [CROSSREF] [CSA]