Abstract
This study develops more computationally efficient versions of the TwO-Moment Aerosol Sectional (TOMAS) microphysics algorithms, collectively called “Fast TOMAS.” Several methods for speeding up the algorithm were attempted, but only reducing the number of size sections was adopted. Fast TOMAS models, coupled to the GISS GCM II-prime, require a new coagulation algorithm with less restrictive size resolution assumptions but only minor changes in other processes. Fast TOMAS models have been evaluated in a box model against analytical solutions of coagulation and condensation and in a 3-D model against the original TOMAS (TOMAS-30) model. Condensation and coagulation in the Fast TOMAS models agree well with the analytical solution but show slightly more bias than the TOMAS-30 box model. In the 3-D model, errors resulting from decreased size resolution in each process (i.e., emissions, cloud processing/wet deposition, microphysics) are quantified in a series of model sensitivity simulations. Errors resulting from lower size resolution in condensation and coagulation, defined as the microphysics error, affect number and mass concentrations by only a few percent. The microphysics error in CN70/CN100 (number concentrations of particles larger than 70/100 nm diameter), proxies for cloud condensation nuclei, range from –5% to 5% in most regions. The largest errors are associated with decreasing the size resolution in the cloud processing/wet deposition calculations, defined as cloud-processing error, and range from –20% to 15% in most regions for CN70/CN100 concentrations. Overall, the Fast TOMAS models increase the computational speed by 2 to 3 times with only small numerical errors stemming from condensation and coagulation calculations when compared to TOMAS-30. The faster versions of the TOMAS model allow for the longer, multi-year simulations required to assess aerosol effects on cloud lifetime and precipitation.
Copyright 2012 American Association for Aerosol Research
1. INTRODUCTION
Changes in aerosols that act as cloud condensation nuclei (CCN) since the Industrial Revolution are believed to enhance cloud reflectivity, known as the cloud albedo effect (Twomey Citation1974), and to modify precipitation efficiency and cloud distribution, known as the cloud lifetime effect (Albrecht Citation1989). The effects of aerosols on clouds are among the most uncertain of anthropogenic climate forcings (Solomon et al. Citation2007). These aerosol “indirect effects” are not easily estimated from observations because of natural variability in cloud properties and the lack of observations of the pre-industrial atmosphere. Thus estimations of the impacts of aerosols on global radiative flux change have been mainly based on computer modeling.
Recently, a growing number of global aerosol microphysics models have been developed to improve our understanding of aerosol–cloud interactions and specifically the processes that control CCN concentrations (Adams and Seinfeld Citation2002; Lauer et al. Citation2005; Spracklen et al. Citation2005; Stier et al. Citation2005; Pierce and Adams Citation2006; Pierce et al. Citation2007; Bauer et al. Citation2008; Trivitayanurak et al. Citation2008; Lee et al. Citation2009; Makkonen et al. Citation2009; Yu and Luo Citation2009). Because CCN behavior depends strongly on particle size, these models have included specific treatment of aerosol microphysical processes. These models solve the aerosol general dynamic equation (GDE) that governs how the aerosol size distribution evolves over time as a result of microphysical processes such as nucleation, condensation/evaporation, and coagulation. Accurate and flexible algorithms for solving the GDE are especially necessary to obtain precise number and mass distributions of aerosol particles, although model performance is mostly limited by uncertainties in key inputs. In particular, it appears necessary to treat the microphysics of ultrafine particles in detail since many CCN result from the growth of these particles to CCN sizes (Pierce et al. Citation2007; Spracklen et al. Citation2008; Merikanto et al. Citation2009; Chen et al. Citation2010). Thus it is important for these models to have sufficient size resolution in the size range of particles that contribute the most CCN (Zhang et al. Citation2002; Korhonen et al. Citation2005). For the coarse mode (1 μm < particle diameter <10 μm), detailed microphysics calculations may not be necessary because their growth rates are slow, and their contribution to CCN number concentrations are negligible (Heintzenberg Citation1989; Raes et al. Citation2000).
In general, accurate and flexible algorithms for solving the GDE impose a high computational burden, and this is an important issue in large-scale aerosol transport models that must balance prediction accuracy versus faster computer time. A special challenge is to simulate cloud lifetime effects. Because these simulations perturb the meteorological fields of the global model, long (multi-year) simulations are required to separate the aerosol effect (signal) from chaotic meteorological variability (noise). Methods for solving the GDE differ primarily in how they represent the aerosol size distribution and can be categorized into moment, modal, and sectional approaches. Moments-based approaches track lower-order radial moments of the size distribution, and modal approaches use analytical functions (e.g., lognormal distributions) that represent the several modes of the particle population. Sectional approaches represent a size distribution by predicting the amount of aerosols in several size sections or “bins.” Single-moment sectional approaches typically track either aerosol number or mass in each bin, while two-moment sectional approaches explicitly track both aerosol number (i.e., zeroth moment) and mass (i.e., first moment) in each size section. Two-moment sectional method can conserve both number and mass very accurately (Tzivion et al. Citation1987; Tzivion et al. Citation2001; Adams and Seinfeld Citation2002; Jung et al. Citation2006), whereas single-moment sectional approaches may result in less accurate aerosol number information than two-moment sectional method (Harrington and Kreidenweis Citation1998). The modal and the moments-based approaches are generally more computationally efficient but less accurate than sectional approaches. For example, the sectional approach is shown to be more accurate and flexible when dealing with abrupt transitions in a size distribution occurring during aerosol activation processes (Zhang et al. Citation1999). Thus, even though they are computationally expensive in a global model, their accuracy and flexibility has found several applications in 3-dimensional, global-scale models (Jacobson Citation2001; Adams and Seinfeld Citation2002; Spracklen et al. Citation2005; Trivitayanurak et al. Citation2008; Lee et al. Citation2009). However, their computational requirements limit their use, especially for multi-year simulations that are generally required to study aerosol indirect effects. As a global CCN model, it is important to achieve a computational efficiency as well as an accurate prediction. A variety of techniques are used (moment, modal, and sectional) for a global CCN model, but little systematic work has been done to evaluate accuracy and to compare computational speed of different configurations. This work evaluates the accuracy of different sectional model configurations for the specific purpose of predicting aerosol number distributions and CCN concentrations on a global scale.
The TwO-Moment Aerosol Sectional (TOMAS) aerosol microphysics model has been implemented into the climate model of Goddard Institute for Space Studies General Circulation Model II-prime (GISS GCM II-prime) referred as “GISS-TOMAS” model (Lee and Adams Citation2010), or the GEOS-CHEM model (Trivitayanurak et al. Citation2008), and the regional model PMCAMx, referred as PMCAMx-UF (Jung et al. Citation2010). Modules for each of the major aerosol species have been developed for the GISS GCM, and the GISS-TOMAS model (i.e., TOMAS-30 model in the paper) have been evaluated with ground-level measurements such as number and mass concentrations, deposition fluxes, and remote sensing observations (Adams and Seinfeld Citation2002; Pierce and Adams Citation2006; Pierce et al. Citation2007; Lee et al. Citation2009; Lee and Adams Citation2010). Coagulation and condensation in the original TOMAS model have been evaluated against analytical solutions and have shown excellent agreement (Jung et al. Citation2010). This feature makes the TOMAS model an excellent tool for the aerosol indirect effect study. However, the TOMAS model dominates the computational time of the GISS-TOMAS model that is mostly due to the microphysics and tracer transport.
The goal of this work is to develop more computationally efficient versions of the TOMAS model (hereafter, Fast TOMAS) while still maintaining acceptable accuracy. Section 2 includes the original TOMAS model description, and Section 3 explains the methods used to develop the Fast TOMAS models. Section 4 shows results of box model evaluation of Fast TOMAS models against analytical solutions of coagulation and condensation. Section 5 evaluates Fast TOMAS against the original TOMAS model in the context of a global, 3-D model and analyzes sources of error in this comparison. Section 6 is a summary and discussion of this study.
TABLE 1 Configurations of size resolution in TOMAS-30, TOMAS-15, and TOMAS-12
2. ORIGINAL TOMAS MODEL DESCRIPTION
Based on earlier algorithms for treating cloud microphysics (Tzivion et al. Citation1987; Citation1989), the TOMAS global microphysics model was adapted for aerosols by Adams and Seinfeld (Citation2002) and was incorporated into the GISS GCM II-prime. The GISS GCM II-prime has horizontal grid dimensions of 4° latitude by 5° longitude and vertical grid dimensions of 9 vertical layers covering the troposphere and the stratosphere to the 10-hPa level (Hansen et al. Citation1983). Adams and Seinfeld (Citation2002) provide a detailed description of the TOMAS model, and Lee and Adams (Citation2010) provide most updated description of its implementation into the GISS GCM. Here, its important features are briefly summarized. The “TwO-Moment” refers to the two moments of the aerosol size distribution tracked for each size bin, total aerosol number, and mass concentrations for each aerosol species, to predict the aerosol number and mass size distributions (Tzivion et al. Citation1987; Citation1989) and, therefore, represents a highly accurate and flexible description of aerosol microphysics.
The original model has thirty size sections (hereafter, TOMAS-30) with the lower boundary of the smallest size bin being 10−21 kg dry mass per particle, and each successive boundary has twice the mass of the previous boundary (so-called “mass doubling”). For typical aerosol densities, the TOMAS-30 size distribution therefore ranges approximately from 10 nm to 10 μm in dry diameter. The model tracks 9 quantities for each size bin: total number of aerosol particles, sulfate mass, sea-salt mass, mass of pure (externally mixed) elemental carbon, mass of internally mixed elemental carbon, mass of hydrophobic organic matter, mass of hydrophilic organic matter, mineral dust mass, and aerosol water mass. The model includes aerosol microphysics processes, such as condensation of sulfuric acid, coagulation, nucleation and in-cloud oxidation, and size-resolved emissions and deposition. Sulfuric acid concentrations used for the nucleation and condensation rates are solved simultaneously with the pseudo-steady state assumption (Pierce and Adams Citation2009a), and the growth of nucleated particles up to the first size bin, a diameter of 10 nm, is taken into account using the parameterization of Kerminen et al. (2004). Details of the TOMAS model for sulfate (Adams and Seinfeld Citation2002), sea-salt (Pierce and Adams Citation2006), carbonaceous aerosols (Pierce et al. Citation2007), and mineral dust (Lee et al. Citation2009) have been described elsewhere, but a brief description of aerosol emission used for this work is provided here. Primary sulfate is assumed to be 1% of anthropogenic sulfur emissions and to be emitted in 2 modes; 15% of the mass to have a lognormal distribution with a number median diameter (NMD) of 10 nm and a geometric standard deviation (GSD) of 1.6 and 85% of the mass to have a lognormal distribution with a NMD of 70 nm and a GSD of 2 (Adams and Seinfeld Citation2002). Emissions from fossil fuel, biofuel, and biomass burning are based on Bond et al. (Citation2004), and 1.8 is used as the conversion of organic carbon mass to organic matter (Pierce et al. Citation2007). The size distribution of biofuel and biomass burning carbonaceous emission follows a lognormal distribution with a NMD of 100 nm and a GSD of 2, and, for fossil fuel, a lognormal distribution with a NMD of 30 nm and a GSD of 2 is assumed (Pierce et al. Citation2007). Sea-salt emissions are based on the emissions parameterization of Clarke et al. (Citation2006). Note that mineral dust is excluded in this work because the dust emission parameterization cannot produce the same emission rate when reducing size bins. With mineral dust, it would be problematic to estimate “emission error” (Section 5.1).
Description of wet deposition and dry deposition can be found in Adams and Seinfeld (Citation2002) and Lee et al. (Citation2009). Briefly wet deposition occurs in large-scale (stratiform) and convective clouds that are assumed to have a supersaturation of 0.2% and 1.0%, respectively. For in-cloud scavenging, modified Köhler theory is used to determine the activation diameter for the critical supersaturation, and particles larger than the activation diameter are activated and subject to nucleation scavenging (Lee et al. Citation2009). Note that in-cloud scavenging is applied to internally mixed elemental carbon but not to externally mixed elemental carbon. When the activation diameter is intermediate between the size boundaries, the fraction of particles activated in the bin is determined by linear interpolation within the activating size boundaries (i.e., dry aerosol mass). For aerosol activation, all aerosols are treated as internally mixed except for pure elemental carbon. Dry deposition uses the resistance-in-series approach that treats a size-dependent gravitational settling of particles and a size-dependent resistance in the quasi-laminar sublayer. Aerodynamic resistances are calculated as a function of GCM surface momentum and heat fluxes. No surface resistance is assumed for aerosol species.
3. FAST TOMAS
The computational burden of GISS-TOMAS mostly results from the 2-moment sectional approach that uses thirty size bins (e.g., about 5.6 days for a 1-month simulation with TOMAS-30 using a 250 MHz single processor of an SGI Origin 2000). To speed computations, the number of size bins is reduced with the following manner as shown in . First, the TOMAS-15 model is developed by merging each 2 adjacent bins in the original TOMAS model, thereby decreasing the number of size bins to fifteen. Second, we take advantage of the fact that coarse particles have slow microphysics and do not contribute much to CCN concentrations and, thus, we decrease the size resolution of the coarse mode further to 2 bins and call this model version “TOMAS-12.”
With these new size resolutions, several aerosol processes need to be changed: aerosol emissions, deposition, in-cloud scavenging, aqueous oxidation, and microphysical processes (condensation and coagulation). Except coagulation, most processes require minor changes or are straightforward to implement. However, the coagulation scheme used in the original TOMAS-30 model is based on Tzivion et al. (Citation1987), in which the stochastic collection equation is reduced to a set of moment equations for each size section using 2 moments, Nk (the total number of aerosol particles in the k-th size bin) and Mk (the mass of aerosol particles in the k-th size bin), that are presented in Equations (1) to (4) in Adams and Seinfeld (Citation2002). These equations for TOMAS-30 assume mass doubling size boundaries, which simplifies the coagulation equation by eliminating self-coagulation in a size bin, defined here as the coagulation of 2 particles from the same size section to form a particle with mass in the original size section (Tzivion et al. Citation1987). For the TOMAS-15 model, a new set of equations for coagulation rate must be obtained using mass quadrupling section boundaries and are based on Tzivion et al. (Citation1999; Citation2001). The basic approach is quite similar to that applied to TOMAS-30, and Equations (1) and (2) show how aerosol number (Nk) and mass (Mk) evolve with time in the TOMAS-15 model.
The coagulation kernel, Kk ,i, is calculated using the same methods as Adams and Seinfeld (Citation2002). In brief, only Brownian diffusion is accounted for in the coagulation kernel using the particle diffusivity based on the Stokes-Einstein formula, and the correction factor for the transition and kinetic regime is based on Dahneke (Citation1983). The kernel is recalculated at every grid cell and time step using the average hydrated particle sizes in bins k and i.
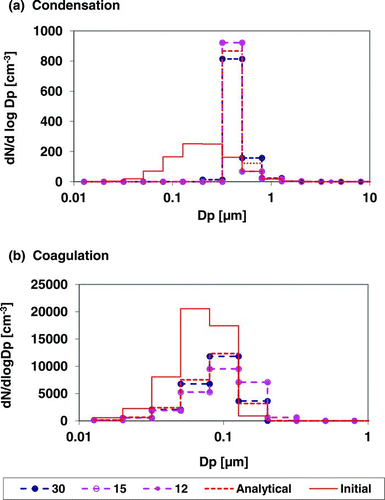
FIG. 1 Evolution of the number size distribution predicted by the TOMAS-30, TOMAS-15, and TOMAS-12 box models, compared against the analytical solutions for (a) condensation and (b) coagulation after 1 h. To facilitate a direct evaluation of the newer algorithms, the analytical and TOMAS-30 results have been gridded to the coarser resolution of TOMAS-15. Details of the initial size distributions and other input parameters are available in Section 4. Note that the results from TOMAS-15 and TOMAS-12 are identical and thus the lines representing 2 models are overlapped. (Color figure available online.)
Besides reducing the number of size bins, we explored other methods for decreasing computational time that turned out to be unsuccessful. First, a Runge-Kutta solver was tried in the coagulation module, which is a more advanced numerical technique than the first-order Euler method in the original TOMAS model. However, use of Runge-Kutta increased the computational burden. This was because the Runge-Kutta method requires 4 iterations in a time step. The original model used an adaptive time step, but coagulation is slow enough in most grid boxes (in the GISS global model) so only a single iteration was required most of the time. Second, a look-up table for the coagulation kernel, which is a function of pressure, temperature, particle mass, and particle density, was tried but, unexpectedly, did not improve the model speed. Other aerosol microphysical models typically implement a look-up table for the coagulation kernel and find that it improves computational speed. Our model uses the correction factor based on Dahneke (Citation1983), while a more complex form based on Fuchs (Citation1964) is more commonly used. The choice of simpler form for the correction factor may explain why the look-up table method was not successful.
4. BOX MODEL EVALUATION VERSUS ANALYTICAL SOLUTIONS
New TOMAS-15 and TOMAS-12 models are tested in box models against analytical solutions. Condensation and coagulation in TOMAS-12 and TOMAS-15 models as well as the original TOMAS-30 are evaluated against analytical solutions. The analytical solution for condensation (Seinfeld and Pandis Citation1998, pp. 654–655) assumes an initially lognormal size distribution and a constant concentration gradient of the condensing gas between the surface of particles and the bulk gas phase. The initial particle size distribution has a geometric mean diameter of 200 nm, a geometric standard deviation of 2, and the initial number concentration of 203 cm−3. The following assumptions for condensation are used: constant pressure difference, 10−10 atm; temperature of 298 K; molecular weight of 100 g mol−1; particle density of 1.0 g cm−3; particle diffusivity of 0.1 cm2 s−1; ideal gas constant of 82.06 cm3 atm K−1 mol−1. a shows the comparison of initial and predicted aerosol number size distributions after 1 h of condensation. Because the 2-moment algorithms incorporate a conservation equation for aerosol number concentrations, total number concentrations predicted by all TOMAS models are conserved exactly. The difference in total mass concentration among models is less than 1% (not shown). Compared to the analytical solution, TOMAS-30 captures the correct location and magnitude of the peak of the size distribution as do TOMAS-15 and TOMAS-12 models. However, the new models show slightly less growth after 10 min of condensation (not shown), which means that the number of particles smaller than the peak of the size distribution in the new models is ∼10% higher than the TOMAS-30 model.
The analytical solution for coagulation (Seinfeld and Pandis Citation1998, pp. 678–679) requires a size-independent coagulation coefficient to solve the continuous coagulation equation. The comparison of number size distributions evolved by coagulation during 1 h is shown in b. The initial particle size distribution is assumed to have a number concentration of 104 cm−3 and volume of 2.6808 μm3 with coagulation kernel of 5 × 10⁻⁸cm3 s−1. The difference in total number concentration predicted by the TOMAS models and the analytical solution is less than 5%, and the difference in TOMAS-12 and TOMAS-15 models and TOMAS-30 model is less than 0.4% (for mass, 0.02%; not shown). TOMAS-30 model shows excellent agreement to the analytical solution as shown in Jung et al. (Citation2006). However, the TOMAS-15 and TOMAS-12 models show slightly faster coagulational growth.
Although the coagulation calculation in TOMAS-15 and TOMAS-30 perform reasonably well, some aspects of the comparison are artificial. First, the initial size distribution is somewhat narrow, and it is expected that the coarse size resolution in TOMAS-15 and TOMAS-12 will show higher errors as the width of initial size distribution is narrower. Second, the analytical solution requires a physically unrealistic constant coagulation coefficient. Therefore, the comparisons are repeated using as inputs lognormal distributions with number mean diameter of 30 nm but varying their standard deviations (σ) from 1.2 to 2.0, and 1-h coagulation is applied. Initially, total number concentration is set to 105 cm−3. In this test, only TOMAS-30 and TOMAS-15 models are compared with each other by using size-dependent coagulation coefficient because the number predictions from TOMAS-12 model are identical to those from TOMAS-15 model. In , the TOMAS-15 and TOMAS-30 models predict the same magnitude and location for the peaks in the number size distributions after 1 h of coagulation but different number concentration at each size bin. The difference in total number concentration between TOMAS-30 and TOMAS-15 in the 3 cases is much less than 1%. The maximum difference of number concentration at each size bin between TOMAS-30 and TOMAS-15 after 1-h coagulation is observed for σ of 1.2, and is approximately a factor of 4, but it has little contribution to total number concentration. The maximum difference at each size bin is reduced to approximately 50% and 10% for σ = 1.5 and σ = 2.0, respectively. The difference in number concentration at each bin can be as large as 7%, 4%, and 1% of total number concentration for σ of 1.2, σ of 1.5, and σ of 2.0, respectively. These tests imply that TOMAS-15 and TOMAS-12 may introduce greater numerical error when dealing with a narrow size distribution. However, the test conditions used here are, in fact, rather extreme compared to the ambient atmosphere, where the narrow number size distributions (i.e., σ of 1.2) are quite unusual in ambient air. Overall, the Fast TOMAS models show good agreement against the analytical solutions and TOMAS-30 model with larger errors under some specific conditions.
FIG. 2 Number size distributions predicted by the TOMAS-30 and TOMAS-15 box models using a size-dependent coagulation kernel after 1-h coagulation. Note that initial number size distribution is assumed to be lognormal with a geometric mean diameter of 30 nm and geometric standard deviations varied from 1.2 to 2.0 (σ = 1.2 for a, σ = 1.5 for b, and σ = 2.0 for c). The initial total number concentration is 105 cm−3. (Color figure available online.)
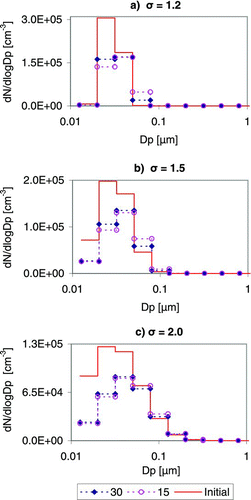
FIG. 3 Global distribution of emission error of CN10, CN70, and CN100. Emission error is defined as errors resulting from decreasing the size resolution in the emission process and is estimated by calculating the ratio of CAD-30 to CAD-30–30EMIS. Note that the value on the top right of each figure is a global average of the errors displayed in the map. (Color figure available online.)
5. 3-D MODEL EVALUATION
5.1. Sources of Error in the TOMAS-15 and TOMAS-12 Models
The accuracy of the Fast TOMAS models has also been evaluated against the TOMAS-30 model in the context of a global model, the GISS GCM II-prime. For the Fast TOMAS models coupled with GISS GCM, all size-resolved processes must be changed to accommodate lower size resolutions in TOMAS-15 and TOMAS-12 models: emissions, cloud processing, deposition, as well as aerosol microphysics (i.e., condensation and coagulation). With a lower size resolution, any error associated with a size-resolved process will necessarily increase. In this section, the overall errors associated with changing the size resolution are separated into 4 process-specific errors (). First, errors resulting from lowering the size resolution of emitted particles are defined as “emission error.” Second, errors from reducing the size resolution used in cloud processing and wet deposition, calculated “online (during the simulations)” in the model, are defined as “cloud-processing error.” Third, errors in CCN concentrations at 0.2% supersaturation (CCN(0.2%)) concentrations resulting from lower size resolution in CCN calculation is defined as “offline CCN error.” Although CCN concentrations are calculated during the model simulations for purposes of wet deposition, these are not saved as output. Therefore, CCN(0.2%) concentrations in TOMAS models are calculated after the model simulations are complete based on monthly average aerosol size and composition distributions. Therefore, this “offline” CCN error is separated from cloud-processing error, even though both have similar sources. It is important to mention that the activation process required for cloud-processing, wet deposition, and offline CCN calculation is based on modified Köhler theory that is explained in Section 2 but more detailed explanation can be found in Lee et al. (Citation2009). Fourth, errors directly associated with using lower size resolution in TOMAS-15 and TOMAS-12 to calculate condensation and coagulation rates are defined as microphysics error. Included in the “microphysics” errors are feedbacks to nucleation rates. The TOMAS modules use the pseudo-steady state approximation (Pierce and Adams Citation2009a), which assumes that sources and sinks of sulfuric acid vapor are approximately in balance. Changes in model size resolution necessarily affect the condensational sink and sulfuric acid concentrations, causing differences in nucleation rates as well as the growth of nucleated particles up to the first size bin.
TABLE 2 Description of process-specific errors and simulations used to estimate the error
TABLE 3 Descriptions of simulations used in this study
FIG. 4 Global distribution of number concentration (CN10) and mass concentrations for sulfate, sea-salt, and organic matter (shown in the 1st column) and their microphysics errors (shown in 2nd and 3rd columns) in the lowermost vertical layer. Microphysics error is defined here as errors resulting from lower size resolution used to calculate coagulation and condensation rates and is estimated by making a ratio of CAD-15 to CAD-30 (and CAD-12 to CAD-30). Note that the upper limit on the color bar is different from those in other figures because the maximum error in this figure () exceeds that limit and the value on the top right of each figure in 2nd and 3rd column is a global average of the errors displayed in the map. (Color figure available online.)
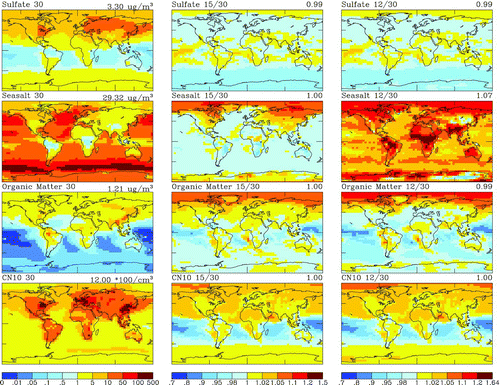
FIG. 5 Global distribution of microphysics error of surface layer (a) CN70, and (c) CN100, and cloud-processing error of (b) CN70, and (d) CN100, respectively. Note that the cloud-processing error is defined here as errors resulting from lower size resolution used in wet deposition and cloud processing and is estimated by making a ratio of KOH-15 to KOH-30 and then by subtracting microphysics error. Note that the lower limit on the color bar is different from those in other figures because the minimum error in this figure () exceeds that limit and the value on the top right of each figure is a global average of the errors displayed in the map. (Color figure available online.)
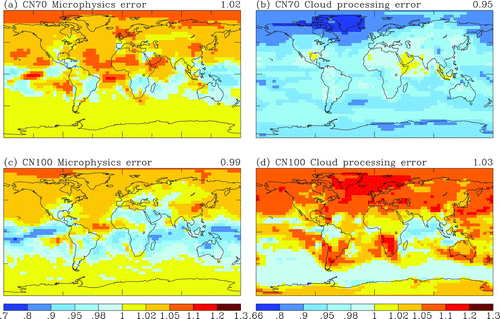
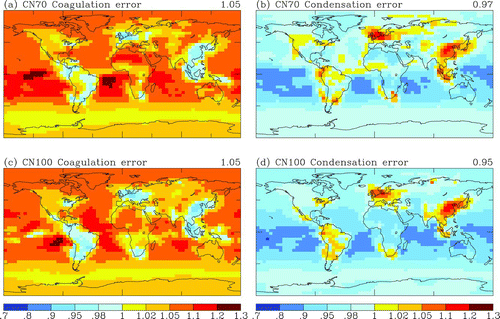
FIG. 6 Global distribution of coagulation and condensation errors of surface layer CN70, (a) to (b), and surface layer CN100, (c) to (d), respectively. Coagulation error is calculated by making a ratio of CAD-15 to CAD-15–30COAG, and the condensation error is obtained using CAD-15–30COAG and CAD-30. Note that the value on the top right of each figure is a global average of the errors displayed in the map. (Color figure available online.)
Lastly, model size resolution will affect dry deposition rates and below-cloud scavenging rates because these processes are size-resolved as explained in Adams and Seinfeld (Citation2002). Dry deposition is important for coarse mode particles, and shows a noticeable change in sea-salt mass from TOMAS-15 to TOMAS-12 (Section 5.2). Aerosol number concentrations are not strongly affected because dry deposition rates are slow for the accumulation mode particles that contribute most to CCN number. Similarly, errors in below-cloud scavenging rates from a lower size resolution are expected to have little impact on CCN particles because this is not efficient to remove particles in accumulation mode.
Various simulation scenarios used to isolate these errors in this paper are summarized in . The simulations are named according to what size resolution is used for various processes and how aerosol activation is treated. KOH means that modified Köhler theory was used for cloud processing and wet deposition as is the case in the TOMAS-30 model. In contrast to KOH, constant activation diameter (CAD) is used to exclude cloud-processing errors; the activation diameter is set to ∼30 nm for convective clouds and to ∼70 nm for large-scale clouds. To ensure identical emissions inputs, all simulations (except CAD-30–30EMS) use emission inventories with fifteen bins that give the same total number and aerosol mass as the original thirty emission inventories. To assess the effect of using coarser emissions inventories, CAD-30–30EMS uses the original thirty-bin emissions inventories. To separate errors in condensation rates from coagulation rates, the CAD-15–30COA uses thirty-bin coagulation by redistributing N k and M k into thirty bins but keeps fifteen bins for condensation.
Appropriate pairs of simulations are used to estimate each process-specific error with their number or mass concentrations (see third column in ). All types of error except the offline CCN error are based on total aerosol number (defined as CN10, number of particles larger than 10 nm in diameter), CN70 (same but for 70 nm in diameter), and CN100 (same but for 100 nm in diameter). CN70 and CN100 are chosen to reflect typical critical diameters for particles to activate, especially for stratiform clouds with supersaturations of ∼0.2%.
5.2. 3-D Model Evaluation of Fast TOMAS
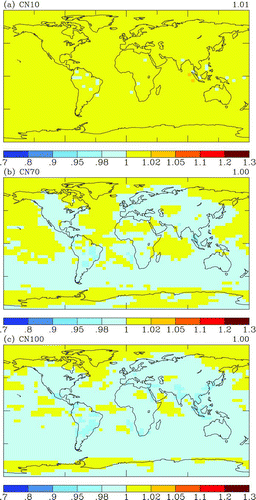
Three-dimensional simulations using TOMAS-15 and TOMAS-12 in a global model are evaluated against the TOMAS-30 model. Here, we report simulation results from a 3-month average from March to May after discarding 3 months of model spin-up. A 3-month simulation is preferred to a 1-year simulation to save computational time and because the numerical errors are very similar month to month. shows the emission error caused by changing the emissions size resolution from thirty bins to fifteen bins but otherwise using the higher, thirty-bin resolution for all other processes. Emissions-related errors are approximately within ±2% for CN10, CN70, and CN100 predictions in most of the regions as shown in .
Three-month averages of mass of sulfate, sea-salt, organic matter, and number concentration (CN10) in the lowermost vertical layer are compared in TOMAS-30, TOMAS-15, and TOMAS-12 models (i.e., a ratio of aerosol number and mass of CAD-15 or CAD-12 to CAD-30) in . Except for sea-salt mass, all differences shown in are due primarily to the purely numerical “microphysics” error of using fewer size bins for condensation and coagulation. Sulfate mass concentrations and CN10 number concentration in TOMAS-15/TOMAS-12 show very similar results (within ±5% in most regions) to TOMAS-30. Sea-salt mass concentrations show large changes in TOMAS-12 that are mostly caused by differences in the last size bin, i.e., particles larger than ∼3 μm. Unlike sulfate and carbonaceous aerosols, significant numbers of sea-salt particles are found in the coarse mode, where dry deposition is the main removal process. Since dry deposition is a strong function of particle size, a different mean diameter at coarse bins results in very different dry deposition rates. As a result, errors in sea-salt mass concentrations are larger than for sulfate or carbonaceous aerosol for TOMAS-12, which uses only 2 size bins in the coarse mode. In , microphysics errors display some latitude patterns: negative errors near the equatorial regions for OM and CN10, and increasing errors from mid- to high-latitude regions in Northern Hemisphere for all species except sulfate. As supplementary materials (see online supplemental information), the global distributions of the microphysics errors of the column averaged CN10 and aerosol mass concentrations, which is same as but for the column average, are presented. Note that this figure has a different color bar to to accommodate a larger error in sea-salt column concentrations.
All simulations here use a binary nucleation parameterization (Vehkamaki et al. Citation2002), and the global average nucleation rates in the Fast TOMAS models are ∼15% lower than TOMAS-30. in Pierce and Adams (Citation2009b) shows that the model CN10 concentrations at several measurements sites are changed little when the binary nucleation rate is reduced by 10 times. Thus, the error in CN10 concentrations in the lowermost vertical layer should be mostly due to condensation and coagulation error. However, the error in CN10 concentrations increases with altitude. For example, at ∼320 mbar (corresponding to the 6th layer in the model), where nucleation contributes most CN10 concentrations, the errors increase to ∼20% in most locations (not shown). Overall, the column CN10 concentration in TOMAS-15 and TOMAS-12 is ∼7% lower than TOMAS-30 in the global average (not shown).
presents microphysics error in CN70 and CN100 concentrations (CAD-30 versus CAD-15) and cloud-processing error (KOH-30 versus KOH-15 but subtracting microphysics error). Globally averaged, microphysics error in TOMAS-15 for CN70 at the surface is about 2% and varies regionally from −2% to 5%. Global average cloud-processing error is approximately −5% and varies from −2% to −20% in most regions. Similarly, for CN100, global-average of microphysics error is less than –1% (ranging from −5% to 5% in most regions) and that of cloud-processing error is about 3% (ranging from −2% to 15% in most regions). The microphysics error (∼±5%) is acceptable and is smaller than cloud-processing errors. The conditions used for all simulations here are somewhat unrealistic because the binary nucleation parameterization underpredicts nucleation rates in the planetary boundary layer (Clarke et al. Citation1998; Spracklen et al. Citation2006), and the simulations lack secondary organic aerosol (SOA) production. Although one might expect that the numerical errors depend on conditions, the shorter simulations are performed with 19 Tg yr−1 of biogenic SOA and a ternary nucleation parameterization (Napari et al. Citation2002) with a tuning factor of 1 × 10⁻⁵ to reproduce boundary layer nucleation rates (Jung et al. Citation2010). These results show that numerical errors in CN10 and CN100 concentrations resulting from differences in the microphysical calculations are quite similar to those shown here.
FIG. 7 Global distribution of offline CCN error of CCN(0.2%) in the lowermost vertical layer. Offline CCN error is defined here as errors resulting from decreasing size resolution used to calculate the CCN(0.2%) concentration and is based on aerosol fields from CAD-30 (see Section 5.1 for more details). Note that the value on the top right of each figure is a global average of the errors displayed in the map. (Color figure available online.)
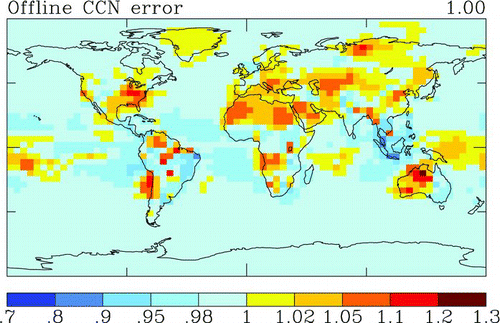
As shown in , when microphysics error is divided into coagulation and condensation errors, globally averaged coagulation errors for CN70 and CN100 are 5% (locally as large as 30%), and globally averaged condensation errors for CN70 and CN100 are 3% and 5% (locally as large as 20%). Note that shows a strong anti-correlation between errors resulting from condensation and coagulation such that the numerical microphysics error turns out to be much smaller than either of them. shows global-average of the offline CCN error, and CCN(0.2%) is affected from –5% to +10% in region.
For computational efficiency, the TOMAS-15 and TOMAS-12 models are approximately 2 and 3 times faster than the TOMAS-30 model, respectively. Numerical errors (i.e., microphysics errors) increased by the fast TOMAS models are ∼±5%, which is considered to be small compared to other process-specific errors.
6. SUMMARY AND CONCLUSIONS
A fast and efficient version of the TOMAS global microphysics model has been developed (Fast TOMAS). To reduce the computational burden, several techniques were applied, but an advanced numerical solver and a look-up table for the coagulation kernel were unsuccessful. Reducing the number of size bins from thirty to fifteen or twelve was adopted as the most successful methods. This method requires the implementation of a new coagulation scheme for TOMAS-15 and TOMAS-12 models because the coagulation scheme used is based on mass doubling size resolution in TOMAS-30 model (Section 3). New coagulation and condensation schemes for Fast TOMAS models have been evaluated in a box model against analytical solutions. The box model evaluation shows that both condensation and coagulation in TOMAS-15 and TOMAS-12 models introduce less than 1% error in total number and mass concentrations and errors of a few percent for any given size bin after 1-h microphysical process. For coagulation, the Fast TOMAS models might have moderately large error with very narrow size distributions, although these should not be frequently observed in ambient atmosphere.
Fast TOMAS models are coupled to the GISS GCM II-prime model and are evaluated against the TOMAS-30 model as a benchmark. We separate errors associated with using a more coarse size resolution into those associated with specific aerosol processes: condensation, coagulation, emissions, and activation/cloud processing. Microphysics errors in aerosol mass are negligible except for sea-salt particles. The noticeable errors in sea-salt mass concentrations can be ascribed to errors in calculating dry deposition rates of supermicron particles at coarser size resolution. Similar to CN10 concentrations, microphysics errors in CN70 and CN100 concentrations in the lowermost vertical layer, proxies for CCN(0.2%), are less than 5% in most regions. However, CN10 concentrations at high altitude are moderately influenced by model size resolution through changing nucleation rates and thus the growth of nucleated particle to the first bin, which reflects the importance of adequate size resolution when the model performs nucleation studies. In conclusion, the Fast TOMAS models coupled with GISS GCM II-prime are 2 to 3 times faster and introduce numerical errors of only a few percent more in most quantities of interest, such as CCN(0.2%), compared to the original TOMAS-30 model. The computational time for TOMAS models running in the GISS GCM II-prime is roughly proportional to the number of tracers. This improvement makes sense because the computing time for microphysics and transport of aerosol tracers are proportional – the computational burden for coagulation is approximately proportional to the number of bins to the second power. This allows the Fast TOMAS models to find wider applications such as multi-year simulations for investigating aerosol-precipitation interactions.
uast_a_643259_sup_22934072.zip
Download Zip (958.6 KB)Acknowledgments
This study was supported by the Environmental Protection Agency (EPA STAR Award 83337401).
[Supplementary materials are available for this article. Go to the publisher's online edition of Aerosol Science and Technology to view the free supplementary files.]
Related Research Data
REFERENCES
- Adams , P. J. and Seinfeld , J. H. 2002 . Predicting Global Aerosol Size Distributions in General Circulation Models . J. Geophys. Res. , 107 : 1 – 23 . doi:10.1029/2001JD001010
- Albrecht , B. A. 1989 . Aerosols, Cloud Microphysics, and Fractional Cloudiness . Science , 245 : 1227 – 1230 .
- Bauer , S. E. , Wright , D. L. , Koch , D. , Lewis , E. R. , McGraw , R. Chang , L. S. 2008 . MATRIX (Multiconfiguration Aerosol TRacker of mIXing state): An Aerosol Microphysical Module for Global Atmospheric Models . Atmos. Chem. Phys. , 8 : 6003 – 6035 .
- Bond , T. C. , Streets , D. G. , Yarber , K. F. , Nelson , S. M. , Woo , J. H. and Klimont , Z. 2004 . A Technology-Based Global Inventory of Black and Organic Carbon Emissions from Combustion . J. Geophys. Res.-Atmos. , 109 : 43 doi:10.1029/2003JD003697
- Chen , W. T. , Lee , Y. H. , Adams , P. J. , Nenes , A. and Seinfeld , J. H. 2010 . Will Black Carbon Mitigation Dampen Aerosol Indirect Forcing? . Geophys Res. Lett. , 37 : 5 doi:10.1029/2010GL042886
- Clarke , A. D. , Davis , D. , Kapustin , V. N. , Eisele , F. , Chen , G. Paluch , I. 1998 . Particle Nucleation in the Tropical Boundary Layer and its Coupling to Marine Sulfur Sources . Science , 282 : 89 – 92 .
- Clarke , A. D. , Owens , S. R. and Zhou , J. C. 2006 . An Ultrafine Sea-Salt Flux from Breaking Waves: Implications for Cloud Condensation Nuclei in the Remote Marine Atmosphere . J. Geophys. Res. , 111 : 14 doi:10.1029/2005JD006565
- Dahneke , B. 1983 . “ Simple Kinetic Theory of Brownian Diffusion in Vapors and Aerosols ” . In Topics in Current Aerosol Research (Part 2) , Edited by: Hidy , G. M. and Brock , J. R. 201 – 376 . New York : Pergamon .
- Fuchs , N. A. 1964 . Mechanics of Aerosols , New York : Pergamon .
- Hansen , J. , Russell , G. , Rind , D. , Stone , P. , Lacis , A. Lebedeff , S. 1983 . Efficient 3-Dimensional Global-Models for Climate Studies: Model-I and Model-II . Mon. Weather Rev. , 111 : 609 – 662 .
- Harrington , D. Y., and Kreidenweis , S. M. 1998 . Simulations of Sulfate Aerosol Dynamics – Part II: Model Intercomparison . Atmos. Environ. , 32 : 1701 – 1709 .
- Heintzenberg , J. 1989 . Fine Particles in the Global Troposphere: A Review . Tellus B-Chem. Phys. Meteorol. , 41 : 149 – 160 .
- Jacobson , M. Z. 2001 . GATOR-GCMM: A Global- through Urban-Scale Air Pollution and Weather Forecast Model 1: Model Design and Treatment of Subgrid Soil, Vegetation, Roads, Rooftops, Water, Sea Ice, and Snow . J. Geophys. Res. , 106 : 5385 – 5401 .
- Jung , J. , Fountoukis , C. , Adams , P. J. and Pandis , S. N. 2010 . Simulation of In Situ Ultrafine Particle formation in the Eastern United States using PMCAMx-UF . J. Geophys. Res. , 115 : 13 doi:10.1029/2009JD012313
- Jung , J. G. , Adams , P. J. and Pandis , S. N. 2006 . Simulating the Size Distribution and Chemical Composition of Ultrafine Particles during Nucleation Events . Atmos. Environ. , 40 : 2248 – 2259 .
- Kerminen , V. M. , Anttila , T. , Lehtinen , K. E. J. and Kulmala , M. 2004 . Parameterization for Atmospheric New-Particle Formation: Application to a System Involving Sulfuric Acid and Condensable Water-Soluble Organic Vapors . Aerosol Science and Technology , 38 : 1001 – 1008 .
- Korhonen , H. , Kerminen , V. M. , Lehtinen , K. E. J. and Kulmala , M. 2005 . CCN Activation and Cloud Processing in Sectional Aerosol Models with Low Size Resolution . Atmos. Chem. Phys. , 5 : 2561 – 2570 .
- Lauer , A. , Hendricks , J. , Ackermann , I. , Schell , B. , Hass , H. and Metzger , S. 2005 . Simulating Aerosol Microphysics with the ECHAM/MADE GCM – Part I: Model Description and Comparison with Observations . Atmos. Chem. Phys. , 5 : 3251 – 3276 .
- Lee , Y. H. and Adams , P. J. 2010 . Evaluation of Aerosol Distributions in the GISS-TOMAS Global Aerosol Microphysics Model with Remote Sensing Observations . Atmos. Chem. Phys. , 10 : 2129 – 2144 .
- Lee , Y. H. , Chen , K. and Adams , P. J. 2009 . Development of a Global Model of Mineral Dust Aerosol Microphysics . Atmos. Chem. Phys. , 9 : 2441 – 2458 .
- Makkonen , R. , Asmi , A. , Korhonen , H. , Kokkola , H. , Jarvenoja , S. Raisanen , P. 2009 . Sensitivity of Aerosol Concentrations and Cloud Properties to Nucleation and Secondary Organic Distribution in ECHAM5-HAM Global Circulation Model . Atmos. Chem. Phys. , 9 : 1747 – 1766 .
- Merikanto , J. , Spracklen , D. V. , Mann , G. W. , Pickering , S. J. and Carslaw , K. S. 2009 . Impact of Nucleation on Global CCN . Atmos. Chem. Phys. , 9 : 8601 – 8616 .
- Napari , I. , Noppel , M. , Vehkamaki , H. and Kulmala , M. 2002 . Parametrization of Ternary Nucleation Rates for H2SO4-NH3-H2O Vapors . J. Geophys. Res. , 107 ( 6 ) doi:10.1029/2002JD002132
- Pierce , J. R. and Adams , P. J. 2006 . Global Evaluation of CCN Formation by Direct Emission of Sea Salt and Growth of Ultrafine Sea Salt . J. Geophys. Res. , 111 ( 16 ) doi:10.1029/2005JD006186
- Pierce , J. R. and Adams , P. J. 2009a . A Computationally Efficient Aerosol Nucleation/Condensation Method: Pseudo-Steady-State Sulfuric Acid . Aerosol Sci. Technol. , 43 : 216 – 226 .
- Pierce , J. R. and Adams , P. J. 2009b . Uncertainty in Global CCN Concentrations from Uncertain Aerosol Nucleation and Primary Emission Rates . Atmos. Chem. Phys. , 9 : 1339 – 1356 .
- Pierce , J. R. , Chen , K. and Adams , P. J. 2007 . Contribution of Primary Carbonaceous Aerosol to Cloud Condensation Nuclei: Processes and Uncertainties Evaluated with a Global Aerosol Microphysics Model . Atmos. Chem. Phys. , 7 : 5447 – 5466 .
- Raes , F. , Van Dingenen , R. , Vignati , E. , Wilson , J. , Putaud , J. P. Seinfeld , J. H. 2000 . Formation and Cycling of Aerosols in the Global Troposphere . Atmos. Environ. , 34 : 4215 – 4240 .
- Seinfeld , J. H. and Pandis , S. N. 1998 . Atmospheric Chemistry and Physics , New York : John Wiley & Sons .
- Solomon , S. , Qin , D. , Manning , M. , Marquis , M. , Averyt , K. Tignor , M. M. B. 2007 . Climate Change 2007: The Physical Science Basis (Working Group I Contribution to the Fourth Assessment Report of the IPCC) , Cambridge : Cambridge University Press .
- Spracklen , D. V. , Carslaw , K. S. , Kulmala , M. , Kerminen , V. M. , Mann , G. W. and Sihto , S. L. 2006 . The Contribution of Boundary Layer Nucleation Events to Total Particle Concentrations on Regional and Global Scales . Atmos. Chem. Phys. , 6 : 5631 – 5648 .
- Spracklen , D. V. , Carslaw , K. S. , Kulmala , M. , Kerminen , V. M. , Sihto , S. L. Riipinen , I. , . 2008 . Contribution of Particle Formation to Global Cloud Condensation Nuclei Concentrations . Geophys Res. Lett. , 35 ( 5 ) doi:10.1029/2007GL033038
- Spracklen , D. V. , Pringle , K. J. , Carslaw , K. S. , Chipperfield , M. P. and Mann , G. W. 2005 . A Global Off-Line Model of Size-Resolved Aerosol Microphysics – I: Model Development and Prediction of Aerosol Properties . Atmos. Chem. Phys. , 5 : 2227 – 2252 .
- Stier , P. , Feichter , J. , Kinne , S. , Kloster , S. , Vignati , E. Wilson , J. 2005 . The Aerosol-Climate Model ECHAM5-HAM . Atmos. Chem. Phys. , 5 : 1125 – 1156 .
- Trivitayanurak , W. , Adams , P. J. , Spracklen , D. V. and Carslaw , K. S. 2008 . Tropospheric Aerosol Microphysics Simulation with Assimilated Meteorology: Model Description and Intermodel Comparison . Atmos. Chem. Phys. , 8 : 3149 – 3168 .
- Twomey , S. 1974 . Pollution and Planetary Albedo . Atmos. Environ. , 8 : 1251 – 1256 .
- Tzivion , S. , Feingold , G. and Levin , Z. 1987 . An Efficient Numerical-Solution to the Stochastic Collection Equation . J. Atmos. Sci. , 44 : 3139 – 3149 .
- Tzivion , S. , Feingold , G. and Levin , Z. 1989 . The Evolution of Raindrop Spectra – Part 2: Collisional Collection Breakup and Evaporation in a Rainshaft . J. Atmos. Sci. , 46 : 3312 – 3327 .
- Tzivion , S. , Reisin , T. G. and Levin , Z. 1999 . A Numerical Solution of the Kinetic Collection Equation Using High Spectral Grid Resolution: A Proposed Reference . J. Comput. Phys. , 148 : 527 – 544 .
- Tzivion , S. , Reisin , T. G. and Levin , Z. 2001 . A New Formulation of the Spectral Multi-Moment Method for Calculating the Kinetic Collection Equation: More Accuracy with Fewer Bins . J. Comput. Phys. , 171 : 418 – 422 .
- Vehkamaki , H. , Kulmala , M. , Napari , I. , Lehtinen , K. E. J. , Timmreck , C. Noppel , M. , . 2002 . An Improved Parameterization for Sulfuric Acid–Water Nucleation Rates for Tropospheric and Stratospheric Conditions . J. Geophys. Res. , 107:10, doi:10.1029/2002JD002184
- Yu , F. and Luo , G. 2009 . Simulation of Particle Size Distribution with a Global Aerosol Model: Contribution of Nucleation to Aerosol and CCN Number Concentrations . Atmos. Chem. Phys. , 9 : 7691 – 7710 .
- Zhang , Y. , Easter , R. C. , Ghan , S. J. and Abdul-Razzak , H. 2002 . Impact of Aerosol Size Representation on Modeling Aerosol–Cloud Interactions . J. Geophys. Res. , 107:17, doi:10.1029/2001JD001549
- Zhang , Y. , Seigneur , C. , Seinfeld , J. H. , Jacobson , M. Z. and Binkowski , F. S. 1999 . Simulation of Aerosol Dynamics: A Comparative Review of Algorithms used in Air Quality Models . Aerosol Sci. Technol. , 31 : 487 – 514 .