Abstract
Neither the European standard nor the US standard for classification of intermediate class filters comprises testing of filter performance with respect to ultrafine particles (UFPs) or particles of the most penetrating size (MPPS). This could turn out to be a major lack in classification standards since UFPs have been pointed out as a serious health hazard. In this study, fractional efficiencies of eight new full-scale bag filters and twenty-three new filter medium samples were determined. The influence of air velocity and aerosol type was investigated, and correlations between efficiencies for UFPs (EFUFPs), MPPS-sized particles (EFMPPS) and 0.4 μm-sized particles (EF0.4μm) were established. The tested bag filters were challenged by four aerosol types: a neutralized atomized oil aerosol, the same oil aerosol but non-neutralized, a non-neutralized thermally generated oil smoke, and a “natural” indoor aerosol. The tests were carried out at different air velocities through the filter medium, ranging between 0.08 m/s and 0.22 m/s. The relationships that were observed between EFUFPs, EFMPPS, and EF0.4μm appeared to be linear within the observed filtration efficiency ranges. These relationships were similar regardless of the test aerosol type used, but somewhat different for glass fiber filters than for charged synthetic filters. Generally, EFMPPS was 10–20% lower than EF0.4μm. The influence of air velocity variations on the size resolved efficiency was determined. The glass fiber filters showed practically the same fractional efficiencies regardless of whether the test aerosol was neutralized or not. However, the charged synthetic filters showed substantially lower efficiencies when tested with the non-neutralized aerosol compared to the case when the aerosol was neutralized.
Copyright 2013 American Association for Aerosol Research
INTRODUCTION
Ultrafine particles (UFPs) are particles with a diameter smaller than 0.1 μm, and are considered to be important due to potential adverse health effects through inflammation and oxidative stress. They exhibit an extremely large ratio of surface area to mass, and they have a high ability to translocate through the epithelium of terminal bronchioles and alveoli (Daigle et al. Citation2003; Oberdörster et al. Citation2004; Delfino et al. Citation2005; Vinzents et al. Citation2005; Siouta et al. Citation2005; Bräuner et al. Citation2007). Often they also show a chemical composition typical of “combustion emissions.” Because people in large parts of the world spend over 85% of their time indoors, a substantial reduction of indoor particle concentrations may obviously reduce the total particle exposure to the population. However, reducing indoor exposure to fine and ultrafine particles relies on efficient filters available in the market. This, in turn, requires a proper method for evaluation of filter performance with respect to UFPs. It would be natural to include also the most penetrating particle size (MPPS) in such a method, since by definition this is the particle size for which a filter shows its minimum efficiency. These aspects are not covered by any of the present standards for intermediate air filters.
At present, two particle filter standards are widely used—EN779 by CEN (2012) and ASHRAE 52.2 (Citation2007). They use different filter classification criteria based on filtration efficiencies for different particle sizes. EN779:2012 is based on the efficiency for 0.4 μm particles, and ASHRAE 52.2 determines the ability of an air filter to filtrate particles of specific sizes ranging from 0.3 μm to 10 μm. However, neither of the two standards includes the efficiencies for UFPs and MPPS-sized particles.
Although there are some previous studies on fractional filtration efficiency in the size range of UFPs and MPPS (Lee and Liu Citation1980, Citation1981; Wang and Kasper Citation1991; Hanley et al. Citation1994; Hinds Citation1999; Ekberg and Shi Citation2009), studies for current intermediate ventilation air filters are still relatively scarce. One example is the study by Hanley et al. (Citation1994), which investigated fractional aerosol filtration efficiency of different contemporary filter media. No studies have been found that are dedicated to investigation of the correlation between EFUFPs, EFMPPS, and EF0.4 μmfor different intermediate filter media and classes. Thus, this study extends previously published material on fractional filtration efficiency to current commonly used intermediate filters, with special focus on UFPs and MPPS-sized particles, and their relation to the 0.4 μm particle size used in the European standard.
The issue of thermal rebound has been discussed in the scientific literature during recent years. It has been stated that below a certain particle size, the mean thermal velocity due to Brownian motion will exceed the capture velocity, and consequently will decrease the probability of the particles to be captured by a filter. Published results are diverging, but it is indicated that the thermal rebound effect mainly affects particles of a few nanometers in size. A review of papers dedicated to the study of thermal rebound can be found in Mostofi et al. (Citation2010). However, this issue is out of the scope of the present investigation, which comprises measurement of particles sized above 14 nm.
Considering that Raynor et al. (Citation2004, Citation2008) observed that charged synthetic filters could quickly lose their electrostatic filtration mechanism during the first few months of operation, it is important to reveal to what extent the function of an air filter relies on electrostatic mechanisms. The EN779 standard prescribes this to be done using a method based on soaking the filter in iso-propanol. An alternative solution would be to challenge filters by two kinds of aerosols: one close to Boltzmann equilibrium and the other practically without any charges. The differences of the two measured efficiencies reflect the importance of removal by electrostatic mechanisms. This alternative method is tested in the present work.
One overall objective of the present study was to indicate how efficiently air filters of intermediate classes may capture UFP and MPPS-sized particles. Another objective was to investigate the correlation between EFUFP, EFMPPS, and EF0.4 μm for different intermediate filter media and air velocities. The article provides background data necessary for future work, intended to find relevant criteria and a test method for an updated filter standard including consideration of UFPs and/or MPPS.
MATERIALS AND METHODS
Tested Filters
Eight new full-scale bag filters, provided by three major Swedish and international filter manufacturers, were tested in a full-scale test rig. Properties of the full-scale filters are shown in . The filters were of class M5, M6, and F7-F9, according to the European filter standard EN 779:2012. These filter classes roughly correspond to MERV9-MERV15 according to the US-standard, ASHRAE 52.2. Note that in the 2012 revision of EN779, the denominations of filter classes F5 and F6 have changed to M5 and M6.
TABLE 1 Tested full-scale bag filters and their properties. Pressure drops were measured at 0.944 m3/s
In addition, twenty-three samples of unused filter media, both glass fiber and synthetic fibers, were tested. These filter samples were provided by three major Swedish and international filter manufactures. Circular sheets of the samples, with the diameter 315 mm, were tested in a small-scale test rig. Properties of the filter samples are summarized in .
TABLE 2 Tested filter samples and their properties. Pressure drops were calculated for an air velocity of 12.3 cm/s through the filter medium
Theory
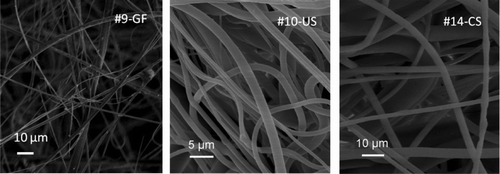
The single fiber theory, as presented by Hinds (Citation1999) was used for a set of theoretical simulations carried out in order to facilitate the interpretation of the measurement data. In this context, the mechanical filtration mechanisms were considered (i.e., diffusion, interception, and impaction). The simulations did not comprise consideration of any electrostatic filtration mechanism. Scanning electron microscope (SEM) images of the filter media were utilized to aid identification of the filter properties used as input data. shows examples of such images for three of the tested small-scale filter samples; #9-GF, #10-US and #14-CS.
FIG. 1 SEM images of the simulated filter media: #9 glass fiber; #10 uncharged synthetic fiber; #14 charged synthetic fiber.
Test Rigs
Two test rigs were used; one full-scale test rig and one small-scale test rig, which are illustrated in . Proper function of the test rigs were verified by a set of measurements basically adopted from the EN779 standard. The results of the verification tests are summarized in the online supplementary information.
FIG. 2 Sketches of the full-scale (a) and small-scale (b) filter test rigs. (Color figure available online.)
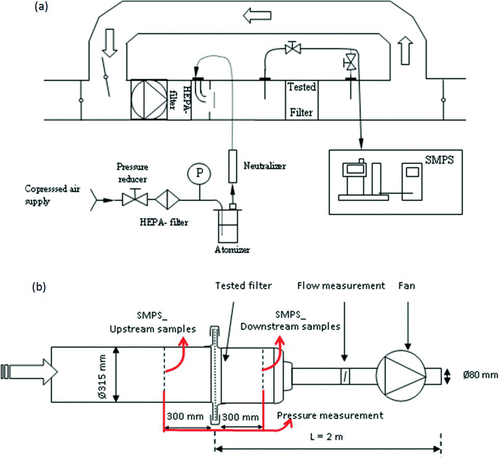
The full-scale test rig is designed in accordance with the standard EN779 and is intended for testing 600 × 600 mm bag filters. A HEPA filter is located upstream of the tested filter in order to remove any other particles than those generated for the purpose of the test. During the tests, the rig was operated with 100% air recirculation. The test rig has air flow rate control through a frequency drive of the fan. The rig is equipped with ports dedicated to inject the test aerosol, to take air samples upstream and downstream of the tested filter, and to measure the pressure drop of the tested filter.
The small-scale test rig has a circular test section with the diameter 315 mm. The air flow is generated by a fan on the suction side of the tested filter. The air flow rate was controlled by altering the voltage supply to the fan and by the use of a damper. The airflow rate was measured by the use of a calibrated orifice over which the pressure drop was measured. The test rig was designed for single pass operation (no recirculation). The rig has ports dedicated for taking air samples and for measuring the pressure drop of the tested filter. The test rig was supplied with unfiltered room air, and the test aerosol was injected at the upstream end of the test rig. The aerosol injection increased the particle concentration several orders of magnitude above the background concentration.
Measurement Instruments
In all experiments, the upstream and downstream aerosol concentrations and size distributions were measured by a scanning mobility particle sizer (SMPS) instrument (model SMPS 3936, TSI, USA) including a long differential mobility analyzer (DMA, TSI 3081) and a condensation particle counter (CPC, TSI 3775). An aerosol neutralizer (Kr 85, TSI 3077A) was installed in the SMPS. The measurements were made in the particle size-range 14–673 nm, using 16 channels per decade. The influence of multiply charged large particles was accounted for by the multiple charge correction algorithms provided in the Aerosol Instrument Manager software of the SMPS. The efficiency values obtained with and without the multiple charge correction were typically within 2%-units, both at MPPS and at 0.4 μm.
Two ultrafine particle counters (P-Trak, model 8525, TSI, USA) were also used for the qualification of the test rig. These instruments are portable condensation particle counters, which can detect the total particle number concentration in the size range between 20 nm and 1000 nm. The detectable particle concentration range is from 0 to 5 × 10⁵ particles/cm3.
Air velocity and pressure drop were measured by a multifunction instrument of the model Swema Air 300 with two sensors of models SWA 31 and SWA 10. The pressure differential sensor, SWA 10, can measure from −300 Pa to 1500 Pa with an accuracy of ±0.3 Pa plus ±1% of the reading. The air velocity sensor, SWA 31, can measure from 0.1 m/s to 10 m/s, with an accuracy of ±0.04 m/s at 0.1–1.33 m/s and ±3% at 1.33–30 m/s.
Test Aerosols
The tested filters were challenged by four different aerosol types: atomized di-ethyl-hexyl-sebacat (DEHS) aerosols, one with and one without neutralization; a thermally generated oil aerosol (Shell Ondina Oil 917) without neutralization, and an indoor aerosol from outdoor origin. The count geometric mean diameter and the standard deviation are 180 nm and 1.8 for the two DEHS aerosols, 223 nm and 1.7 for the thermal oil aerosol, and 91 nm and 1.7 for the “natural” indoor aerosol. The two DEHS aerosols were used in the full-scale filter experiments, while the thermal oil smoke and the indoor aerosol were used in the small-scale filter experiments.
Similar to di-octyl sebacat (DOS) aerosol, a non-neutralized DEHS aerosol is almost entirely uncharged, unless it has passed a neutralizer (Stahlhofen et al. Citation1975; Kousaka et al. Citation1981). According to the standard EN 779:2002, a neutralizer of sufficient activity shall be used in order to bring the DEHS aerosol to the Boltzmann equilibrium. In the experiments, the DEHS aerosol was neutralized by a Kr-85 source aerosol neutralizer (model 3012A, TSI, USA). The neutralized DEHS aerosol is assumed to have a charge state close to Boltzmann equilibrium. Additionally, the indoor aerosol is considered an “old” ambient aerosol, assumed to be naturally charged to a state close to Boltzmann equilibrium. The thermally generated oil aerosol is assumed to be practically without any charges. Further information about the four test aerosols and their size distributions are given in the online supplemental information.
Calculation of Efficiency Values
Individual filtration efficiency values were calculated from three sequential samples (upstream-downstream-upstream), and the “qualified efficiency” was based on the average of two subsequent individual efficiency values showing a limited difference. Thus, any variation of the upstream concentration had minor influence on the accuracy of the filtration efficiency determined. The uncertainties were estimated as the standard deviation expressed as efficiency percentage units.
So, based on consecutively taken upstream and downstream aerosol samples the filtration efficiency (EF) was calculated according to EquationEquation (1). The measured particle number concentration is denoted by n.
The value n 2 represents a downstream sample, while n 1 and n 3 belong to upstream samples, which are taken prior to and after sampling downstream. The sampling continued until the relative standard deviation of two sequential efficiency values (calculated for the total particle concentration) was less than 15%, and the average value of the two individual efficiency values was considered as the qualified efficiency. The criterion of relative standard deviation was met with a good margin, when filters of class M6 and higher were tested. However, when testing class M5 filters, the criterion could not be met. EquationEquation (1) was used to calculate the following three efficiencies:
| • | EFUFP , is based on the total number of particles smaller than 100 nm. | ||||
| • | EFMPPS , is based on the number of particles in the size interval with the highest penetration percentage. | ||||
| • | EF0.4μm , is based on the number of particles in the size interval 364–430 nm. | ||||
Air Velocity
The tests were carried out at different air velocities through the filter medium, ranging between 0.08 m/s and 0.22 m/s. Most of the tested full-scale bag filters have a total filter area of about 6 m2. When such filters are operated at an air-flow rate of 0.944 m3/s (the nominal air flow rate according to EN 779), the average air velocity through the filter medium will be 0.16 m/s.
In a ventilation system with variable air volume (VAV), the flow rate may periodically be reduced to 50%, or even less. This would correspond to the tested air velocity of 0.08 m/s through the filter medium. The flow might also periodically be increased substantially, e.g., to a rate 30% higher than the nominal rate. Thus, one set of the tests was carried out at 0.22 m/s.
Tests were also carried out at 0.12 m/s. This corresponds to a 6 m2 filter operated at an air flow rate of 0.72 m3/s, or a 7.8 m2 filter operated at the nominal air flow rate of 0.944 m3/s.
RESULTS
According to the single fiber theory presented by Hinds (Citation1999), the filtration efficiency of filter samples #9-GF, #10-US, and #14-CS were calculated and compared to their measured efficiency values (see the online supplemental information). The calculations comprise consideration of the mechanical filtration mechanisms, but not any electrostatic mechanism. There is clear agreement between the calculated and the measured results for the glass-fiber filter and the uncharged synthetic filter. But the calculations did not reflect the filtration efficiency when the charged synthetic filter was tested using the indoor aerosol, which is assumed to be close to Boltzmann equilibrium. However, the match between the calculations and experiments was substantially better when the charged synthetic filter was tested with the non-neutralized DEHS aerosol, assumed to be practically without any charges.
The filtration efficiencies for MPPS, 0.4 μm and UFPs observed at an air velocity of 0.16 m/s through the filter medium are summarized in . The MPPS for charged synthetic filters was observed in the size interval 40–100 nm, as found also by Kanaoka et al. (Citation1987), Lore et al. (Citation2011), Rengasamy and Eimer (Citation2011); The MPPS for glass fiber filters was observed in the size interval 100–200 nm, as determined also by Fisk et al. (Citation2002), Hinds (Citation1999) and Hanley et al. (Citation1994). The filter samples were challenged by the neutralized DEHS aerosol in the full-scale test rig. The tests were repeated using the air velocities 0.08 m/s and 0.22 m/s through the filter medium.
TABLE 3 Summary of filter efficiencies obtained using the neutralized DEHS aerosol in the full-scale test rig at an air velocity of 0.16 m/s through the filter medium; the uncertainties are expressed as the standard deviation (efficiency percentage units)
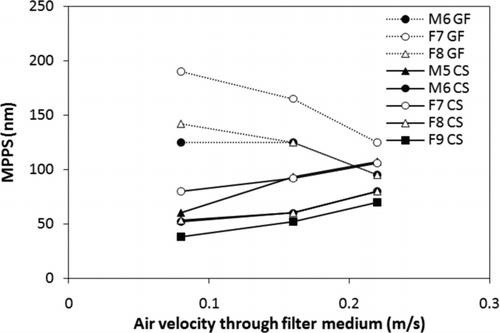
In the experiments of the full-scale filters using the neutralized DEHS aerosol, the MPPS for the glass-fiber filter decreased with increasing air velocity, while the opposite was observed for the charged synthetic filter. Examples of fractional efficiency curves that illustrate this are shown in the online supplemental information. The same tendency was observed for all tested filters, as indicated by .
FIG. 3 MPPS observed at three different air velocities through the filter medium. The data were obtained for both glass fiber filters and charged synthetic filters of various classes. The measurements were made using the neutralized DEHS aerosol in the full-scale test rig.
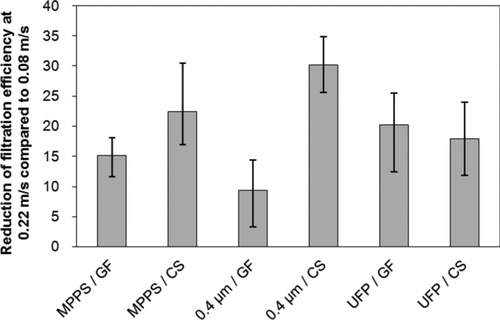
As shown by , increasing the air velocity from 0.08 m/s to 0.22 m/s reduced the filtration efficiency values by 10–30% (relative percentage). The largest observed efficiency reduction was observed for 0.4 μm particles filtered by charged synthetic filters. The smallest reduction was observed for 0.4 μm particles filtered by glass-fiber filters. Charged synthetic filters showed slightly more than 20% reduction of the MPPS efficiency, while glass-fiber filters showed about 15% reduction. The UFP efficiency reduction due to increased velocity was practically the same for the two filter types.
FIG. 4 Reduction of filtration efficiency at 0.22 m/s compared to that observed at 0.08 m/s. The data comprise M6-F8 glass fiber filters and charged synthetic filters tested with the neutralized DEHS aerosol in the full-scale test rig. GF: glass fiber filters; CS: charged synthetic filters.
shows results from analyses of the correlation between EFMPPS and EF0.4μm with varied air velocities. The data come from the experiments of the full-scale glass fiber and charge synthetic filters using the neutralized DEHS aerosol. Least squares regression analysis is used to estimate linear relationships between EFMPPS and EF0.4 μm. The squares of the Pearson correlation coefficients (R 2) are above 0.95 in all cases. The t-tests of the correlation coefficients show p-values lower than 0.025 for all cases in . Therefore, the analysis indicates that the EFMPPS and EF0.4 μm are linearly related at p < 0.025, within the measured efficiency interval.
FIG. 5 Results from the full-scale filter tests using the neutralized DEHS aerosol. Filtration efficiency values based on MPPS plotted against values based on 0.4 μm particles, for glass fiber filters (a) and charged synthetic filters (b). The average efficiency and the standard deviation are taken from repeated measurements in a full-scale filter test.
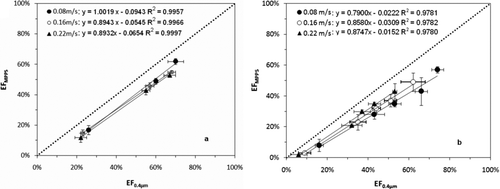
According to the figure, there is a slight tendency that the higher the efficiency, the larger the deviation between the MPPS efficiency and the efficiency for 0.4 μm particles. This tendency is clearer for the charged synthetic filters than for the glass-fiber filters. Furthermore, the glass-fiber filters show slopes of the linear regression curves that are similar for the two higher air velocities. The slope observed at the lowest velocity is close to unity, which is higher than observed at the two higher velocities. In the case of the charged synthetic filters, there is a tendency of the slope increasing with velocity over the entire velocity range studied.
The correlation between EFMPPS and EF0.4,μm was also analyzed for the results obtained in the small-scale test rig when using the indoor aerosol and the non-neutralized thermally generated oil aerosol. The tests with these two aerosols gave overlapping regression curves, which were also similar to the regression curves obtained with the DEHS aerosol. However, one difference is that the measurements made with the indoor aerosol resulted in a general shift toward higher efficiency values for the charged synthetic filters, although the filter classes were the same.
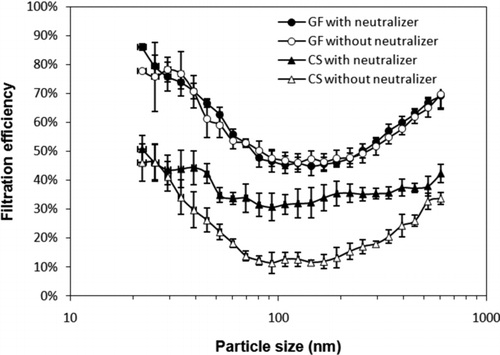
shows the result from full-scale tests of one glass-fiber filter and one charged synthetic filter, both of class F7. The measurements were made at 0.22 m/s using the DEHS test aerosol. Two sets of tests were made for each filter: one with a neutralizer connected to the aerosol generator and one without neutralizer. The figure shows that the fractional efficiency for the glass-fiber filter was the same regardless of whether the aerosol was neutralized or not. The efficiency for the charged synthetic filter was substantially lower for most particle sizes when the aerosol was not neutralized compared to the case when the aerosol was neutralized.
FIG. 6 Fractional filtration efficiency observed for one glass fiber filter (GF) and one charged synthetic filter (CS), both of class F7. The measurements were made in the full-scale test rig at 0.22 m/s using the DEHS test aerosol. For each filter, one measurement was made with, and one without neutralization of the aerosol.
DISCUSSION
This section comprises interpretation of the measurement results and a discussion about possible practical implications of the observations. The discussion is focused around four aspects:
| • | Influence of the air velocity | ||||
| • | Efficiency values at various particle sizes | ||||
| • | Influence of the test aerosol | ||||
| • | Results expressed for the sum of UFPs. | ||||
Influence of the Air Velocity
The results showed that air velocity influenced the filtration efficiency differently for different particle sizes, and that this influence was different for glass-fiber filters compared to charged synthetic filters.
To begin with glass-fiber filters, the efficiency values clearly decreased with increased air velocity within the UFP size range, while particles in the upper end of the measured size range were practically not affected at all. This result is as expected considering the established filtration theory: Hinds (Citation1999) and Lee and Liu (Citation1980) determined that the effects of interception and inertial impaction increase with particles size, while the effect of Brownian diffusion decreases with particle size. Moreover, Mostofi et al. (Citation2010) and Kousaka et al. (Citation1989) noted that increasing air velocity substantially decreases the effect of diffusion, while it does not influence the effect of interception. The effect of impaction increases with air velocity, but this mechanism mainly influences particles larger than the upper particle size measured in the present experiments. Thus, in the case of glass-fiber filters, the influence from air velocity was mainly observed at particle sizes where filtration by diffusion due to Brownian motion is known to be the dominating mechanism.
In the case of charged synthetic filters, the efficiency values for large particles decreased substantially with velocity, while particles in the lower end of the measured size range were practically not affected at all. This is most likely connected to the charge state of the test aerosols used. All four studied test aerosols were either uncharged or charged to a little extent only, which means that the dominating electrostatic force is the induced force (Romay et al. Citation1998; Kim et al. Citation2005) which substantially decreases with air velocity (Kousaka et al. Citation1989; Mostofi et al. Citation2010) and increases with particle size (Lee and Liu Citation1980; Hinds Citation1999). Thus, in the case of charged synthetic filters, the influence from air velocity was mainly observed at particle sizes where filtration was strongly depending on induced electrostatic forces. The increase of the MPPS of a charged synthetic filter observed at increasing velocity can be explained by the strong reduction of the electrostatic filtration mechanism for large particles, as discussed above. This phenomenon was also observed in a similar study by Richardson et al. (Citation2006) and Rengasamy (Citation2011) on charged respirator filters. It needs to be noticed that, because of the opposite effect of Brownian diffusion and induced force on MPPS of a charged synthetic filter, the final MPPS variation trend depends on fiber charge (Martin and Moyer Citation2000).
The influence on the filtration efficiency from varying air velocity may have air quality implications in ventilation systems with variable air volume flows. The measurements were carried out over a velocity range that corresponds to the typical airflow range of such systems. The results indicate that there may be 10–30% variation of the filtration efficiency associated with such air-flow variations.
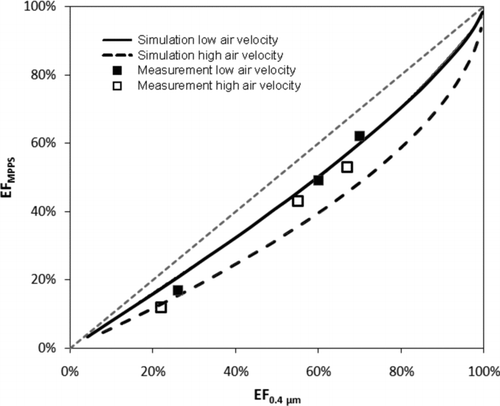
FIG. 7 Comparison of the measured efficiency and the simulated efficiency for glass fiber filters. The simulated efficiency in the range 0%–100% was obtained through theory simulation on the #9-GF filter medium with varied packing density. Low air velocity: 0.08 m/s; high velocity: 0.22 m/s.
Efficiency Values at Various Particle Sizes
According to the standard EN779, ventilation air filters are classified with respect to the filtration efficiency at 0.4 μm. The results of the present investigation indicate that this efficiency value generally is 10–20% units higher than the efficiency at MPPS. According to the regression analysis presented, the relation between EFMPPS and EF0.4 μm appear to be linear within the observed efficiency range (EF0.4 μm between about 10% and 70%). However, single-fiber theory reveals that the relationship is nonlinear, as indicated in . The calculation results shown in the figure were obtained by using the theory presented by Hinds (Citation1999) including consideration of diffusion, interception, impaction, and gravity (the latter being of negligible influence in this case). The filter parameters for filter sample #9 were used as input data. Varying efficiency values were then simulated by varying the packing density over a wide range. Another set of simulations made by varying the filter depth, while keeping the packing density constant, gave practically identical curves.
The shapes of the calculated curves were mainly influenced by the exponential function used to translate the single fiber efficiency to overall efficiency, EquationEquation (2).
α = packing density | |||||
EFΣ = single fiber efficiency | |||||
t = filter depth | |||||
df = fiber diameter. | |||||
When the overall efficiency value increases toward unity, EF0.4 μm reaches 100% sooner than EFMPPS does (an obvious consequence of the definition of MPPS). Therefore, the slope of the curves increases toward upper end of the efficiency scale. However, according to the data presented in , the increase of the slope is apparently minor as long as the EF0.4 μm-value is below 60–65%.
The calculated curve that represents high air velocity lies below the curve that represents low velocity, i.e., an increased air velocity apparently reduces EFMPPS more than it reduces EF0.4 μm. This is in accordance with the explanation given in the previous section regarding the influence of air velocity on the diffusion mechanism. In a situation where the electrostatic induced force is a dominating mechanism, the curve representing high air velocity can be expected to lie above the curve representing low air velocity. The basis for this was also discussed in the previous section, regarding the influence of air velocity on the fractional efficiency of charged synthetic filters.
Experimental data for glass-fiber filters tested at the low and the high air velocity have been added to . There is fair agreement between the simulation results and the experimental results. However, the experimental results obtained at the two air velocities differ less than the simulation results obtained at the corresponding velocities.
A medium efficiency glass-fiber filter (e.g., class M6) may show 25% efficiency at 0.4 μm and 15% efficiency at MPPS. For this filter medium type and filter class, the measured relationship between the efficiency values at these two particle sizes appears not to be substantially influenced by the air velocity. However, single-fiber theory indicates a somewhat stronger influence from velocity variations. Furthermore, according to the experiments, an intermediate glass-fiber filter (e.g., class F8) with an efficiency of 70% at 0.4 μm may show between 55% and 60% efficiency at MPPS. For this higher filter class, lower air velocity appears to result in slightly higher efficiency at MPPS, but practically unchanged efficiency at 0.4 μm. Again, single-fiber theory indicates a somewhat stronger influence from velocity variations. For charged synthetic filters the relationship between the efficiency at MPPS and the efficiency at 0.4 μm is clearly influenced by the air velocity. The difference between EFMPPS and EF0.4 μm increases slightly with increasing filter class. Simulations of the efficiency of charged synthetic filters have been left out of the scope of the article.
Due to variations between individual filters, the presented regression analysis results cannot be considered as established and generally valid relationships. However, the lowest efficiency of any intermediate filter, i.e., that for MPPS, can be at least roughly estimated from data based on 0.4 μm particles, using the equations of the regression curves presented in this article. Possibly, the estimation could be made somewhat more precise if a substantially higher number of filters were tested and included in the analysis. However, most likely, still the data should be regarded as rough estimations, reflecting the behavior of intermediate filters on average. If MPPS is to be included in future filter performance criteria, there is a need to include determination of MPPS and EFMPPS for each and every filter being tested/classified. There is reason to consider inclusion of this in future revisions of both EN 779 and ASHRAE 52.2.
Influence of the Test Aerosol
The glass-fiber filters showed practically the same test result regardless of the type of test aerosol used. However, as expected, the result when testing charged synthetic filters obviously varied depending on the electrostatic properties of the test aerosol. For example, a charged synthetic filter of class F8 may show 70% efficiency for 0.4 μm particles and 50% efficiency for MPPS, when the filter is challenged with a neutralized aerosol. When tested with a non-neutralized aerosol the EF0.4 μm may be reduced to 60% and the EFMPPS to slightly more than 40%. The relationship between EFMPPS and EF0.4 μm can be expected to remain practically unchanged.
The results show that comparing filter efficiencies measured using one neutralized and one non-neutralized aerosol can reveal to what extent an air filter relies on electrostatic mechanisms. After further development, this may be an alternative to the procedure based on neutralizing the filter medium by soaking it in iso-propanol (IPA), as is prescribed in the European filter standard EN 779. The IPA method is claimed to ruin some types of filter media (Zhou and Shen Citation2007), and clearly an alternative is highly desirable. One alternative may be to challenge the filter with diesel fume generated by a diesel engine, which is a method actually recommended by EUROVENT REC18 (Citation2009). In light of this, it appears urgent to develop a reliable yet uncomplicated method. In this context, it appears worthwhile to further work on the details of the method indicated in the present article—a method based on an oil aerosol, used with and without a neutralizer.
Results Expressed for the Sum of UFPs
When comparing the efficiency values at two discrete particle sizes, or narrow size intervals, e.g., for MPPS-sized particles and 0.4 μm particles, any differences observed between different aerosols can mainly be explained by different electrical properties of the aerosols. If attempting to compare the efficiencies for UFPs and 0.4 μm, the result will also be influenced by any variations of the particle size distribution. This is the case since EFUFP, in this article, is defined as the efficiency integrated over the entire UFP size span, 14–100 nm. For the various aerosols used in the present investigation the EFUFP values were close to the EF0.4 μm values, when testing the glass-fiber filters. The reason for this is associated with shape of the fractional efficiency curve and the fact that the UFPs and the 0.4 μm size are distributed on each side of the MPPS. The charged synthetic filters showed lower EFUFP values than EF0.4 μm values. The reason for this is that this type of filter generally has the MPPS located within the UFP size range.
CONCLUSIONS
The results and conclusions of the present article are valid for new (unused) glass fiber and charged synthetic ventilation air filters.
The air velocity through the filter medium influences the shape of the fractional efficiency curve, and MPPS increases with velocity for glass-fiber filters and decreases for charged synthetic filters. Both glass-fiber filters and charged synthetic filters are influenced substantially by the air velocity regarding the efficiency to remove particles of the MPPS and UFP-sizes. Also the efficiency at which 0.4 μm particles are removed by charged synthetic filters, is influenced substantially by the air velocity. However, the 0.4 μm removal by glass-fiber filters is influenced to a minor extent only.
These observations, together with the fact that modern demand controlled ventilation systems have airflow rates varying in a wide range, are arguments for an extension of the present air filter testing and classification standards. Today the filtration efficiency is tested at one air velocity only, although there is a need to determine the filtration efficiency over a range of velocities.
Single-fiber theory reveals that the relationship between the efficiency values at 0.4 μm and at MPPS is nonlinear. However, within the efficiency range of the studied intermediate filters, the relationship was linear by fair approximation. Thus, the measurements did not reveal the nonlinear relationship. The measurements showed that:
| • | The efficiency at MPPS was typically 10–20% units lower than the efficiency at 0.4 μm. | ||||
| • | The deviation between the efficiency at MPPS and that at 0.4 μm increased slightly with overall filter efficiency. | ||||
| • | This relationship was influenced by air velocity, slightly in the case of glass-fiber filters and more clearly in the case of charged synthetic filters. | ||||
| • | The relationship was similar regardless of the test aerosol type (neutralized DEHS, thermal oil smoke and indoor aerosol). | ||||
The electrical charge state of the test aerosol has a strong influence on the fractional efficiency of charged synthetic filters. The corresponding influence on the efficiency of glass-fiber filters is weak.
Comparing the results from a test with a neutralized aerosol to the results from a test with a non-neutralized oil aerosol will reveal if the function of a filter relies on electrostatic mechanisms. This may be an economic and efficient alternative to the iso-propanol soaking method used in today's filter testing and classification standards.
Given the aerosol size-distributions used in this study, the efficiency for filtration of UFPs was close to the efficiency for filtration of 0.4 μm particles, when testing glass-fiber filters. When testing charged synthetic filters, the efficiency for UFPs was lower than that for 0.4 μm particles.
Supplemental Information.zip
Download Zip (16.3 MB)Acknowledgments
This research was funded by FORMAS (the Swedish Research Council for Agriculture Sciences and Spatial Planning) Grant (242–2007–1583). The authors wish to thank SP Technical Research Institute of Sweden for the valuable assistance.
[Supplementary materials are available for this article. Go to the publisher's online edition of Aerosol Science and Technology to view the free supplementary files.]
REFERENCES
- American Society of Heating, Refrigerating and Air-Conditioning Engineers (ASHRAE) . 2007 . Standard 52.2: Method of Testing General Ventilation Air-Cleaning Devices for Removal Efficiency by Particle Size , Atlanta, GA : ASHRAE .
- Bräuner , E. V. , Forchhammer , L. , Møller , P. , Simonsen , J. , Glasius , M. Wåhlin , P. 2007 . Exposure to Ultrafine Particles from Ambient Air and Oxidative Stress–Induced DNA Damage . Environ. Health Perspect. , 115 : 1177 – 1182 .
- Daigle , C. C. , Cholera , D. C. , Gibbs , F. R. , Morrow , P. E. , Oberdörster , G. Utell , M. J. 2003 . Ultrafine Particle Deposition in Human During Rest and Exercise . Inhal. Toxicol. , 15 : 539 – 552 .
- Delfino , R. J. , Sioutas , C. and Malik , S. 2005 . Potential Role of Ultrafine Particles in Associations Between Airborne Particle Mass and Cardiovascular Health . Environ. Health Perspect. , 113 : 934 – 936 .
- Ekberg , L. E. and Shi , B. 2009 . Removal of Ultrafine Particles by Ventilation Air Filters , Syracuse , NY : Proceeding of Healthy Buildings 2009 .
- European Committee for Air Handling & Refrigeration Equipment Manufacturers (EUROVENT) . 2009 . REC 18: Recommendation Concerning Diesel Fume/Discharging Test of Air Filters , Brussels, Belgium : EUROVENT .
- European Committee for Standardization (CEN) . 2012 . Standard EN 779: Particulate Air Filters for General Ventilation- Determination of the Filtration Performance , Brussels, Belgium : CEN .
- Fisk , W. J. , Faulkner , D. , Palonen , J. and Seppanen , O. 2002 . Performance and Costs of Particle Air Filtration Technologies . Indoor Air , 12 : 223 – 234 .
- Hanley , J. T. , Ensor , D. S. , Smith , D. D. and Sparks , L. E. 1994 . Fractional Aerosol Filtration Efficiency of In-Duct Ventilation Air Cleaners . Indoor Air , 4 : 169 – 178 .
- Hinds , W. C. 1999 . Aerosol Technology: Properties, Behavior, and Measurement of Airborne Particles , 190 – 200 . New York : John Wiley & Sons, Inc. .
- Kanaoka , C. , Emi , H. , Otani , Y. and Iiyama , T. 1987 . Effect of Charging State of Particles on Electret Filtration . Aerosol Sci. Technol. , 7 : 1 – 13 .
- Kim , J. C. , Qtani , Y. , Noto , D. , Namiki , N. and Kimura , K. 2005 . Initial Collection Performance of Resin Wool Filters and Estimation of Charge Density . Aerosol Sci. Technol. , 39 : 501 – 508 .
- Kousaka , Y. , Okuyama , K. , Adachi , M. and Ebie , K. 1981 . Measurement of Electric Charge of Aerosol Particles Generated by Various Methods . J. Chem. Eng. Japan , 14 : 54 – 58 .
- Kousaka , Y. , Okuyama , K. , Shimada , M. and Takii , Y. 1989 . Development of a Method for Testing Very High-Efficiency Membrane Filters for Ultrafine Aerosol Particles . J. Chem. Eng. Japan , 23 : 568 – 574 .
- Lee , K. W. and Liu , B. Y. H. 1980 . On the Minimum Efficiency and the Most Penetrating Particle Size for Fibrous Filters . J. Air Pollut. Contr. Assoc. , 40 : 377 – 381 .
- Lee , K. W. and Liu , B. Y. H. 1981 . Experimental Study of Aerosol Filtration by Fibrous Filters . Aerosol Sci. Technol. , 1 : 35 – 46 .
- Lore , M. B. , Sambol , A. R. , Japuntich , D. A. , Franklin , L. M. and Hinrichs , S. H. 2011 . Inter-Laboratory Performance Between Two Nanoparticle Air Filtration Systems Using Scanning Mobility Particle Analyzers . J. Nanopart. Res. , 13 : 1581 – 1591 .
- Martin , S. B. and Moyer , E. S. 2000 . Electrostatic Respirator Filter Media: Filter Efficiency and Most Penetrating Particle Size Effects . App. Occup. Environ. Hyg. , 15 : 609 – 617 .
- Mostofi , R. , Wang , B. , Haghighat , F. , Bahloul , A. and Jaime , L. 2010 . Performance of Mechanical Filters and Respirators for Capturing Nanoparticles–Limitations and Future Direction . Industrial Health , 48 : 296 – 304 .
- Oberdörster , G. , Sharp , V. A. , Elder , A. , Gelein , R. , Kreyling , W. and Cox , C. 2004 . Translocation of Inhaled Ultrafine Particles to the Brain . Inhal. Toxicol. , 16 : 437 – 445 .
- Raynor , P. C. and Chae , S. J. 2004 . The Longterm Performance of Electrically Charged Filters in a Ventilation System . J. Occup. Environ. Hyg. , 1 : 463 – 471 .
- Raynor , P. C. , Kim , B. G. , Ramachandran , G. , Horns , J. H. and Streifel , A. J. 2008 . Collection of Biological and Non-Biological Particles by New and Used Filters Made from Glass and Electrostatically Charged Synthetic Filters . Indoor Air , 18 : 51 – 62 .
- Rengasamy , S. and Eimer , B. C. 2011 . Total Inward Leakage of Nanoparticles Through Filter Facepiece Respirators . Ann. Occup. Hyg. , 55 : 253 – 263 .
- Richardson , A. W. , Eshbaugh , J. P. , Hofacre , K. C. and Gardner , P. D. 2006 . “ Respirator Filter Efficiency Testing Against Particulate and Biological Aerosols Under Moderate to High Flow Rates ” . In U.S. Army Edgewood Chemical Biological Center Report ECBC-CR-085 , Columbus , OH : Battelle Memorial Inst. .
- Romay , F. J. , Liu , B. Y. H. and Chae , S. J. 1998 . Experimental Study of Electrostatic Capture Mechanisms in Commercial Electret Filters . Aerosol Sci. Technol. , 28 : 224 – 234 .
- Siouta , C. , Delfino , R. J. and Singh , M. 2005 . Exposure Assessment for Atmospheric Ultrafine Particles (UFPs) and Implications in Epidemiologic Research . Environ. Health Perspect. , 113 : 945 – 955 .
- Stahlhofen , W. , Gebhart , J. , Heyder , J. and Roth , C. 1975 . Generation and Properties of a Condensation Aerosol of di-2-ethylhexyl Sebacate (DES)—I: Description of the Generator . J. Aerosol Sci. , 6 : 161 – 167 .
- Vinzents , P. S. , Møller , P. , Sørensen , M. , Knudsen , L. E. , Hertel , O. Jensen , F. P. 2005 . Personal Exposure to Ultrafine Particles and Oxidative DNA Damage . Environ. Health Perspect. , 113 : 1485 – 1490 .
- Wang , H. C. and Kasper , G. 1991 . Filtration Efficiency of Nanometer-Size Aerosol Particles . J. Aerosol Sci. , 22 : 31 – 41 .
- Zhou , B. and Shen , J. 2007 . “ Comparison of General Ventilation Air Filter Test Standards Between America and Europe ” . In Proceedings of IAQVEC 2007—6th International Conference on Indoor Air Quality 639 – 646 . Sendai , , Japan Ventilation and Energy Conservation in Buildings, Vol. 2