
Abstract
Within the European legislation, a new limit for particle emissions of light and heavy duty engines based on the particle number (PN) was established in 2011. For PN determination, solid exhaust particles are quantified by means of a condensation particle counter (CPC). In literature, deviations in PN of up to 30% are reported for a comparison of different measurement set-ups. Among others variations in the counting efficiency (CE) of different CPCs have to be considered as possible error sources that contribute to the overall deviation in PN. Thereby the uncertainties in CE may result from variations in the calibration procedure of different manufacturers (e.g., calibration aerosol). To investigate this circumstance, devices from three different manufacturers were directly compared according to their CE for model aerosols. The subject CPCs exhibited differences of up to 17% (23 nm particles) in the counting efficiency when measuring simultaneously the same test aerosol. Depending on the PN size distribution in real exhaust, this might result in an error (∼9%) in the finally determined PN. Additionally, the CPC response for selected volatile exhaust components was investigated. In this way, we found out that the fraction of detected nucleation mode particles increases approximately by factor 3 in case particles consist of or contain volatile material (e.g., sulfuric acid).
Copyright 2015 American Association for Aerosol Research
1. INTRODUCTION
In 2011, the traditional mass-based (PM) limit for the emission of diesel particles from light-duty vehicles was supplemented by a particle number (PN) limit of 6 × 10¹¹ particles per km (EC Citation2008; EU Citation2012). For heavy-duty vehicles a limit of 6 × 10¹¹ particles per kWh was introduced in 2013 (EU Citation2011). These additional threshold values were initialized to provide an effective method to quantify and restrict small mass concentrations of particles, which are typical for modern vehicles with optimized exhaust aftertreatment systems (Matter et al. Citation1999; Maricq Citation2007). UN-ECE Regulations 49 and 83 (R49/R83) describe the particle number measurement procedure that was developed and evaluated during the Particle Measurement Programme (PMP) (Andersson et al. Citation2007). It states that only solid particles with diameters above 23 nm are to be quantified with a Condensation Particle Counter (CPC) whereas semi-volatile nucleation mode (NM) particles have to be excluded and therefore removed with a Volatile Particle Remover (VPR) (UNECE Citation2011a,Citationb). These restrictions were introduced to minimize the influence of volatile exhaust components on the measurement result and as a consequence improve the reproducibility of the method (Giechaskiel et al. Citation2007). This was done mainly because semi-volatile NM particles are sensitive to sampling conditions like temperature and dilution (Shi and Harrison Citation1999; Khalek et al. Citation2000). Although restrictions were introduced, there are still variations in the PN of up to 30% when the measurement is conducted with different measurement set-ups. Thereby uncertainties in the calibration of the components of the set-up were mentioned among others as possible error sources (Giechaskiel et al. Citation2012).
One part of the measurement system that needs to be calibrated is the Condensation Particle Counter. PMP compliant CPCs are supposed to have a 50% detection efficiency diameter of 23 nm. Within the CPC, nanoparticles are enlarged by condensation of n-butanol on the particle surface and consequently detected via light scattering (McMurry Citation2000a). The critical step in the detection process is the activation of the particles, which is strongly dependent on particle size and wettability (Liu and Kim Citation1977; Niessner and Helsper Citation1985; Kulmala et al. Citation2007). This means that the detection is facilitated if n-butanol and a volatile exhaust component, which may be present on the particle surface in an adsorbed or condensed state, have a similar polarity and solubility (Giechaskiel et al. Citation2009, Citation2011; Wang et al. Citation2010). The result is a differing particle number concentration depending on the composition of the NM exhaust particles and the removal efficiency of the VPR.
The effect of the exhaust gas composition on the detected particle number concentration is not the only problem that occurs due to the dependency of the CPC response on the particle surface. Up to now no calibration aerosol is specified in guidelines R 83 and R 49 (UNECE Citation2011a,Citationb). In the Particle Number Counter Calibration procedure, it says that Emery oil or CAST particles are to be used as calibration aerosol. If other aerosols are used, then it has to be proven that the CE is similar to CAST or Emery oil (Marshall and Sandbach Citation2007). In R 83/R 49, this document is referred to as example calibration procedure. This means that every manufacturer is allowed to use an aerosol of his choice (e.g., silver, Emery oil, or flame soot)—as long as it is traceable (UNECE Citation2011a,Citationb). Thus, two CPCs that were calibrated with different aerosols may be in line with the UN-ECE Regulation regarding the calibration aerosol, but may detect different particle number concentrations when measuring the same aerosol (Giechaskiel et al. Citation2009). In addition, there may be variations in the response characteristics between CPCs from different manufacturers due to differences in the design of the devices (McMurry Citation2000b). Altogether this enables significant variations between different particle counters.
In this study, the response characteristics for PMP compliant n-butanol-based continuous flow CPCs from three different manufacturers were determined simultaneously at one set-up for a variety of well-defined model aerosols. In this way, the counting efficiencies of the different devices for particles with identical surface properties could be compared directly and the effect of the calibration aerosol on the determined particle number was investigated. Additionally, semi-volatile NM particles as well as n-hexadecane-coated particles were used to evaluate the influence of volatile exhaust components on CPC response characteristics. This knowledge is used to estimate the extent of increase in the determined solid PN in case of incomplete removal of volatile components from the particle phase.
2. EXPERIMENTAL
2.1. Aerosol Generation
Different types of particles were applied for the comparison of the counting efficiency of PMP compliant CPCs. In the following aerosol generators as well as operating conditions used for the production of polydisperse model, aerosols are specified.
Soot particles were produced using two types of spark discharge generators (GFG 1000 and DNP 3000, both from Palas GmbH, Karlsruhe, Germany) as well as a propane burner (APG from AVL List GmbH, Graz, Austria) (Helsper et al. Citation1993; Evans et al. Citation2003). For the determination of the CPC counting efficiency, GFG 1000 was used with a spark discharge frequency (Sf) of 4 s−1 and an argon volume flow rate of 4 L min−1. This resulted in a particle size distribution with a count median diameter (CMD) of 32 nm and a geometric standard deviation (GSD) of 1.3. For the DNP 3000, the minimal Sf is 10 s−1 (medium energy, 0.5 mA). Consequently higher carrier gas volume flow rates (14 L min−1 air, 10 L min−1 nitrogen) were needed to achieve a size distribution (CMD = 32 nm, GSD = 1.4) comparable to the GFG (Meuller et al. Citation2012).
The APG (AVL Particle Generator) consists of a propane burner followed by a volatile particle remover (VPR). The propane burner is analogous to the one implemented in the miniCAST, which was developed by Jing (Jing Citation1999). The VPR in the APG has a standard operating temperature of 350°C. In the configuration tested, the burner is operated with flow rates of 30 mL min−1 propane and 400 mL min−1 air. The propane was not diluted with nitrogen. Additionally, the flame was diluted with air directly after the burner to achieve a CMD of 31 nm (GSD = 1.3). In the VPR, the produced aerosol (3 L min−1) was diluted with 1 L min−1 air and treated in an evaporation tube at 41°C. Subsequently, the exhaust was diluted by factor 10. To test whether the removal of volatile components influences the counting efficiency of the CPC, the temperature in the evaporation tube was increased to 350°C. The thermal treatment resulted in a shift of the particle size distribution of about 8 nm to smaller sizes.
The generation of sodium chloride (NaCl) as well as tetracontane (C40) particles was performed in a tube furnace (Heraeus ROK/A 6/60, Thermo Fisher Scientific) with an evaporation and recondensation technique (Scheibel and Porstendörfer Citation1983). For NaCl particles, a temperature of 630°C and nitrogen as carrier gas were applied. C40 particles were produced at 230°C with nitrogen (inert gas) as well as a nitrogen/air mixture (oxidizing conditions) as carrier gases. The tube furnace was cleaned with water and heated to 800°C for 5 h to assure that NaCl was completely removed from the walls before the measurement with C40 was started.
Additionally, GFG soot particles coated with a defined layer of n-hexadecane (C16) were applied for the CPC testing. Therefore, particles were mixed with C16 vapor (in nitrogen) in a ring-gap mixing nozzle at 70°C and consequently cooled in a reflux condenser to 0°C (Niessner and Helsper Citation1985; Niessner et al. Citation1990). For vapor production, a heating bath (type S, Thermo Haake GmbH) was applied with temperatures between 50°C and 100°C. By varying the bath temperature, coating thicknesses ranging from a submonolayer to several nanometers could be adjusted. A submonolayer is defined as a coating with no measurable change in particle size. From the difference between the diameters of coated and uncoated particles divided by the factor of 2, the thickness of the coating was calculated. The diameters used for the calculation were determined with a diffusion battery (type 3042, TSI GmbH, Aachen, Germany). With this device, it is possible to measure particle diameters with a size resolution of 0.2 nm (for 23 nm particles) (Niessner Citation1986).
A comparable set-up was used for the production of polydisperse sulfuric acid (H2SO4) particles (Niessner and Klockow Citation1980). H2SO4 was heated in a water bath to 70°C. The vapor was transported with nitrogen from the flask to a heating section (90°C) and consequently cooled in a reflux condenser to 0°C.
The fraction of multiple charged particles was calculated according to Giechaskiel et al. (Citation2009) using the corresponding charge probabilities (Wiedensohler and Fissan Citation1988). For the particle types evaluated in this article, the fraction of double charged particles is below 3% for 23 nm particles and below 2% for 50 nm particles. The effect of multiple charges is negligible for the chosen size distributions in case of APG, GFG, and DNP particles. For the volatile particles as well as NaCl, there might occur a maximal CE underestimation of 2.5% (Giechaskiel et al. Citation2009).
2.2. CPC Counting Efficiency
For the determination of the CPC counting efficiency, particle sizes between 13 nm and 60 nm were isolated from the polydisperse aerosol with a differential mobility analyzer (DMA 3071, TSI GmbH). Thereby the sheath air flow rate in the DMA was 20 L min−1 and the flow rate of the aerosol was 4 L min−1. For charge conditioning, a radioactive bipolar charger (85Kr, approximately 95 MBq) was used. Solely highly charged particles produced by the DNP were neutralized with a radioactive source with a higher energy (370 MBq). For the selected DNP operating conditions, it was experimentally determined that the PN (23 nm) detected by an aerosol electrometer was three times as high as the PN measured with a TSI 3775 (50 % CE diameter: 4 nm) when applying a 95 MBq neutralizer. When applying DNP plus the radioactive source with higher energy, the PN measured with electrometer and CPC were identical. For all other particle types, the 95 MBq neutralizer was sufficient.
The monodisperse test aerosol was diluted (ejector dilution system, VKL 10, Palas GmbH) to provide enough aerosol for simultaneous operation of diffusion battery, aerosol electrometer (IWC, Munich), and up to 3 PMP CPCs under evaluation (). The diffusion battery was used in combination with a CPC, which has a 50% detection efficiency diameter of 4 nm (type 3775, TSI GmbH). The application of a diffusion battery allows to calculate the thickness of the n-hexadecane coating on GFG particles (see Section 2.1). It is also used to ensure that the size sampled in the DMA is identical to the one detected by the CPC. This excludes the possibility that sizing errors occur due to evaporation of volatile material in the DMA (Khlystov Citation2014). Additionally, it was also evaluated whether the dilution bridge (together with the tubing) has an influence on the thickness of the coating. Therefore, counting efficiency measurements were repeated with the diffusion battery up- and downstream of the dilution bridge. Thereby counting efficiencies and particle diameters were found to be identical within the standard deviation and it was concluded that the dilution bridge does not affect the thickness of the n-hexadecane layer. The diffusion battery was empirically calibrated with monodisperse GFG aerosol. Thus, the particle diameters of diffusion battery and DMA can be directly compared. Within the diagrams shown in this article, the plotted particle size is always diffusion battery diameter.
FIG. 1. Set-up for determination of the counting efficiency of PMP compliant CPCs.
Counting efficiency measurements were carried out with particle counters from Grimm (type 5.431, Grimm Aerosol Technik GmbH & Co. KG, Ainring, Germany), TSI (type 3790, TSI GmbH), and Airmodus (type A23, Airmodus, Ltd., Halsingfors, Finland). All checked devices were freshly calibrated by the manufacturer for this comparison. The flow rate of the evaluated devices was tested with an external flow meter before each counting efficiency measurement and found to be within the uncertainty of the measurement device. In this study, two field campaigns with one TSI and one Grimm CPC at a time were realized. One Airmodus CPC was tested during the first campaign. In the following, the PMP CPCs are named after the campaign (e.g., Grimm-1) in which they were tested. For the calculation of counting efficiencies, particle number concentrations including k-factor corrections (as implemented in the device by the manufacturer) were applied.
To adjust the particle number concentration to the range, where the CPC works in the single count mode, a dilution bridge was applied downstream of the diffusion battery. Within the dilution bridge, the aerosol stream was split into two fractions. One part was led through an HEPA filter (high-efficiency particulate air filter), which removed all particles from the gas phase. The other part of the aerosol passed a throttle valve. In the end, both parts were reunited, the volume of the sample stayed unchanged and the particle number concentration was reduced. Different PN concentrations were selected by adjusting the flow rate going through the throttle valve. For the counting efficiency measurements, particle number concentrations were between 2000 cm−3 and 10,000 cm−3. Thereby the lowest concentrations were applied for measurements with 10 nm particles and 50 nm particles. For 23 nm particles, PN concentrations ranged between 7000 cm−3 and 10,000 cm−3.
Downstream of the dilution bridge, conductive tubing was used to minimize particle precipitation. The length of the tubing was adjusted to the device flow rate to obtain comparable diffusional losses for the reference detection instrument and each of the CPCs under evaluation. Particle number concentrations were determined simultaneously with the PMP CPCs (PN(PMP − CPC)) as well as the aerosol electrometer (PN(AEM)). Using these measured concentrations, the counting efficiency of each PMP CPC (CE(Dp)) for different particle diameters (Dp) was calculated:[1]
Finally, the counting efficiencies of one CPC—using an individual aerosol but different particle sizes—were summarized in one cut-off curve. Thereby the CE(Dp) is calculated using PN(PMP − CPC) and PN(AEM) values that were determined simultaneously. Then the average of 60 PN(PMP − CPC) and PN(AEM) pairs (one for each particle diameter within the cut-off curve) and the related standard deviation is calculated. For particles generated by DNP, GFG, and APG, the counting efficiency measurements for every particle diameter within the cut-off curves were repeated three times at different days. The error bars plotted in Figures , , and were calculated with Gaussian error propagation on the basis of the standard deviation of the counting efficiencies for every measurement day. The cut-off curves for NaCl, H2SO4, and C40 particles as well as n-hexadecane-coated particles were measured only once (one measurement day). Consequently, the error includes only the standard deviation of the counting efficiencies of one measurement day.
FIG. 2. Response characteristics of the evaluated CPC devices for GFG particles.
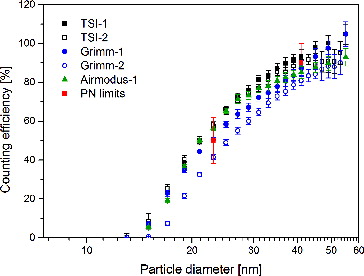
FIG. 3. Response characteristics of Grimm-2 for GFG, DNP, and APG (solid) particles.
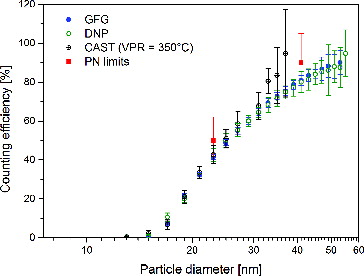
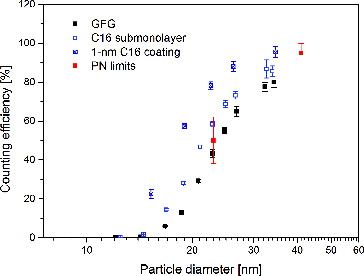
FIG. 4. CPC response characteristics of CPC Grimm-1 for GFG particles coated with different amounts of n-hexadecane.
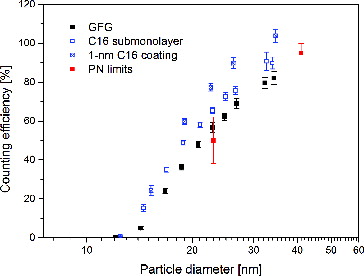
FIG. 5. CPC response characteristics of CPC Airmodus-1 for GFG particles coated with different amounts of n-hexadecane.
3. RESULTS
3.1. CPC Response Characteristics for Solid Particles
In , the cut-off curves of five PMP compliant counters for GFG particles are illustrated. Also shown in the figure are the counting efficiency limits (PN limits) given by the EU in R49/R83. There it is stated that the CPC must have a counting efficiency of 50% (±12%) for 23 nm (±1 nm) and a CE higher than 90% for 41 nm (±1 nm) (UNECE Citation2011a,Citationb). For GFG particles, all evaluated devices are conform to the PN limits for 23 nm particles. TSI-1, TSI-2, and Grimm-1 (considering the standard deviation) are within the PN limits for 41 nm particles. Airmodus-1 and Grimm-2 are 5% and 9% below the required value for 41 nm particles.
Considering the fact that there is no calibration aerosol specified in R49/R83, all tested CPCs are within the PN limits according to their calibration certificate with the calibration aerosol applied by the manufacturer (UNECE Citation2011a,Citationb). A validation of CPCs with an arbitrary aerosol gives only an information about the comparability of different devices and an estimation whether the number of quantified particles is over- or underestimated compared to the calibration aerosol. For the Grimm and the Airmodus CPCs, the number of GFG particles with 41 nm in diameter is underestimated.
By comparing the CE of the CPCs with each other, it can be observed that Grimm-1 is 6% below Airmodus-1 and TSI-1 for 23 nm particles. For particle diameters above 23 nm, there is a maximal variation of 9% (35 nm) in the counting efficiency between TSI-1 and Grimm-1. In the second field campaign, differences of up to 18% (19 nm particles) were found between TSI-2 and Grimm-2.
By comparing response characteristics of similar counting devices from the same manufacturer, maximal counting efficiency differences of 12% (19 nm particles) for both Grimm and 5% (31 nm particles) for both TSI counters were found. For 23 nm particles, the variations are 1% (TSI) and 10% (Grimm). Considering the double standard deviation of the CE for each particle size, there is a measurable difference between the two CPCs from Grimm. The measurements from the two field campaigns are regarded to be comparable as set-up (GFG, AEM, and DMA) and operating conditions were identical in both cases. In literature, the CE of five TSI 3790 devices could be determined with a standard deviation of 7%. Variations of up to 25% (23 nm) were found in case the flow of the device was incorrect or a contamination of the saturator wick (used CPC) was stated. These error sources were ruled out for our study as the tested devices were freshly calibrated and the flow rate was checked at the beginning of each measurement (Giechaskiel and Bergmann Citation2011).
Additionally to GFG aerosol, other solid particles were investigated according to their CPC response characteristics. In , the response characteristics of Grimm-2 for GFG, DNP, and APG (temperature in VPR = 350°C) particles are shown. It can be seen that the CE of these types of soot are similar within the standard deviation. For the spark discharge soot, this leads to the conclusion that the carrier gas used for the generation of the soot has no influence on the CE of the CPC. Additionally, it can be concluded that the counting efficiencies of PMP CPCs for spark discharge soot particles and thermally pretreated CAST particles are similar within the standard deviation. For the APG, it has to be noted that the CE were measured only for particle sizes between 13 nm and 39 nm. The PN concentrations of particle diameters above 39 nm were too low (for the applied generator settings) to be measured with an aerosol electrometer. The standard deviations for particle sizes above 35 nm are approximately 10% because of low PN concentrations (2000 cm−3) that were determined with an aerosol electrometer with an average noise level of 400 cm−3.
Additionally to soot particles, which are shown in , the CE for NaCl was determined with TSI-1 during the first field campaign. In , an extract of the cut-off curve measured with NaCl particles is presented. σ stands for the single standard deviation of the CE for different particle diameters (DP). The CE of TSI-1 is 16% (19 nm) below the value measured with the same device for GFG soot. The CPC response characteristics for particle sizes above 23 nm are similar compared to spark discharge soot. In literature, the CPC response characteristics for sodium chloride are highly variable. They are in the range from 50% CE for 34 nm to 50% for particles between 20 nm and 25 nm (Giechaskiel et al. Citation2009; Wang et al. Citation2010). This is because of different relative humidities in the test aerosols (Sem Citation2002). For the results shown here, the relative humidity in the aerosol was below 2%. As described by Wang et al., the counting efficiencies for dry particles (40 nm) are approximately 70%. Compared to the results from our experiments, the CE measured by Wang et al. is 10 to 15 percentage points lower.
TABLE 1 Counting efficiency (CE) of TSI-1 for NaCl particles
3.2. CPC Response Characteristics for Coated Particles
In and , the CE of Grimm-1 and Airmodus-1 for GFG particles uncoated and coated with different amounts of n-hexadecane are shown. In both diagrams, the plotted particle size is measured with a diffusion battery before and after the coating process. For both CPCs, already a few molecules (submonolayer) of a volatile exhaust component on the particle result in a shift of the cut-off curve. This effect increases for particles with a C16-nanometer (1 nm ± 0.2 nm) layer. The shift of the CE is in the same range for TSI-1 (not shown here).Thereby the slope of the cut-off curve is constant. Compared to spark discharge soot, there is an increase of around 30% in CE for particles with the same diameter. The counting efficiency is approximately 20% above the PN limits (23 nm) for both devices. Thus, it can be concluded that the CPC CE for soot particles changes with different amounts of condensed volatile exhaust components on the particles. In a broader sense, this leads to the conclusion that a complete evaporation of volatile exhaust components (e.g., n-hexadecane) with a VPR is essential for an accurate quantification of solid exhaust particles. Otherwise the number of particles will be overestimated. The increased CE may be explained in terms of solubility of the particle surface in the CPC working fluid. C16 is in contrast to GFG soot soluble in n-butanol. This is also the case for Emery oil (calibration aerosol used by TSI) as well as silver (calibration aerosol used by Airmodus) and might also be the case for CAST particles (calibration aerosol used by Grimm) (Mamakos et al. Citation2012).
As an additional model for an aerosol containing semi-volatile and solid components, flame-derived soot was investigated in terms of the CPC response characteristics. Thereby the CPC response for soot particles produced by the APG at different temperatures (41°C, 350°C) in the VPR was determined. The results for 350°C were already presented in Section 3.1.
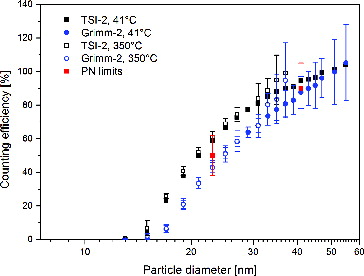
In , the cut-off curves of TSI-2 and Grimm-2 for both VPR settings are presented. The results show that the CE does not change for different VPR temperatures although there is an evaporation of volatile exhaust components. It can be assumed that a removal of volatile components from the soot core takes place as the maximum of the particle size distribution shifts about 8 nm to smaller sizes. As described by Moore et al. (Citation2014), the coating of CAST particles contains different mass fractions of polycyclic aromatic hydrocarbon (PAH) depending on the fuel/air ratio. For the fuel-rich flame conditions applied in our study (30 mL min−1 propane, 0.4 L min−1 oxidation air), there is a comparatively high mass fraction of PAH adsorbed on the particles. Additionally, it was stated by the authors that the hygroscopicity of the flame-derived particles slightly increases for higher oxidation air flow rates. It was assumed that the adsorbed PAH are more functionalized and therefore less hydrophobic when particles are generated in fuel-lean flames (Moore et al. Citation2014). In the case shown here, the coating may contain PAH that are as hydrophobic as the soot core. This may explain why the CE does not change for the different VPR conditions.
FIG. 6. CPC response characteristics of TSI-2 and Grimm-2 for APG particles at two different VPR temperatures (41°C and 350°C).
In literature, variations of the CPC CE for flame-derived particles for different operating conditions of a miniCAST (22% for 25 nm) are described (Mamakos et al. Citation2013). Thereby the CE was lowest for the two burner operating conditions with the highest fuel/air ratio (e.g., 0.06 L min−1 fuel, 1 L min−1 air). Compared to the CPC response of TSI-2 in our study, the CE is approximately 20% lower for these two operating conditions mentioned by the authors. Thereby it has to be noted that the conditions for the aerosol generation are not identical in terms of gas flow rates (e.g., oxidation air, fuel dilution) and thermal pretreatment. This alters the composition of the particles and may consequently also alter the CPC response (Giechaskiel et al. Citation2013; Mamakos et al. Citation2013; Maricq Citation2014). Additionally, the usage of different CPCs as well as reference devices can be listed as reasons for these variations in CE.
3.3. CPC Counting Efficiency for Volatile Particles
Diesel exhaust particles consist of solid, coated as well as volatile particles. Most of the particles without a solid core are present in the nucleation mode (Burtscher Citation2005). They are mainly composed of hydrocarbons (HC; consisting of fuel or lubricating oil) as well as sulfuric acid (Schneider et al. Citation2005). In the following, the CPC response characteristics are presented for sulfuric acid particles and tetracontane as a representative for a long-chained hydrocarbon ().
FIG. 7. Cut-off curves of TSI-1 with H2SO4 particles and Grimm-2 with C40 particles (generated in nitrogen and air/nitrogen mixture).
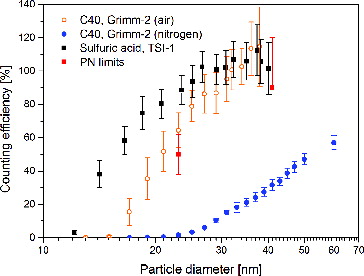
For sulfuric acid as well as tetracontane, it can be seen that the CE is either above or below the PN limits for 23 nm and 41 nm. For C40, there were carried out measurements with pure nitrogen and a nitrogen/air mixture as carrier gases. Here, the CPC counting efficiency of 23 nm particles varies up to 62% depending on the atmosphere the particles were generated in. One possible explanation for this behavior is the occurrence of a temperature-induced autoxidation of the C40 when particles are generated in an oxygen-containing atmosphere. Oxidation products (e.g., aldehydes, ketones, and acids) with higher polarity compared to the hydrophobic starting product are formed (Jensen et al. Citation1979; Petters et al. Citation2006; Bazanov et al. Citation2011). This leads to a change in particle wettability or solubility in the working fluid of the CPC device. The consequence is an increased counting efficiency. The synthesis of oxidation products was proven for particles generated in nitrogen/air atmosphere with the help of Fourier transform infrared spectroscopy (absorption band at 1716 cm−1). In contrary, C40 heated in pure nitrogen did not exhibit this specific absorption band. In comparison to GFG soot, the CE of Grimm-2 increases 23% (with O2), respectively, decreases 40% at 23 nm for C40 particles. Consequently, counting efficiencies are above (oxygen) or below (nitrogen) the PN limits for 23 nm. For the particles generated in nitrogen, the CE is also below 90% (41 nm). In literature, there were also reported highly differing counting efficiencies for C40 particles produced in nitrogen and air (Giechaskiel et al. Citation2009). One explanation given by the authors is water condensing on the particle surface and consequently facilitating n-butanol condensation (Giechaskiel et al. Citation2009). Another possible reason, which was mentioned in a second publication, is a varying saturator to condenser temperature difference for the two CPCs used for the comparison (Mamakos et al. Citation2012). These explanations could be ruled out in our case as the same CPC was used for both measurements and the carrier gases had a water content below 2%.
Comparing the CE of TSI-1 for sulfuric acid and GFG particles, increases of 31% (23 nm) and 10% (41 nm) can be found. Thus, there is a significant overestimation of the PN for sulfuric acid in comparison to GFG particles. Counting efficiencies are above the PN limit for 23 nm. The increased CE of H2SO4 may be explained in terms of solubility of the particles in n-butanol. Soot particles are in contrast to H2SO4 insoluble in n-butanol. This may explain why the CPC has a lower CE for soot particles.
3.4. Determination of Nucleation Mode Particles with PMP CPC
Although a VPR is applied within the PMP set-up to remove volatile components from the particle phase, there might be still volatile particles or coatings present downstream of the VPR (Giechaskiel et al. Citation2010; Mamakos et al. Citation2013). To prohibit the codetermination of volatile nucleation mode particles, the PMP CPC with its 50% counting efficiency diameter at 23 nm was introduced into the legislation (Giechaskiel et al. Citation2012). To be able to assess how efficient this CPC cut-point prohibits the quantification of volatile nucleation mode particles, it is necessary to investigate the CE of possible volatile exhaust gas components.
In the following, an estimation is made to which extent nucleation mode particles (with different CE) are detected by a PMP compliant CPC and how this influences the overall PN result. A size distribution with nucleation mode (NM, CMD = 7 nm–10 nm, GSD = 1.35) and accumulation mode (AM, CMD = 52 nm, GSD = 1.95) serves as a basis for the calculations. The fraction of particles (FPMP) that is determined with a PMP CPC is estimated with the aid of CPC response curves as well as particle numbers for each particle size. Exemplarily calculations are conducted with the CE of TSI-1 for GFG (CE comparable to calibration aerosol) and sulfuric acid particles (CE increased compared to calibration aerosol). FPMP is calculated for NM (DP ≤ 23 nm) particles with CE of H2SO4 and GFG. AM particles are assumed to have the CE of soot-like components (GFG). The CE for particles with diameters below 10 nm and above 50 nm were assumed to be 0% and 100%, respectively. Consequently, differences in FPMP for NM particles (with CE of soot resp. H2SO4) result from differences in the CE of particles between 12 nm and 23 nm.
The results of the calculations are presented in . For nucleation mode particles exhibiting the CE of GFG TSI-1 will determine 0.2% (7 nm) to 3.0% (10 nm) of the NM particles. In contrast, the fraction of determined nucleation mode particles that exhibit the CE of H2SO4 is approximately higher by factor 3: 0.8% (7 nm) to 9% (10 nm). In case of AM particles, FPMP is 87%. The contribution of NM particles to the overall PN is depending on the ratio of the number of NM to AM particles. Particles with a size distribution comparable to the one used for the calculations (CMD of NM = 7 nm) were detected downstream of a VPR when determining the solid PN of a light duty Euro 3 diesel vehicle (Giechaskiel et al. Citation2012). Thereby the ratio of NM to AM was approximately 3. Thus, in this case the contribution of the NM to the overall PN is 3% (CE for H2SO4). For higher CMD, the contribution is increasing: 8% (8 nm) and 31% (10 nm). In case the NM consists of compounds with soot-like CE, the maximum increase is 10% (10 nm). Particles with a CMD of 10 nm were detected downstream of a VPR. The particles were considered to be nonvolatile. Nevertheless the CE of these particles is unknown (Rönkkö et al. Citation2013). In Giechaskiel et al. (Citation2012), analogous calculations were conducted applying theoretical CPC cut-off curves. In contrary to the calculations in this article, the CE of the particles was assumed to be according to the calibration aerosol. With the CE curve applied by the authors, maximally 1% of the NM particles (CMD = 10 nm) are counted. Thus, the FPMP calculated with TSI-1 is 9% higher. This increase is caused by differences in the CE curves.
TABLE 2 Fraction of particles (FPMP) with CE of soot and sulfuric acid determined with TSI-1
4. SUMMARY
The response characteristics of five PMP condensation particle counters from Airmodus, TSI, and Grimm were compared with defined model aerosols consisting of solid and coated particles. Further experiments with volatile particles were conducted to estimate the influence of the particle surface properties on the determined particle number concentration.
For identical CPC devices (same manufacturer and model), deviations in the counting efficiency for one particle type of up to 12% (19 nm particles) were found during two field campaigns. CPCs from different manufacturers showed deviations up to 18% (19 nm particles) in CE during simultaneous measurements of APG as well as spark discharge soot particles. The CE deviations between CPCs are within the range that is given in the legislation. This indicates that calibrating CPCs according to the PMP calibration procedure leads to the desired result: maximal deviations of 24% at 23 nm. Nevertheless it is very important to note that these CE differences directly influence the determined particle number concentration depending on particle size distribution and engine load. According to estimations of Wang et al. (Citation2010), a CPC with a higher CE (∼20%) detects 9% (idle, including nucleation mode), respectively, 7% (low load, accumulation mode only) more particles. This directly accounts to the variations (30%) in the PN in real exhaust that were found for variable measurement systems (Giechaskiel et al. Citation2012). Consequently up to one-third of the observed deviation may be due to differences between CPCs. This could be the case, when comparing complete PN measurement systems, where either TSI-1 or Grimm-2 is implemented.
For the compared CPC devices, systematical deviations in CE that could be traced back to the influence of the calibration aerosol were on a minor scale. The number of 41 nm solid particles is underestimated in case of Airmodus-1 and Grimm-2. This indicates that the CE of the calibration aerosol applied by the manufacturers is not identical with the investigated particle types. Another explanation might be the correction of the PN with a k-factor. Furthermore, it is noticeable that the CE of the TSI CPCs for particles above 23 nm are higher than the ones of Grimm devices for every tested particle type. In literature, it is described that the CE for emery oil is higher (∼15% for 23 nm) or maximally similar compared to CAST particles (Giechaskiel et al. Citation2009; Wang et al. Citation2010; Mamakos et al. Citation2013). Consequently, the CE of Grimm could be expected to be higher or similar to TSI for one particle type. For silver particles (Airmodus CPC), such an estimation was not possible, since to best of our knowledge there is no literature data available for PMP CPCs for this aerosol. For the Grimm CPCs, it can be assumed that the CE of the calibration aerosol (CAST) is higher compared to GFG particles and possibly similar to the particles produced by the APG for the chosen operating conditions. For the comparison of the tested devices, it has to be noted that the CE curves include correction factors (k-factors) that may enhance or decrease the CE independently of the calibration aerosol. Nevertheless the increased CE of TSI-1 in comparison to Grimm-2 cannot be explained in terms of k-factors.
According to the Particle Number Counter Calibration procedure, the calibration aerosol has to be CAST, Emery oil, or substances with similar CE (Marshall and Sandbach Citation2007). Referring to R83 and R49, the definition of the CPC calibration aerosol is still lacking (UNECE Citation2011a,Citationb). As the counting efficiency is only a relative measure, it is absolutely necessary to legally define a calibration aerosol.
The choice of a CPC calibration aerosol is difficult as its surface properties should be similar to those of real engine exhaust solid accumulation mode particles. Problematic is that exhaust particles are very inhomogenous in composition and structure and have a hardly controllable size distribution (Wang et al. Citation2010). Therefore, their CE can only be estimated and the particles cannot be used as calibration standard themselves. According to Wang et al. (Citation2010), a surrogate calibration aerosol should, for example, have similar CE compared to accumulation mode particles, have a simple morphology as well as chemical composition. Additionally, it should be possible to generate monodisperse (downstream DMA) particles with low fractions of multiple charged particles in size and concentration ranges sufficient for CPC calibration.
Regarding the CE, it is described in literature that a PMP CPC has similar response characteristics for Emery oil (PAO 4 cSt), CAST, and exhaust particles (Giechaskiel et al. Citation2009). Our results showed that spark discharge soot as well as silver particles have CE comparable to CAST. Consequently, it can be concluded that these aerosols are also suitable for CPC calibration. For silver, this conclusion can be drawn as the Airmodus cut-off curve is between the ones of TSI and Grimm for the evaluated model aerosols. Within the experiments shown here, only one CAST burner operation setting was tested. As described in literature, the CE of CAST particles may vary depending on the chosen operating conditions. Together with the CE, morphology and chemical composition of these particles may also change (Wang et al. Citation2010; Mamakos et al. Citation2013). For spark discharge soot particles, two generators with varying operation settings and carrier gases were compared and the particles were found to have similar CPC response characteristics. Further investigations would help to clarify whether the CE changes if other spark discharge generators are applied. Nevertheless such changes might be induced only through variations of the particle structure. The chemical composition of the particles can be assumed to be simple and reproducible as high purity inert gases and electrodes are applied for its generation. Generally, the particles produced by CAST, GFG, and DNP are fractal-like agglomerates like engine exhaust soot (Evans et al. Citation2003; Mamakos et al. Citation2013). Polyalphaolefin particles are assumed to be spherical and consequently should exhibit a more simple structure. Considering the chemical composition of Emery oil (synthetic 1-butene polymer), systematical investigations would be desirable to evaluate whether the CE changes in case products from varying suppliers are applied. Thereby the composition might vary as it is a mixture of 1-decene trimers, tetramers, and traces of other carbon chain length (Carlon and Guelta Citation1993; Giechaskiel et al. Citation2009). Furthermore, we could show with the experiments described in this article that it is possible with APG as well as both spark discharge generators to generate monodisperse aerosols with low fractions of multiple charged particles. Thereby the GFG 1000 is selected over the DNP 3000 as generator for this purpose as narrow size distributions (necessary for the production of monodisperse aerosols with low contents of multiply charged particles) can be produced easier due to lower possible spark discharge frequencies (Meuller et al. Citation2012).
Additionally, it is worth to notice, that it is possible to calibrate PMP CPC devices without using a radioactive source. The set-up with GFG aerosol, electrometer, and an indirect photoelectric charger was already built, evaluated, and compared to the set-up described in this article (Grob et al. Citation2013, Citation2014).
Tetracontane is applied to validate the VPR concerning its volatile particle removal efficiency. It was found out that the PMP CPC response characteristics for this particle type vary depending on the carrier gas (nitrogen or nitrogen/air mixture) used for aerosol generation. This is due to the fact that C40 is oxidized when it is heated (T ∼ 230°C) in an oxygen-containing atmosphere. For the determination of the volatile particle removal efficiency, ∼10,000 particles per cm3 (30 nm) are required. In case the aerosol contains pure C40 (CE ∼ 10% for 30 nm) 100,000 cm−3 are needed that a PMP CPC detects 10,000 cm−3. To achieve the required removal efficiency (≥99.9%), a CPC may maximally count 1000 cm−3 downstream of the device. In reality 90,000 cm−3 had to be evaporated. For oxidized C40 (CE ∼ 100% for 30 nm), the inlet concentration is lower. Thus, the number of particles that need to be evaporated is only a tenth (9000 cm−3). Additionally, particles may also be oxidized when flowing through the device. Altogether these results strongly indicate that the application of a PMP CPC for VPR validation is problematic.
Additionally, CPC response characteristics for volatile and coated particles were investigated to be able to estimate the influence of volatile components on the overall PN result. Applying n-hexadecane-coated particles, it was found out that already traces of this important volatile exhaust component on the surface of solid particles lead to CE increases of about 15% compared to GFG particles. For a 1 nm C16-coating on GFG particles as well as sulfuric acid particles, the CE increased by about 30% compared to soot. In case of a renucleation of volatile components, downstream of VPR volatile particles might be codetermined with the PMP CPC involuntarily (Giechaskiel et al. Citation2012). TSI-1 detects more nucleation mode particles when these particles exhibit the CE of sulfuric acid instead of GFG (comparable to calibration). For a size distribution as it was measured by Giechaskiel et al. (Citation2010), the PN will be 2% higher compared to the case when only soot-like particles are detected. Thereby the fraction of codetermined NM particles would increase if particles with higher CMD were present in the exhaust (e.g., 20% for a CMD of 10 nm). In literature, it is frequently reported about sub-23-nm particles downstream VPR. These particles are described to have a maximal CMD of 10 nm and may be also of solid nature (Rönkkö et al. Citation2013; Giechaskiel and Martini Citation2014). It has to be noted that the CE of solid as well as volatile NM particles may be differing from those of soot. For solid sub-23-nm exhaust particles, a maximal fraction of codetermined NM particles is desirable, whereas for volatiles the contrary is the case. Our results indicate that it is important to consider that NM particles may have CE differing from the calibration aerosol because these particles may be determined to a higher degree than one would expect only considering the CE of soot.
ACKNOWLEDGMENTS
The authors thank MAHA-AIP (Haldenwang, Germany), Grimm Aerosol Technik (Ainring, Germany), and Airmodus (Helsinki, Finland) for providing the automotive condensation particle counters. AVL (Graz, Austria) is thanked for providing the APG and the DNP 3000.
FUNDING
Financial support by the Forschungsvereinigung für Verbrennungskraftmaschinen (FVV) is gratefully acknowledged.
REFERENCES
- Andersson, J., Giechaskiel, B., Muñoz-Bueno, R., Sandbach, E., and Dilara, P. (2007). Particle Measurement Programme (PMP), Light-Duty Inter-Laboratory Correlation Exercise (ILCE_LD), Final Report EUR 22775 EN, Institute for Environment and Sustainability, Joint Research Center, Ispra, Italy, European Commission.
- Bazanov, T. A., Psikha, B. L., and Kharitonov, V. V. (2011). Features of the Initiated Oxidation Mechanism of n-Heptadecane at Low Concentrations of Oxygen. Russ. Chem. Bull., 60:1414–1420.
- Burtscher, H. (2005). Physical Characterization of Particulate Emissions from Diesel Engines: A Review. J. Aerosol Sci., 36:896–932.
- Carlon, H. R., and Guelta, M. A. (1993). Army-Approved Safe Materials to Replace DOP in Mask and Filter Testing: Emery 3002 (Ethyflo 162) and Emery 3004 (Ethyflo 164). Edgewood Research Development & Engineering Center, U.S. Army Chemical and Biological Defense Agency. Maryland, USA.
- EC, Commission Regulation 692/2008. Available at: http://eur-lex.europa.eu/legal-content/EN/TXT/?qid=1399560401259&uri=CELEX:32008R0692.
- EU, Commission Regulation 459/2012. Available at: http://eur-lex.europa.eu/legal-content/EN/TXT/?qid=1399561658979&uri=CELEX:32012R0459.
- EU, Commission Regulation 582/2011. Available at: http://eur-lex.europa.eu/legal-content/EN/TXT/?qid=1399559728633&uri=CELEX:32012R0459.
- Evans, D., Harrison, R., and Ayres, J. (2003). The Generation and Characterisation of Elemental Carbon Aerosols for Human Challenge Studies. J. Aerosol Sci., 34:1023–1041.
- Giechaskiel, B., and Bergmann, A. (2011). Validation of 14 Used, Recalibrated and New TSI 3790 Condensation Particle Counters According to the UN-ECE Regulation 83. J. Aerosol Sci., 42:195–203.
- Giechaskiel, B., Chirico, R., DeCarlo, P. F., Clairotte, M., Adam, T., Martini, G., et al. (2010). Evaluation of the Particle Measurement Programme (PMP) Protocol to Remove the Vehicles’ Exhaust Aerosol Volatile Phase. Sci. Total Environ., 408:5106–5116.
- Giechaskiel, B., Davok, R., Giovanella, K. M., and Joergl, H. (2013). Particle Generator (APG): A Soot Generator for the On-Site Checks of Particle Number (PN) Measurement Systems. in JSAE, 22–24 May 2013, Yokohama, Japan, p. 5504.
- Giechaskiel, B., Mamakos, A., Andersson, J., Dilara, P., Martini, G., Schindler, W., et al. (2012). Measurement of Automotive Nonvolatile Particle Number Emissions within the European Legislative Framework: A Review. Aerosol Sci. Technol., 46:719–749.
- Giechaskiel, B., and Martini, G. (2014). Review on Engine Exhaust Sub 23-nm Particles (Draft, PMP 30th Session), European Commission, Joint Research Center, Ispra, Italy.
- Giechaskiel, B., Muñoz-Bueno, R., Colombo, R., Manfredi, U., and Dilara, P. (2007). PMP Inter-laboratory Correlation Exercise, Report on PART 3: JRC Tests in July’06, EUR 22311 EN, Institute for Environment and Sustainability, Joint Research Center, European Commission, Ispra, Italy.
- Giechaskiel, B., Wang, X., Drossinos, Y., and Gilliland, D. (2011). The Effect of Particle Chemical Composition on the Activation Probability in n-Butanol Condensation Particle Counters. J. Aerosol Sci., 42:20–37.
- Giechaskiel, B., Wang, X., Horn, H. G., Spielvogel, J., Gerhart, C., Southgate, J., et al. (2009). Calibration of Condensation Particle Counters for Legislated Vehicle Number Emission Measurements. Aerosol Sci. Technol., 43:1164–1173.
- Grob, B., Burtscher, H., and Niessner, R. (2013). Charging of Ultra-Fine Aerosol Particles by an Ozone-Free Indirect UV Photo-Charger. Aerosol Sci. Technol., 47:1325–1333.
- Grob, B., Wolf, J. C., Kiwull, B., and Niessner, R. (2014). Calibration System with an Indirect Photoelectric Charger for Legislated Vehicle Number Emission Measurement Counters in the Single Counting Mode. J. Aerosol Sci., 70:50–58.
- Helsper, C., Mölter, W., Löffler, F., Wadenpohl, C., Kaufmann, S., and Wenninger, G. (1993). Investigations of a New Aerosol Generator for the Production of Carbon Aggregate Particles. Atmos. Environ., 28A:1271–1275.
- Jensen, R. K., Korcek, S., Mahoney, L. R., and Zinbo, M. (1979). Liquid-Phase Autoxidation of Organic Compounds at Elevated Temperatures. 1. The Stirred Flow Reactor Technique and Analysis of Primary Products from n-Hexadecane Autoxidation at 120–180°C. J. Am. Chem. Soc., 101:7574–7584.
- Jing, L. (1999). Standard Combustion Aerosol Generator (SCAG) for Calibration Purposes, in 3rd ETH Workshop “Nanoparticle Measurement,” 9–10 August, Zürich.
- Khalek, I., Kittelson, D., and Brear, F. (2000). Nanoparticle Growth During Dilution and Cooling of Diesel Exhaust: Experimental Investigation and Theoretical Assessment. SAE Technical Paper, 2000-01-0515.
- Khlystov, A. (2014). Effect of Aerosol Volatility on the Sizing Accuracy of Differential Mobility Analyzers. Aerosol Sci. Technol., 48:604–619.
- Kulmala, M., Mordas, G., Petäjä, T., Grönholm, T., Aalto, P. P., Vehkamäki, H., et al. (2007). The Condensation Particle Counter Battery (CPCB): A New Tool to Investigate the Activation Properties of Nanoparticles. J. Aerosol Sci., 38:289–304.
- Liu, B., and Kim, C. (1977). On the Counting Efficiency of Condensation Nucleus Counters. Atmos. Environ., 11:1097–1100.
- Mamakos, A., Giechaskiel, B., and Drossinos, Y. (2012). Experimental and Theoretical Investigations of the Effect of the Calibration Aerosol Material on the Counting Efficiencies of TSI 3790 Condensation Particle Counters. Aerosol Sci. Technol., 47:11–21.
- Mamakos, A., Khalek, I., Giannelli, R., and Spears, M. (2013). Characterization of Combustion Aerosol Produced by a Mini-CAST and Treated in a Catalytic Stripper. Aerosol Sci. Technol., 47:927–936.
- Maricq, M. M. (2007). Chemical Characterization of Particulate Emissions from Diesel Engines: A Review. J. Aerosol Sci., 38:1079–1118.
- Maricq, M. M. (2014). Examining the Relationship Between Black Carbon and Soot in Flames and Engine Exhaust. Aerosol Sci. Technol., 48:620–629.
- Marshall, I., and Sandbach, E. (2007). Particle Number Counter Calibration Procedures, AEA Technology plc, United Kingdom.
- Matter, U., Siegmann, H. C., and Burtscher, H. (1999). Dynamic Field Measurements of Submicron Particles from Diesel Engines. Environ. Sci. Technol., 33:1946–1952.
- McMurry, P. H. (2000a). The History of Condensation Nucleus Counters. Aerosol Sci. Technol., 33:297–322.
- McMurry, P. H. (2000b). A Review of Atmospheric Aerosol Measurements. Atmos. Environ., 34:1959–1999.
- Meuller, B. O., Messing, M. E., Engberg, D. L. J., Jansson, A. M., Johansson, L. I. M., Norlén, S. M., et al. (2012). Review of Spark Discharge Generators for Production of Nanoparticle Aerosols. Aerosol Sci. Technol., 46:1256–1270.
- Moore, R. H., Ziemba, L. D., Dutcher, D., Beyersdorf, A. J., Chan, K., Crumeyrolle, S., et al. (2014). Mapping the Operation of the Miniature Combustion Aerosol Standard (Mini-CAST) Soot Generator. Aerosol Sci. Technol., 48:467–479.
- Niessner, R. (1986). The Chemical Response of the Photo-Electric Aerosol Sensor (PAS) to Different Aerosol Systems. J. Aerosol Sci., 17:705–714.
- Niessner, R., Daeumer, B., and Klockow, D. (1990). Investigation of Surface Properties of Ultrafine Particles by Application of a Multistep Condensation Nucleus Counter. Aerosol Sci. Technol., 12:953–963.
- Niessner, R., and Helsper, C. (1985). Application of a Multistep Condensation Nuclei Counter as a Detector for Particle Surface Composition. J. Aerosol Sci., 16:201–209.
- Niessner, R., and Klockow, D. (1980). Modified La Mer-Generator for the Production of Small Amounts of Sulfuric Acid Aerosol. Anal. Chem., 52:594–595.
- Petters, M. D., Prenni, A. J., Kreidenweis, S. M., DeMott, P. J., Matsunaga, A., Lim, Y. B., et al. (2006). Chemical Aging and the Hydrophobic - to - Hydrophilic Conversion of Carbonaceous Aerosols. Geophys. Res. Lett., 33:L24806.
- Rönkkö, T., Lähde, T., Heikkilä, J., Pirjola, L., Bauschke, U., Arnold, F., et al. (2013). Effects of Gaseous Sulphuric Acid on Diesel Exhaust Nanoparticle Formation and Characteristics. Environ. Sci. Technol., 47:11882–11889.
- Scheibel, H., and Porstendörfer, J. (1983). Generation of Monodisperse Ag- and NaCl-Aerosols with Particle Diameters between 2 and 300 nm. J. Aerosol Sci., 14:113–126.
- Schneider, J., Hock, N., Weimer, S., and Borrmann, S. (2005). Nucleation Particles in Diesel Exhaust: Composition Inferred from in Situ Mass Spectrometric Analysis. Environ. Sci. Technol., 39:6153–6161.
- Sem, G. (2002). Design and Performance Characteristics of three Continuous-Flow Condensation Particle Counters: A Summary. Atmos. Res., 62:267–294.
- Shi, J. P., and Harrison, R. M. (1999). Investigation of Ultrafine Particle Formation during Diesel Exhaust Dilution. Environ. Sci. Technol., 33:3730–3736.
- UNECE (2011a). Regulation 49, Revision 5 incl. Amendment 1. Available at: http://eur-lex.europa.eu/legal-content/EN/TXT/PDF/?uri=CELEX:42013´0624%2801%29&qid=1399562643262&from=EN.
- UNECE, (2011b). Regulation 83, Revision 4. Available at: http://www.unece.org/fileadmin/DAM/trans/main/wp29/wp29regs/r083r4e.pdf.
- Wang, X., Caldow, R., Sem, G., Hama, N., and Sakurai, H. (2010). Evaluation of a Condensation Particle Counter for Vehicle Emission Measurement: Experimental Procedure and Effects of Calibration Aerosol Material. J. Aerosol Sci., 41:306–318.
- Wiedensohler, A., and Fissan, H. J. (1988). Aerosol Charging in High Purity Gases. J. Aerosol Sci., 19:387–389.