
Abstract
The variability of optical properties of combustion particles generated from a propane diffusion flame under varying fuel-to-air (C/O) ratios was studied with a three-wavelength nephelometer, a particle soot absorption photometer, and an integrating sphere photometer. Information on particle size distribution, morphology, and elemental carbon to total carbon (EC/TC) ratios were obtained from scanning mobility particle sizer measurements, transmission electron microscopy analyses, and thermal-optical analyses. Particles generated under a low C/O ratio (0.22) showed high elemental carbon fraction (EC/TC = 0.77) and low brown carbon to equivalent black carbon (BrC/EBC) ratio (0.01), and were aggregates composed of small primary particles. Rayleigh–Debye–Gans theory reproduced experimental single-scattering albedo, ω, absorption, and scattering Ångström exponents within 56, 3, and 18%, respectively. In contrast, particles produced under a high C/O ratio (0.60) showed low elemental carbon fraction (EC/TC = 0.09) and high BrC/EBC ratio >100, and were smaller and spherical in shape. Their optical properties were better modeled with Mie theory. By minimizing the difference between calculated and measured ω and Ångström exponents, refractive indices of OC at three visible wavelengths were deduced. Contrary to the widely accepted assumption that refractive index of BC is wavelength independent, BC-rich particles exhibited absorption Ångström exponent >1.0 which implies some degree of wavelength dependence.
Copyright 2015 American Association for Aerosol Research
1. INTRODUCTION
The significant impact of atmospheric aerosols on regional and global climate is now widely recognized and atmospheric models, used in the assessment of radiative forcing, have been improved to include important aerosol species (Forster et al. Citation2007). Among those, black carbon (BC) is the most strongly absorbing aerosol material in the atmosphere (Bond and Bergstrom Citation2006). Most of aerosol BC is anthropogenic in origin and originates from combustion of fossil fuel, biogenic fuel, and biomass burning (Ramanathan and Carmichael Citation2008; Bond et al. Citation2013). The terminology used in this work follows Petzold et al. (Citation2013): the term black carbon (BC) is used as a qualitative term for light-absorbing carbonaceous substances, black carbon mass determined by optical absorption methods is referred to as equivalent black carbon (EBC), and the term elemental carbon (EC) is used in thermochemical classification.
In recent years, there has been increasing evidence that organic carbon (OC) can also have appreciable light absorption, especially in the UV region (Jacobson Citation1999; Bond Citation2001; Kirchstetter et al. Citation2004; Hoffer et al. Citation2006; Schnaiter et al. Citation2006). This light absorbing OC is commonly referred to as brown carbon (BrC) because the stronger absorption toward shorter wavelengths gives rise to brownish colors (Andreae and Gelencsér Citation2006; Alexander et al. Citation2008). Aerosol BrC originates from various sources such as biomass burning (Kirchstetter et al. Citation2004; Clarke et al. Citation2007; Lewis et al. Citation2008), smoldering combustion (Patterson and McMahon Citation1984; Chakrabarty et al. Citation2010), and natural biogenic emissions (Andreae and Crutzen Citation1997; Graber and Rudich Citation2006). BrC can be also formed as secondary aerosol from heterogeneous reactions, e.g., of gaseous isoprene on acidic particles (Limbeck et al. Citation2003).
BrC is thought to have molecular structures similar to polycyclic aromatic hydrocarbons (PAH) or humic-like substances (HULIS) but there is still a high degree of uncertainty regarding its exact chemical composition and origin (Pöschl Citation2003; Moosmüller et al. Citation2009). Compared to graphite-like BC, BrC has a lower degree of graphitization which means that its optical gap between filled valence band and unfilled conduction band is larger, and the absorption is shifted to shorter wavelengths. Because of the strong contribution of combustion-generated particles to atmospheric light absorption, many experimental and theoretical studies have been carried out to investigate their optical properties (Berry and Percival Citation1986; Dobbins et al. Citation1994; Köylü and Faeth Citation1994; Fuller Citation1995; Schnaiter et al. Citation2003; Schnaiter et al. Citation2006; Chakrabarty et al. Citation2007). However, full characterizations incorporating chemical and physical analyses are scarce. Particularly, there is still insufficient data on optical properties of BrC compared to that of BC.
In this article, we investigate how well frequently used models for aerosol optical properties like Mie theory and/or Rayleigh–Debye–Gans theory can reproduce measured optical properties of combustion aerosols of various chemical composition and morphology. We present an optical closure study, which is complemented by a chemical and physical characterization of combustion particles. Our main goals are to obtain a better understanding of the complex refractive index of the OC fraction and the closure of modeled and measured optical properties of combustion aerosols.
2. METHODS
2.1. Experimental Approach
The schematic of the experimental setup is shown in . In a Real Soot Generator RSG miniCAST 6201-C (Jing Ltd., Switzerland; hereafter referred to as CAST burner), combustion particles were formed through pyrolysis within a propane (C3H8)—air co-flow diffusion flame and rapidly quenched downstream the flame zone by adding a quenching gas (N2). summarizes operating conditions of the CAST burner.
TABLE 1 Operating conditions of the CAST burner
FIG. 1. Schematic diagram of the experimental setup. TD is a thermal denuder.
The combustion aerosol was sampled with a Multi-Angle Absorption Photometer (MAAP, Thermo Scientific Model 5012) for the measurement of EBC mass concentration and with four Condensation Particle Counters (CPC, Grimm Model 5410) for the measurement of particle number concentrations. Among the four CPCs, two of them (one was used as backup, in case the other one failed during the experiment) measured total particle concentration and the other two (one of them as backup), which were connected to a thermal denuder (set to 250°C), measured nonvolatile particle concentration. Injection diluters of the type Palas VKL (dilution ratios 1:10 and 1:100) were used to dilute particle number concentrations below the upper measurement range of the instruments (Nmax = 105 cm−3). Particle mobility size distributions were measured by a Grimm SMPS+E scanning mobility particle sizer connected to a Faraday cup electrometer. Dilution ratios were monitored by Carbondio CO2 sensors (Pewatron).
The aerosol absorption coefficient, σap, was measured by a Particle Soot Absorption Photometer (PSAP, Radiance Research, USA), applying the correction scheme according to Virkkula et al. (Citation2005, Virkkula Citation2010), and a 7-λ Aethalometer (Magee Scientific, USA). The particle scattering coefficient, σsp, was determined by an Integrating Nephelometer (TSI model 3563), applying the truncation angle correction of Massoli et al. (Citation2009). Elemental carbon (EC) and total carbon (TC) were determined from quartz filter samples using a Sunset analyzer (Birch and Cary Citation1996). Although we applied both EUSAAR-2 (Cavalli et al. Citation2010) and NIOSH 5040 (NIOSH Citation2003) temperature protocols combined with laser transmission correction, the values from the NIOSH 5040 method were consistently used for the final data analysis. The manual setting of the split point was used for samples generated under low C/O ratios (0.22 and 0.31), while the automatic setting was used for samples from high C/O ratios (0.40 and 0.60).
A Mini-impactor was used to collect aerosols on Transmission Electron Microscope (TEM) grids (AGAR Scientific; Holey Carbon Film). The aerosol samples were observed using a JEOL JEM-3010 TEM having an edge-to-edge resolution of 0.16 nm at 300 keV. Experiments were performed in the bright field mode with an electron beam energy of 300 keV, and magnifications in the range 30,000–100,000. Aerosol particles were first randomly selected at low magnification and then they were analyzed at higher magnification. TEM pictures were recorded with a CCD camera (GATAN, ORIUS SC1000), and ImageJ (Rasband Citation1997) was used to digitize TEM images. The primary particle diameter and radius of gyration (Rg) of aggregates were determined from gray level and digitized images, respectively. The geometric diameter of primary particle (dpp) was determined from the primary particle lognormal size distribution. Then Ensemble Analysis was used to determine the fractal dimension from Rg and dpp (Chakrabarty et al. Citation2011).
An integrating sphere (IS) photometer was used to estimate the BrC content of the samples using the modified technique described by Wonaschütz et al. (Citation2009). In this method, different calibration curves obtained for proxy substances (Elftex 125 by Cabot Corp for BC, humic acid sodium salt, Acros Organics, no. 68131-04-4 for BrC) at three different wavelengths (450, 550 and 650 nm) are used to iteratively separate the contribution of EBC and BrC to the absorption signal given by the photometer. The EBC and BrC concentrations obtained with this method, therefore, correspond to concentrations of the proxy substances that would give the same absorption signal. As humic acid sodium salt contains only 0.47% carbon, the proxy concentrations were converted to BrC-carbon using this factor.
2.2. Theoretical Approach
Two different modeling approaches were used to reproduce the measured intensive optical properties of combustion particles generated under varying C/O ratios: Rayleigh–Debye–Gans (RDG) theory (Sorensen Citation2001) treats particles as fractal-like aggregates of small primary spheres, while Mie theory (Bohren and Huffman Citation1983) assumes spherical particles; see the online supplementary information (SI) for details.
For fractal-like combustion particles, self-similarity of the aggregates allows the number of primary spheres (Nps) to be related to the overall aggregates size (Rg) through[1] where k0 is a proportionality constant, a is the monomer radius, and D is the fractal dimension.
The particle mobility radius (Rm) was measured with the SMPS but in order to apply RDG theory, Rm was converted to Rg using an approach based on a review paper on the mobility of fractal aggregates (Sorensen Citation2011; see the SI for details). This approach yields the simplified relations[2]
[3] where the spread in the monomer size was not accounted for in the calculation and all monomers were assumed to have a = 5 nm. x is related to the Knudsen number (Kn) through x = 0.51Kn0.043.
Based on Rm and Nps, Rg was calculated from[4] where β = 1.18Nps−0.11 for Nps = 2–100 and β = 0.75 for Nps > 100 in the Continuum Regime whereas β = 1.16Nps−0.10 for all Nps in the Free Molecular Regime. Therefore, for the particles in the Slip Regime with Nps > 100, β will be between the upper and the lower limits set by the Continuum and the Free Molecular Regimes, respectively. For our calculation, β = 1.16Nps−0.10 was used. The error in β caused by using this expression rather than the exact expression for the Slip Regime (which is unknown) is estimated to be <10% for Nps < 200.
The complex refractive index (RI; m = mr−imi) used in the RDG and the Mie calculations were derived using the linear mixing rule where mr and mi values of BC and OC were weighted according to their volume fractions to yield the effective RI. In the experiment, the EC fraction was measured in terms of TC mass fraction and therefore it had to be changed to the volume fraction by taking EC and OC densities as 1.8 g cm−3 (Bond and Bergstrom Citation2006) and 1.0 g cm−3 (estimated), respectively. The BC and OC RI values used in the calculation are presented in . The mr and mi values of BC were obtained from a polynomial fit to the previously reported soot RI over the wavelength range of 400–1000 nm (Ackerman and Toon Citation1981), and those of OC were deduced from this experiment. The linear mixing rule was tested against the Maxwell Garnett and Bruggeman mixing rules (Bruggeman Citation1935; Bohren and Huffman Citation1983; Garnett Citation1904), and all mixing rules gave similar effective RIs. Hence, use of the simple linear mixing rule is justified.
TABLE 2 Real (mr) and imaginary (mi) parts of the refractive index of black and organic carbon components of combustion particles
The RI of OC at λ = 467, 530, and 660 nm were deduced by finding the RI combinations which gave the best match between the calculated (using Mie theory) and the measured single scattering albedo (ω), absorption Ångström exponent (αabs), and scattering Ångström exponent (αscat) for particles with high OC content (EC/TC = 0.088) at wavelength intervals 467–530, 530–660, and 467–660 nm. Absolute values of the percentage deviations for all optical parameters were summed to yield ∑dev(%). During the calculation, mr was varied from 1.45 to 1.61 in steps of 0.02, and mi was varied from 0 to 0.15 in steps of 0.01. In order to reduce calculation time, the following assumptions were made: the mi value at a lower wavelength was assumed to be larger than that at a higher wavelength, and the mr at a lower wavelength was assumed to be equal to or greater than that at a higher wavelength. These assumptions were based on the previous observations that OC absorbs more strongly at shorter wavelengths.
3. RESULTS
3.1. Physical and Chemical Properties
The physical and chemical properties of the emitted combustion aerosol are summarized in together with the respective CAST operating conditions. shows count median mobility diameters, and BrC/EBC and EC/TC ratios of combustion particles produced at varying C/O ratios. As mentioned in Section 2.1, EC/TC data originated from the NIOSH 5040 temperature protocol. Comparison of EC/TC ratios from NIOSH 5040 and EUSAAR-2 protocols yielded good agreement between both methods: R2 = 0.968 for 16 data pairs and a slope of 1.10 for the linear regression line when EUSAAR-2 data was plotted against NIOSH 5040 data. Deviations were ≤15% for EC/TC ratios >0.50, and increased to 30% for low EC/TC ratios. A detailed comparison of the applied thermal–optical methods, however, is beyond the scope of this article and will be published elsewhere.
FIG. 2. (a) Elemental carbon to total carbon ratio (error bars indicate one standard deviation), (b) brown carbon to black carbon ratio (error bars indicate one standard deviation), and (c) count median mobility diameter (error bars represent the 25th and the 27th percentiles) plotted as a function of C/O ratio. The dotted curve is taken from the data of Schnaiter et al. (Citation2006). The stoichiometric C/O ratio (C/O = 0.3) is also marked. The stoichiometric ratio separates burner conditions into fuel-lean and fuel-rich conditions.
illustrates the size distributions of particles in the exhaust of the CAST. Particles generated under low C/O ratios were >100 nm in mobility diameter and of high EC/TC and low BrC/EBC ratios, while those produced under high C/O ratios had smaller mobility diameters (<50 nm), low EC/TC and high BrC/EBC ratios. Please note that the optical data for the highest C/O ratio (Condition 5) were not used in the further analysis since the measured values were close to the detection limit of the instruments. shows TEM pictures of sampled particles. Particles generated under a low C/O ratio were fractal-like aggregates with D = 1.74 ± 0.08 and a = 5–6 nm, while those generated under a high C/O ratio were nearly spherical in shape.
FIG. 3. Mobility size distributions of particles generated from the CAST burner under different combustion conditions. The legend shows measured EC/TC ratios for these particles.
FIG. 4. TEM pictures of combustion particles generated under (a) C/O ratio = 0.22 and (b) C/O ratio = 0.6.
3.2. Determination of Organic Carbon Refractive Indices
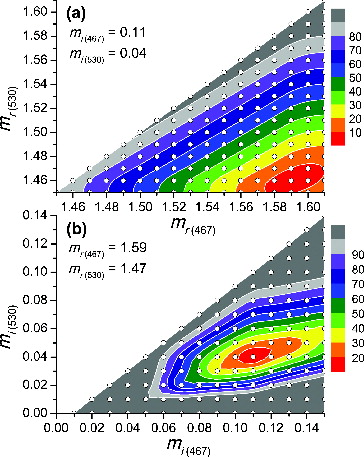
As described in the Section 2.2, mr and mi values of the OC component at different visible wavelengths () were inferred from the experimental data by minimizing the difference between the calculated and measured optical properties. Initially, “central” mr and mi values were determined as follows. In the analysis of the 467–530 nm and the 467–660 nm intervals, the same mr and mi values for 467 nm (mr(467) = 1.59 and mi(467) = 0.11) gave the minimum ∑dev(%). In the analysis of the 530–660 nm interval, it was found that ∑dev(%) was minimized when mr(530) = mr(660). Hence, mr(660) = 1.47 obtained from the analysis of the 467–660 nm interval was also used as mr(530). mi(530) = 0.04 and mi(660) = 0 were values retrieved using the 467–530 nm and the 467–660 nm intervals, respectively.
Based on these ‘central’ values, uncertainties in mr and mi were determined by looking at the RI combinations which gave less than a certain ∑dev(%) value. For example, in order to determine uncertainties in mr(467) and mr(530) from the 467–530 nm interval analysis, mi(467) and mi(530) were fixed to the ‘central’ values (0.11 and 0.04, respectively), and ∑dev(%) values for different mr(467)– mr(530) pairs were examined ( and Table S1 in the SI). In this case, the RI combinations which gave ∑dev(%) <10% were accepted so the ranges of mr(467) and mr(530) were constrained to 1.58–1.60 and 1.45–1.47, respectively. In a similar way, ranges in mr and mi were determined from other interval analyses, and these results are presented in Table S2. The contour plots in and Figure S1 also help to visualize uncertainties in the mr and mi values, and they demonstrate that mr and mi values were uniquely determined (only one global minimum) within narrow ranges.
FIG. 5. Contour plots of ∑dev(%) for the 467–530 nm interval in the plane of (a) real and (b) imaginary RI values with the other two RIs fixed to the values shown on each graph. Hollow circles indicate location of the data points.
3.3. Sensitivity Analysis
The uncertainties in the calculated values of ω, αabs, and αscat could not be determined in a straightforward manner due to the complexity of the calculation models. Instead, a sensitivity analysis (Dobbins et al. Citation1994; Chakrabarty et al. Citation2007) was carried out to estimate relative errors associated with the calculated ω, σabs, and σsca. Estimation of errors for αabs and αscat were deemed too complex since it involved calculations at two different wavelengths so instead, errors for σabs and σsca were estimated.
A sensitivity analysis determines the extent to which different parameters affect the outcome of a model. If y = f (xi) for i = 1 to n independent variables, then the total (relative) error associated with y,ϵy, is given by[5] where the influence coefficient, Ii, is defined as
[6] and ϵxi is the relative uncertainty associated with parameter xi. The influence coefficients for ω, σabs, and σsca were evaluated for a low C/O condition at λ = 467 nm using RDG theory, and the input parameters listed in . All parameters were varied by 5% in the calculation of Ii. The calculated Ii values are summarized in . A negative Ii implies that increase in the parameter xi reduces the value of y: for example, when D is increased, ω is decreased. It can be seen that ω, σabs, and σsca are most sensitive to changes in a and BC mr. Changes in D have no effect on σabs since D is not used in the calculation of σabs. Also shown in are the ϵxi for each parameter and how these were derived. Although uncertainties in the OC mr and mi were obtained from this experiment, larger uncertainties were used for calculation to encompass the wide ranges of previously reported values. From the values of Ii and ϵxi given in , uncertainties in ω, σabs, and σsca were calculated as 30, 27, and 50%, respectively.
TABLE 3 Results of the sensitivity analysis for particles containing a high EC fraction
A similar analysis was carried out for a high C/O condition at λ = 467 nm using Mie theory. Calculated Ii values and estimated ϵxi values are presented in Table S3. Changes in OC mr have the greatest influence on ω and σsca. The estimated uncertainties in ω, σabs, and σsca are 40, 38, and 31%, respectively. The estimated uncertainties seem rather large but we would like to stress that these are very generous estimates.
3.4. Optical Properties
shows the calculated and experimental ω values at λ = 530 nm as a function of particle EC/TC ratio. The results for λ = 467 and 660 nm are presented in Figure S2. For particles with high EC fraction (EC/TC ratio = 0.77), the experimentally measured ω values lie between the values calculated from the two theories. On average, RDG theory underestimates by 56%, and Mie theory based on the volume equivalent diameter overestimates by 47%. In contrast, for particles with high OC fraction (EC/TC ratio = 0.09 and 0.12), only Mie theory gives a good match (∼4% agreement on average), and RDG theory fails to reproduce the experimental data. For particles with intermediate EC fraction (EC/TC ratio = 0.62), Mie theory gives better match with the experimental data than RDG theory.
FIG. 6. Single scattering albedo (ω) vs. elemental carbon to total carbon ratio for λ = 530 nm. Filled squares: experimental data (with error bars of one standard deviation). Hollow triangles: Mie theory. Hollow circles: RDG theory.
Generally, ω values are larger for particles containing higher OC fractions because OC absorbs less strongly than BC. One exception is particles with EC/TC ratio = 0.12 (Condition 3) which exhibit greater ω values than particles with EC/TC ratio = 0.09 (Condition 4). This is somewhat intriguing upon first inspection since greater OC content is expected to result in a higher ω value, but it has to be remembered that particle size also influences optical properties. From and , it can be seen that particles from Condition 3 had larger mobility diameters with a wider size distribution than particles from Condition 4. In order to investigate the effect of size distribution, ω values at λ = 660 nm were calculated as a function of count median diameter for two different geometric standard deviations (σg = 1.69 and 2.22) using Mie theory and RI based on EC/TC ratio = 0.1 (intermediate EC/TC ratio between the two conditions). The results (Figure S3) showed that the width of the size distribution alone can have a dramatic effect on ω. Since larger particles are more effective at scattering, particles with a wider size distribution which includes a greater fraction of large particles will yield larger ω values.
In , αabs and αscat values for the 467–660 nm interval are plotted against particle EC/TC ratio. For αabs, both RDG and Mie calculations give a good match with the experimental data at all EC/TC ratios although RDG theory gives a better agreement (<3% deviation) at high EC/TC ratios. There are greater discrepancies between the experimental and calculated αscat values but generally, RDG theory gives a closer agreement at high EC/TC ratios, whereas Mie theory gives better agreement at low EC/TC ratios. The αabs value increases with increasing OC fraction in the particle since RI of OC has a stronger spectral dependence than RI of BC. The differences in the spectral dependence of absorption by BC and OC were even visible on filter samples. The filter samples containing high EC fractions were black whereas those high in OC were brown.
FIG. 7. (a) Absorption (αabs) and (b) scattering (αsca) Ångström exponents plotted as a function of elemental carbon to total carbon ratio for the 467–660 nm interval. Filled squares: experimental data (with error bars of one standard deviation). Hollow triangles: Mie theory. Hollow circles: RDG theory.
4. DISCUSSION
The distinct changes in the physical and chemical properties of combustion particles as a function of the C/O ratio corroborate the findings of other groups that also investigated combustion particles generated from a propane/O2 flame (Slowik et al. Citation2004; Schnaiter et al. Citation2006; Moore et al. Citation2014). Previous studies showed that high C/O ratios produce spherical, OC-dominated particles with mobility diameter of 10–60 nm, while particles generated under low C/O ratios were agglomerates of primary particles (25–30 nm in diameter), consisted mainly of EC and had larger mobility diameters (70–130 nm). The dependence of particle EC fraction on the C/O ratio, taken from Schnaiter et al. (Schnaiter et al. Citation2006), is shown in as a comparison with our results. Although the two curves do not match because of the different types of CAST burners used, the trend of decreasing EC fraction with increasing C/O ratio is apparent.
Under intermediate combustion conditions (C/O ratio = 0.3–0.37), Schnaiter et al. and Moore et al. observed bimodal size distributions (Schnaiter et al. Citation2006; Moore et al. Citation2014). The presence of an additional mode in the size distribution was not clearly discernible in our measurements but in the light of previous studies, particles generated under intermediate C/O ratios are expected to be mixtures of EC-rich, fractal-like agglomerates and much smaller spherical, condensed organic species. It is more difficult to model the optical properties, especially scattering, for a mixture of particles with completely different morphologies. Perhaps, this may explain the disagreement between the calculated and measured αscat for C/O ratio = 0.31 and 0.40 shown in . Particles generated under more extreme conditions (C/O ratio = 0.22 and 0.60) are less likely to be mixtures, and their optical properties can be modeled more successfully with RDG and Mie theories, which take different morphologies of EC- and OC-rich particles into account.
Mie and RDG theories reproduce experimental αabs values well, whereas there are greater discrepancies between the measured and calculated ω and αscat values. This result may be interpreted by considering the different natures of scattering and absorption. Absorption is mostly dependent on the total particle volume and therefore, absorption properties are successfully modeled by both volume-equivalent Mie and RDG theories. In contrast, scattering is not only dependent on the particle volume but also on other factors such as particle size and morphology. Mie theory fails to model scattering for EC-rich particles because it ignores their fractal-like morphology but even RDG theory shows ∼56% (ω) and ∼18% (αscat) deviations from experimental data.
RDG theory may underestimate scattering due to the uncertainty in the primary particle size. The sensitivity analysis presented in Section 3.3 showed that σsca is very sensitive to changes in a. Another factor that may contribute to the underestimation of scattering is that the full primary particle size distribution was not included in the calculation. In the RDG calculation, all primary particles were assumed to have the same size (a = 5 nm) but in reality there is a size distribution, with the geometric size distribution of ∼0.3. According to Farias et al. (Citation1996b), scattering properties are more strongly influenced by aggregate polydispersity than primary particle polydispersity and therefore, only the latter was taken into account during the calculation. There is also some uncertainty related to the use of empirical equations (EquationEquations (2)[2] –Equation(4)
[4] ) to convert Rm into Rg. Therefore, greater uncertainties lie in the calculated scattering properties than the calculated absorption properties.
For small particles in the Rayleigh regime, αabs = 1 if the RI is constant across the wavelengths considered. Previous experiments demonstrated that particles rich in BC have αabs∼1 in the visible spectrum (Bergstrom et al. Citation2002; Kirchstetter et al. Citation2004; Schnaiter et al. Citation2006; Clarke et al. Citation2007). Based on these observations and the Band-gap theory, the assumption of a constant RI throughout the visible spectrum for BC was recommended (Bond and Bergstrom Citation2006). However, as can be seen in , the observed αabs values are >1 even for particles with a relatively high EC fraction. Spectral dependence of OC light absorption alone could not account for the observed αabs values. When a constant BC RI of m = 1.95 + i0.79 (one of the values suggested by Bond and Bergstrom) was used for all wavelengths in the calculation, the αabs value for an EC/TC ratio = 0.77 in the 467–660 nm interval was underestimated by ∼22% whereas ∼1% match between the experiment and the calculation was obtained when the BC RI values presented in were used. Therefore, we expect the BC produced in our experiment to exhibit some variation of RI with wavelength although its wavelength dependence would be insignificant compared to that of OC, and the commonly used λ−1 approximation would be still reasonable.
In , mi values of OC obtained from the current experiment are compared with previously reported values. The mi values given by Sato et al. (Sato et al. Citation2003), based on absorption coefficient measurements of urban aerosol and biomass smoke samples, show the weakest spectral dependence. Kirchstetter and co-workers (Kirchstetter et al. Citation2004) derived mi values from light transmission measurements on OC extracted from biomass samples. A polynomial fit through their data is also shown in . Adler et al. (Adler et al. Citation2010) used cavity ring-down spectroscopy to retrieve RI values of water soluble matter (WSM) and organic soluble matter (OSM) extracted from fresh diesel soot OC. OSM and WSM had similar mi values at 532 nm but OSM had a significantly higher mi than WSM at 355 nm. Their finding is consistent with that of Chen and Bond (Chen and Bond Citation2010) who found in their wood combustion study that absorption is dominated by organic soluble OC.
FIG. 8. Imaginary component of the refractive index (mi) for organic carbon as a function of wavelength. Filled circles: Kirchstetter (2004). Filled triangles: organic soluble matter, Adler et al. (Citation2010). Hollow triangles: water soluble matter, Adler (2010). Filled squares: Sato (2003). Filled stars: from this study. The solid line is a polynomial fit through the Kirchstetter data with the equation mi = 1.4304–6.49 × 10⁻³λ + 1.0126 × 10⁻⁵λ2–5.3939 × 10⁻⁹λ3.
Some caution has to be taken in making a direct comparison since different experiments studied different kinds of OC and mi values were also derived in different ways. Nonetheless, all experiments show a consistent trend of decreasing mi with increasing wavelength, and the agreement between different experiments is remarkably good for λ ≥ 530 nm. The discrepancies between mi values at shorter wavelengths (λ ≤ 500 nm) could be real and may arise from differences in chemical composition of OC depending on emission sources. The aromatic component of OC is expected to cover a wide range of conjugation, from a few conjugated aromatic rings to an extended network of aromatic rings (Andreae and Gelencsér Citation2006). Therefore, absorption characteristics of OC will vary almost continuously, with increasing absorption as the degree of conjugation increases.
5. CONCLUSIONS
Optical properties of combustion particles produced from the CAST burner at varying fuel-to-air ratios were studied in conjunction with thermo-optical and TEM analyses. Particles produced at a low C/O ratio (C/O ratio = 0.22) contained a high EC fraction and were fractal-like particles consisting of small primary spheres. They showed low ω values (ω ≤ 0.1) and αabs close to 1.0. For these particles, αabs and αscat values calculated by RDG theory agreed with the experimental results within 3 and 18%, respectively, while ω was underestimated by 56%. Optical parameters related to scattering (αscat and ω) were less satisfactorily modeled, possibly due to the effect of multiple scattering and greater uncertainties associated with particle morphology. Particles formed at a high C/O ratio (C/O ratio = 0.6) contained more OC and were spherical in shape. They had a higher ω value (ω ≥ 0.2) and αabs > 5. Their optical properties were better modeled with Mie theory. Optical properties of particles produced under intermediate combustion conditions were more difficult to model, perhaps because the particles were mixtures of aggregates and single spheres. The results of the study suggest that RDG theory, which is frequently used to model optical properties of combustion particles, should be only used for EC-rich, fractal-like aggregates which are generated under fuel-lean conditions.
The RI of OC at λ = 467, 530 and 600 nm were inferred from the measured optical properties of OC-rich combustion particles. The deduced values were in good agreement with previously reported values for light absorbing OC and showed strong spectral dependence with stronger absorption at shorter wavelengths. The strong wavelength dependence of OC RI indicates that light absorption measurements of OC at a single wavelength should not be used to infer absorption in the full solar spectrum, reiterating the previous arguments by Andreae and Gelencsér (Citation2006). Furthermore, the outcome of the study implies that light absorption by atmospheric aerosol will be underestimated if the contribution of OC is ignored. Additional measurements of RI of OC aerosol from different sources are needed to better understand the effects of OC containing aerosols on global and regional radiative forcing.
SUPPLEMENTAL MATERIAL
Supplemental data for this article can be accessed on the publisher's website.
UAST_1020996_Supplementary_Information.zip
Download Zip (399.3 KB)ACKNOWLEDGMENTS
This work is dedicated to the memory of our dear friend and distinguished colleague Heidi Bauer. The authors are grateful for the valuable support from A. Ibrahim (DLR), M. Johnson (Rolls-Royce, UK), R. Marsh, and A. Crayford (Cardiff University, UK). We also thank Professor C. M. Sorensen (Kansas State University, USA) for helpful discussions.
Funding
The study was supported by the European Aviation Safety Agency under the SAMPLE II Contract EASA.2009.OP.18. Part of the operation was financed by the European Union, European Social Fund (P-MR-09/1).
REFERENCES
- Ackerman, T. P., and Toon, O. B. (1981). Absorption of Visible Radiation in Atmosphere Containing Mixtures of Absorbing and Non-Absorbing Particles. Appl. Opt., 20:3661–3668.
- Adler, G., Riziq, A. A., Erlick, C., and Rudich, Y. (2010). Effect of Intrinsic Organic Carbon on the Optical Properties of Fresh Diesel Soot. Proc. Natl. Acad. Sci. U.S.A., 107:6699–6704.
- Alexander, D. T. L., Crozier, P. A., and Anderson, J. R. (2008). Brown Carbon Spheres in East Asian Outflow and Their Optical Properties. Science, 321:833–836.
- Andreae, M. O., and Crutzen, P. J. (1997). Atmospheric Aerosols: Biogeochemical Sources and Role in Atmospheric Chemistry. Science, 276:1052–1058.
- Andreae, M. O., and Gelencsér, A. (2006). Black Carbon or Brown Carbon? The Nature of Light-Absorbing Carbonaceous Aerosols. Atmos. Chem. Phys., 6:3131–3148.
- Bergstrom, R. W., Pilewskie, P., Russell, P. B., Redemann, J., Bond, T. C., Quinn, P. K., and Sierau, B. (2007). Spectral Absorption Properties of Atmospheric Aerosols. Atmos. Chem. Phys., 7:5937–5943.
- Bergstrom, R. W., Russell, P. B., and Hignett, P. (2002). Wavelength Dependence of the Absorption of Black Carbon Particles: Predictions and Results from the Tarfox Experiment and Implications for the Aerosol Single Scattering Albedo. J. Atmos. Sci., 59:567–577.
- Berry, M. V., and Percival, I. C. (1986). Optics of Fractal Clusters such as Smoke. Opt. Acta, 33:577–591.
- Birch, M. E., and Cary, R. A. (1996). Elemental Carbon-Based Method for Monitoring Occupational Exposures to Particulate Diesel Exhaust. Aerosol Sci. Technol., 25:221–241.
- Bohren, C. F., and Huffman, D. R. (1983). Absorption and Scattering of Light by Small Particles. Wiley, New York.
- Bond, T. C. (2001). Spectral Dependence of Visible Light Absorption by Carbonaceous Particles Emitted from Coal Combustion. Geophys. Res. Lett., 28:4075–4078.
- Bond, T. C., and Bergstrom, R. W. (2006). Light Absorption by Carbonaceous Particles: An Investigative Review. Aerosol Sci. Technol., 40:27–67.
- Bond, T. C., Doherty, S. J., Fahey, D. W., Forster, P. M., Berntsen, T., DeAngelo, B. J., et al. (2013). Bounding the Role of Black Carbon in the Climate System: A Scientific Assessment. J. Geophys. Res.-Atmos., 118:5380–5552.
- Bruggeman, D. A. G. (1935). Berechnung Verschiedener Physikalischer Konstanten von Heterogenen Substanzen. I. Dielektrizitätskonstanten und Leitfähigkeiten Der Mischkörper Aus Isotropen Substanzen. Annalen der Physik, 416:665–679.
- Cavalli, F., Viana, M., Yttri, K. E., Genberg, J., and Putaud, J. P. (2010). Toward a Standardised Thermal-Optical Protocol for Measuring Atmospheric Organic and Elemental Carbon: The Eusaar Protocol. Atmospheric Measurement Techniques, 3:79–89.
- Chakrabarty, R. K., Garro, M. A., Garro, B. A., Chancellor, S., Moosmüller, H., and Herald, C. M. (2011). Simulation of Aggregates with Point-Contacting Monomers in the Cluster–Dilute Regime. Part 1: Determining the Most Reliable Technique for Obtaining Three-Dimensional Fractal Dimension from Two-Dimensional Images. Aerosol Sci. Technol., 45:75–80.
- Chakrabarty, R. K., Moosmüller, H., Arnott, W. P., Garro, M. A., Slowik, J. G., Cross, E. S., et al. (2007). Light Scattering and Absorption by Fractal-Like Carbonaceous Chain Aggregates: Comparison of Theories and Experiment. Appl. Opt., 46:6990–7006.
- Chakrabarty, R. K., Moosmüller, H., Chen, L. W. A., Lewis, K., Arnott, W. P., Mazzoleni, C., et al. (2010). Brown Carbon in Tar Balls from Smoldering Biomass Combustion. Atmos. Chem. Phys., 10:6363–6370.
- Chen, Y., and Bond, T. C. (2010). Light Absorption by Organic Carbon from Wood Combustion. Atmos. Chem. Phys., 10:1773–1787.
- Clarke, A., McNaughton, C., Kapustin, V., Shinozuka, Y., Howell, S., Dibb, J., et al. (2007). Biomass Burning and Pollution Aerosol over North America: Organic Components and Their Influence on Spectral Optical Properties and Humidification Response. J. Geophys. Res.-Atmos., 112:D12S18.
- Dobbins, R. A., Mulholland, G. W., and Bryner, N. P. (1994). Comparison of a Fractal Smoke Optics Model with Light Extinction Measurements. Atmos. Environ., 28:889–897.
- Farias, T. L., Köylü, Ü. Ö., and Carvalho, M. G. (1996a). Range of Validity of the Rayleigh-Debye-Gans Theory for Optics of Fractal Aggregates. Appl. Opt., 35:6560–6567.
- Farias, T. L., Köylü, Ü. Ö., and Carvalho, M. G. (1996b). Effect of Polydispersity of Aggregates and Primary Particles on Radiative Properties of Simulated Soot. J. Quant. Spectrosc. Radiat. Transfer, 55:357–371.
- Forster, P., Ramaswamy, V., Artaxo, P., Berntsen, T., Betts, R., Fahey, D. W., et al. (2007). Changes in Atmospheric Constituents and in Radiative Forcing, in Climate Change 2007:The Physical Science Basis. Contribution of Working Group I to the Fourth Assessment Report of the Intergovernmental Panel on Climate Change, S. Solomon, D. Qin, M. Manning, Z. Chen, M. Marquis, K. B. Averyt, M. Tignor, and H. L. Miller, eds., Cambridge University Press, Cambridge, United Kingdom and New York, NY, USA.
- Fuller, K. A. (1995). Scattering and Absorption Cross-Sections of Compounded Spheres. 2. Calculations for External Aggregation. J. Opt. Soc. Am. A, 12:881–892.
- Garnett, J. C. M. (1904). Colours in Metal Glasses and in Metallic Films. Philos. Trans. R. Soc. London, Ser., A 203:385–420.
- Graber, E. R., and Rudich, Y. (2006). Atmospheric HULIS: How Humic-Like Are They? A Comprehensive and Critical Review. Atmos. Chem. Phys., 6:729–753.
- Haynes, B. S., and Wagner, H. G. (1981). Soot Formation. Prog. Energy Combust. Sci., 7:229–273.
- Hoffer, A., Gelencser, A., Guyon, P., Kiss, G., Schmid, O., Frank, G. P., et al. (2006). Optical Properties of Humic-Like Substances (HULIS) in Biomass-Burning Aerosols. Atmos. Chem. Phys., 6:3563–3570.
- Jacobson, M. Z. (1999). Isolating Nitrated and Aromatic Aerosols and Nitrated Aromatic Gases as Sources of Ultraviolet Light Absorption. J. Geophys. Res., 104:3527–3542.
- Kirchstetter, T. W., Novakov, T., and Hobbs, P. V. (2004). Evidence that the Spectral Dependence of Light Absorption by Aerosols is Affected by Organic Carbon. J. Geophys. Res.-Atmos., 109:D21208.
- Köylü, Ü. Ö., and Faeth, G. M. (1994). Optical-Properties of Overfire Soot in Buoyant Turbulent-Diffusion Flames at Long Residence Times. J. Heat Trans.-T. ASME, 116:152–159.
- Lewis, K., Arnott, W. P., Moosmüller, H., and Wold, C. E. (2008). Strong Spectral Variation of Biomass Smoke Light Absorption and Single Scattering Albedo Observed with a Novel Dual-Wavelength Photoacoustic Instrument. J. Geophys. Res., 113:D16203.
- Limbeck, A., Kulmala, M., and Puxbaum, H. (2003). Secondary Organic Aerosol Formation in the Atmosphere via Heterogeneous Reaction of Gaseous Isoprene on Acidic Particles. Geophys. Res. Lett., 30(19), 1996, doi:10.1029/2003GL017738.
- Massoli, P., Murphy, D. M., Lack, D. A., Baynard, T., Brock, C. A., and Lovejoy, E. R. (2009). Uncertainty in Light Scattering Measurements by TSI Nephelometer: Results from Laboratory Studies and Implications for Ambient Measurements. Aerosol Sci. Technol., 43:1064–1074.
- Moore, R. H., Ziemba, L. D., Dutcher, D., Beyersdorf, A. J., Chan, K., Crumeyrolle, S., et al. (2014). Mapping the Operation of the Miniature Combustion Aerosol Standard (Mini-CAST) Soot Generator. Aerosol Sci. Technol., 48:467–479.
- Moosmüller, H., and Arnott, W. P. (2009). Particle Optics in the Rayleigh Regime. J. Air Waste Manage. Assoc., 59:1028–1031.
- Moosmüller, H., Chakrabarty, R. K., and Arnott, W. P. (2009). Aerosol Light Absorption and Its Measurement: A Review. J. Quant. Spectrosc. Radiat. Transfer, 110:844–878.
- Muñoz, R. H., and Charalampopoulos, T. T. (1998). Evolution of Compositional and Structural Properties of Soot in Premixed Alkane Flames. Symp. Int. Combust. Proc., 27:1471–1479.
- NIOSH. (2003). Method 5040 Issue 3: Elemental Carbon (Diesel Exhaust). in NIOSH Manual of Analytical Methods, Fourth Edition, National Institute of Occupational Safety and Health, Cincinnati, OH.
- Patterson, E. M., and McMahon, C. K. (1984). Absorption Characteristics of Forest Fire Particulate Matter. Atmos. Environ., 18:2541–2551.
- Petzold, A., Ogren, J. A., Fiebig, M., Laj, P., Li, S.-M., Baltensperger, U., et al. (2013). Recommendations for Reporting “Black Carbon” Measurements. Atmos. Chem. Phys., 13:8365–8379.
- Pöschl, U. (2003). Aerosol Particle Analysis: Challenges and Progress. Anal. Bioanal.Chem., 375:30–32.
- Ramanathan, V., and Carmichael, G. (2008). Global and Regional Climate Changes Due to Black Carbon. Nat. Geosci., 1:221–227.
- Rasband, W. S. (1997). ImageJ, U.S. National Institute of Health, Bethesda, Maryland, USA, Available at http://imageJ.nih.gov/ij/, 1997–2012.
- Sato, M., Hansen, J., Koch, D., Lacis, A., Ruedy, R., Dubovik, O., et al. (2003). Global Atmospheric Black Carbon Inferred from Aeronet. Proc. Natl. Acad. Sci. U.S.A., 100:6319–6324.
- Schnaiter, M., Gimmler, M., Llamas, I., Linke, C., Jaeger, C., and Mutschke, H. (2006). Strong Spectral Dependence of Light Absorption by Organic Carbon Particles Formed by Propane Combustion. Atmos. Chem. Phys., 6:2981–2990.
- Schnaiter, M., Horvath, H., Mohler, O., Naumann, K. H., Saathoff, H., and Schock, O. W. (2003). UV-VIS-NIR Spectral Optical Properties of Soot and Soot-Containing Aerosols. J. Aerosol Sci., 34:1421–1444.
- Slowik, J. G., Stainken, K., Davidovits, P., Williams, L. R., Jayne, J. T., Kolb, C. E., et al. (2004). Particle Morphology and Density Characterization by Combined Mobility and Aerodynamic Diameter Measurements. Part 2: Application to Combustion-Generated Soot Aerosols as a Function of Fuel Equivalence Ratio. Aerosol Sci. Technol., 38:1206–1222.
- Sorensen, C. M. (2001). Light Scattering by Fractal Aggregates: A Review. Aerosol Sci. Technol., 35:648–687.
- Sorensen, C. M. (2011). The Mobility of Fractal Aggregates: A Review. Aerosol Sci. Technol., 45:765–779.
- Turpin, B. J., and Lim, H. J. (2001). Species Contributions to PM2.5 Mass Concentrations: Revisiting Common Assumptions for Estimating Organic Mass. Aerosol Sci. Technol., 35:602–610.
- Virkkula, A. (2010). Correction of the Calibration of the 3-Wavelength Particle Soot Absorption Photometer (3λ PSAP). Aerosol Sci. Technol., 44:706–712.
- Virkkula, A., Ahlquist, N. C., Covert, D. S., Arnott, W. P., Sheridan, P. J., Quinn, P. K., et al. (2005). Modification, Calibration and a Field Test of an Instrument for Measuring Light Absorption by Particles. Aerosol Sci. Technol., 39:68–83.
- Wentzel, M., Gorzawski, H., Naumann, K. H., Saathoff, H., and Weinbruch, S. (2003). Transmission Electron Microscopical and Aerosol Dynamical Characterization of Soot Aerosols. J. Aerosol Sci., 34:1347–1370.
- Wonaschütz, A., Hitzenberger, R., Bauer, H., Pouresmaeil, P., Klatzer, B., Caseiro, A., et al. (2009). Application of the Integrating Sphere Method to Separate the Contributions of “Brown” and Black Carbon in Atmospheric Aerosols. Environ. Sci. Technol., 43:1141–1146.