
Abstract
Interaction forces acting between combustion-generated carbon particles were studied by using atomic force microscopy (AFM). To this aim, carbon nanoparticles were produced in fuel-rich ethylene/air laminar premixed flames with different equivalent ratios Φ, and analyzed at a fixed residence time in the flame. Particles were collected on mica substrates by means of a thermophoretic sampling system and then analyzed by AFM. A characterization of particle dimension and morphology were performed operating AFM in semicontact mode, showing that the shape of the particles collected on a sampling plate is never spherical. Increasing the flame-equivalent ratio, particle shape moves from an almost atomically thick object to thicker compounds, indicating the transformation from particles made of small, defective graphene-like sheets to particles containing stacked aromatic layers. Attractive and adhesive forces between a titanium nitride probe and sampled particles were calculated from force–distance curves acquired in AFM force spectroscopy mode. Assuming that van der Walls forces are the main contribution to attractive forces, the measurement of attractive forces allowed the evaluation of the Hamaker constant for the carbon particles as a function of the flame-equivalent ratio. The comparison of the measured Hamaker constants with the values for benzene and HOPG, suggests a continuous increase of the aromatic domains and the three-dimensional order within the particles when the flame-equivalent ratio increases.
Copyright 2015 American Association for Aerosol Research
1. INTRODUCTION
The study of soot particle formation in combustion systems has led to substantial progress during the past decades (Jander and Wagner Citation2009). Modeling and experimental activities have demonstrated that fuel-rich flame conditions produce particles with a wide size range roughly grouped in two classes of nanoparticles on the basis of the bimodal shape of the size distribution function (Bockhorn Citation1994; Wang Citation2001; Sgro et al. Citation2003; D’Anna Citation2009; Echavarria et al. Citation2009; Commodo et al. Citation2013). In addition to their sizes, these two classes of particles differentiate by chemical structure, morphology, and optical and spectroscopy behaviors. The first class of particles has a mean equivalent size approximately in the range of 2–4 nm, which remains almost constant changing the fuel equivalence ratio and the flame residence time. The second class of particles has a mean equivalent size which shifts from about 4–10 nm to 10–100 nm and more as the flame equivalence ratio and the flame residence time are increased. The larger size particles, those with sizes in the range 10–100 nm, are usually referred to as soot particles and are formed in fuel-rich flame conditions characterized by a strong yellow-red luminosity. Nascent carbon nanoparticles with equivalent diameter of about 2–4 nm are generated both in sooting conditions, where they coexist with larger primary soot particles and soot aggregates, and in less fuel-rich bluish flame conditions where they are formed alone or coexist with the larger 4–10 nm particles (Maricq Citation2004, Citation2005; Dobbins Citation2007; Commodo et al. Citation2015). Nascent particles were reported to be liquid-like or bidimensional structures which assume an atomically thin disk-like shape when deposited on a substrate (Barone et al. Citation2003; Dobbins Citation2007; Abid et al. Citation2008; Minutolo et al. Citation2014). Gas-phase precursors of freshly nucleated nanosized particles have been identified in polycyclic aromatic hydrocarbons (PAHs) (Ricther et al. 2005; D’Anna Citation2009). PAHs are subjected to molecular mass growth in the postflame region, to be later transformed into incipient organic nanoparticles through a molecule-to-cluster nucleation process, whose exact dynamic is still debated (Wang Citation2011). Once the first clusters/particles are nucleated, a series of high-temperature chemical and physical processes lead to particle mass/size growth, and chemical transformation (Howard, Citation1990).
It is widely accepted that particle coagulation is a relevant step in the process of soot particle formation, particularly when nanometer-sized particles are involved. Furthermore, it is worth noting that the physical interaction of carbon nanoparticles with solid and liquid interfaces is a key point for nanoparticle separation in filtration systems and for the understanding of nanoparticle penetration and accumulation in biological systems.
Several studies have been conducted over the years regarding the coagulation tendency of combustion-generated particles. The mechanism of collision and sticking of small particles can be viewed as due to a balance between the particle kinetic energy and the mutual interaction between the particles (van der Waals forces) (Narsimhan and Ruckenstein Citation1985); when particles are in the free molecular regime, at high temperature such as that reached in flames, the particle kinetic energy may be higher than the interaction energy, resulting in a thermal rebound effect after collision (Wang and Kasper, Citation1991). Experimental results (Minutolo et al. Citation1999; Sgro et al Citation2003; D’Alessio et al. Citation2005) agreed with this simple model showing that flame-formed nanoparticles with 2–5 nm size possess a rate of coagulation lower than that of larger soot particles (20–50 nm) and well below the value predicted by the gas-kinetic theory, thus showing that the coagulation efficiency depends on particle size, morphology, and chemical structure. Moreover, temperature has been demonstrated to play a key role in determining the rate of coagulation of different-sized nanoparticles (Sirignano and D’Anna Citation2013), also in different temperature regimes.
A deeper understanding of the role played by coagulation during soot formation processes can be achieved by studying carbon nanoparticle morphology and surface properties. Some of these properties, including particle size, aspect ratio, surface area, and functional groups have already been investigated (Koch and Friedlander Citation1990; Barone et al. Citation2003; Vander Wal and Tomasek Citation2004). However, little is known about the forces, particularly van der Waals interactions, acting between carbon nanoparticles. Also, the Hamaker constants for flame-formed nanoparticles (Minutolo et al. Citation1999; Sgro et al. Citation2003; D’Alessio et al. Citation2005), usually used in the calculation of the particle interaction potential, have been so far mainly assumed on the basis of particle chemical nature, since no direct experimental measurement can be found in the literature.
Force spectroscopy is a powerful atomic force microscopy (AFM) operation mode (Ducker et al. Citation1992; Cappella and Dietler Citation1999) for deriving information about surface properties of the sample other than surface topography (Binnig et al. Citation1986). The forces acting between the AFM tip and the surface under investigation can be recorded during approach and retract of cantilever to and from the sample, and plotted as force–distance plots. From these measurements, attractive and adhesive forces can be quantitatively evaluated. Furthermore, attractive force measurements allow the evaluation of the Hamaker constant for the investigated material, assuming that van der Waals forces are the main contribution.
In this work, size, morphology, and attractive and adhesive forces of flame-formed nanoparticles sampled from fuel-rich premixed ethylene/air flames have been derived from AFM measurements performed, respectively, in semicontact and contact modes. Two sampling procedures have been performed in order to collect single particles and bulk materials as large aggregate of particles. The sampling procedure has been accurately developed to minimize flame perturbation and artifact formation. The flame conditions have been chosen to generate a wide range of particles with different sizes, morphology, and chemical characteristics, thus allowing to follow the process of particle transformation in flame. This work represents the first attempt to overcome the lack of experimental information in the literature about the interaction forces acting between flame-formed nanoparticles, and also to furnish direct experimental measurements of the Hamaker constant for carbon nanoparticles.
2. EXPERIMENTAL
Carbon nanoparticles were produced from five different laminar premixed flames burning ethylene/air mixtures at atmospheric pressure. The selected flame conditions and sampling position are reported in . The flames were stabilized on a water-cooled McKenna burner, and the cold gas velocity was kept constant at 10 cm/s. Flame equivalence ratio, Φ, was changed in order to move from flame conditions with unimodal particle size distributions with average equivalent size of 2–4 nm (Φ = 1.85 and 1.89), to flames with a bimodal size distribution with a first particle mode at 2–4 nm and a second mode at 4–10 nm (Φ = 1.95), up to fully-sooting conditions (Φ = 2.16 and 2.58), in which 2–4 nm nanoparticles and 10–100 nm soot primary particles and aggregates are mainly produced. reports the size ranges of the first and second mode of the size distribution measured by online scanning mobility particle sizer in previous works (Echavarria et al. Citation2009; Sgro et al. Citation2011; Commodo et al. Citation2013).
TABLE 1 Experimental flame conditions
Particles were collected at a fixed height above the burner (HAB = 15 mm, corresponding to residence times ranging from 27 to 33 ms as Φ is increased from 1.85 to 2.58) by means of a thermophoretic sampling system constituted by a double-acting pneumatic cylinder equipped with a substrate holder mounted over a mobile extension. This system allowed sampling particles by thermophoretic forces because of the temperature gradient between the hot gases and the cold substrate. Residence time of the substrate in flame was optimized and kept constant at 30 ms. A single insertion of the substrate in flame was performed to collect particles for semicontact AFM morphological analysis, while multiple insertions (up to five) were performed for contact AFM force spectroscopy measurements. Freshly cleaved mica muscovite disks, with a diameter of 9 mm, were used as substrates.
AFM measurements were performed with a Scanning Probe Microscope NTEGRA Prima from NT-MDT at room temperature and 30% relative humidity.
For morphological imaging of samples, the instrument was operated in semicontact mode in air, using NANOSENSORS™ SSS-NCHR supersharp silicon probes with nominal tip radius of 2 nm, a 125-μm long cantilever with a spring force constant of 42 N/m, and a range of resonance frequency 204–497 kHz. The AFM images were obtained with a scan rate of 0.3–0.5 kHz over selected areas of 2 μm × 2 μm and 1 μm × 1 μm (1024 × 1024 pixel resolution). The calibration of the AFM scanner vertical movement was performed by means of the NT-MDT SiC/0.75 calibration sample, which has a uniform distribution of 0.75 nm height steps on its surface. All the images were not filtered.
For force–distance spectroscopy experiments, a NT-MDT CSG10/TiN contact probe was used, which has a nominal tip radius of 35 nm and a titanium nitride-coated silicon cantilever (length 225 μm, resonance frequency range 8–39 kHz, typical spring force constant 0.11 N/m). The correct value of the cantilever spring constant Kc was confirmed to be 0.11 N/m using the Sader Normal Script included in Nova Software based on the dimensional approach method developed by Sader et al. (Citation1999). The procedure to perform AFM force spectroscopy measurements involved two different steps. First, for each sample, a topographical image of the particles on the substrate was acquired in contact mode over an area of 2 μm x 2 μm in order to locate carbonaceous nanoparticles. Then, force measurements were performed on selected particles and repeated at least three times for each particle under the same conditions. More than 20 particles were selected for each flame condition in order to have statistically relevant results.
For AFM force measurements, the sample is mounted on a holder attached to the piezoelectric element of the instrument. By applying a voltage to the piezoelectric translator, the sample is moved up and down, and the resulting cantilever deflection is measured by the optical lever method (Butt et al. Citation2005). This method is based on a laser beam which is pointed onto the cantilever, and the deflection leads to a shift of the reflected beam. This shift is detected by a four-quadrant photodiode as an electrical signal called DFL, which is the difference between signals from top and bottom halves of the photodiode, and recorded as a function of the piezo displacement. The cantilever deflection δc can then be obtained dividing the DFL signal by the photodetector sensitivity, which is derived from the slope, in the hard repulsive contact region, of the curve obtained using cleaved mica as a hard material (Touhami et al. Citation2003). Knowing the cantilever spring constant Kc, the interaction force F acting between the probe and the sample can be simply obtained from the well-known Hooke's law as:[1]
The interaction force–piezo displacement curve, measured on a particle collected at Φ = 2.58, is reported in .
FIG. 1. A typical experimental force–distance curve measured by AFM. The black line refers to the approach of the cantilever to the sample surface, while the gray line refers to retraction from the sample surface.
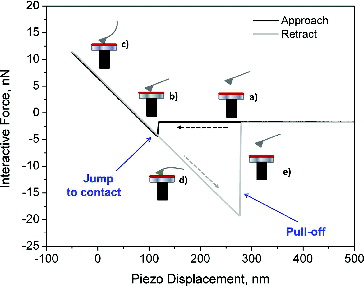
Initially, the tip is far away from the sample. When the piezoelectric translator starts moving toward the probe, there is no measurable interaction between the probe and the sample, thus the cantilever is not deflected and only the physical separation between the two bodies changes, point (a) in . As the sample approaches the tip, they experience an attractive force that results in an instability called “Jump-to-contact” and the cantilever undergoes a rapid deflection when the force gradient exceeds the spring constant, point (b) in , (Senden Citation2001). The measure of the cantilever deflection caused by the “Jump-to-contact” gives the value of the attractive force, Fatt, acting between the sample and the tip according to EquationEquation (1)[1] . Then, the translator moves further, and the deflection of the cantilever is linearly proportional to the movement of the piezo, point (c) in . Subsequently, the sample surface is retracted, point (d) in , and the adhesive forces between the two bodies hold the probe to the sample until the spring constant overcomes the force gradient (Lomboy et al. Citation2011) and the “Pull-off” instability occurs, point (e) in . The adhesive force, Fadh, can be measured from the cantilever deflection during the “Pull-off.”
3. RESULTS AND DISCUSSION
3.1. Morphology Analysis
Before measuring attractive and adhesive forces, an accurate characterization of the particle morphology and dimension has been performed running AFM in semicontact operation mode. This technique allows achieving a higher resolution along vertical and lateral axes compared with contact mode, since it avoids strong tip–sample interactions and attenuates undesirable convolution effects. For all the experimental flame conditions, particles were collected by single insertion. This procedure ensured to collect a sufficiently high number of particles for a statistical analysis, but low enough to avoid interaction between the collected particles on the substrate (Barone et al. Citation2003).
shows AFM-typical topographical images of isolated particles collected from the different flames, together with the corresponding height profiles. The vertical axis is reported as a color-map scale.
FIG. 2. AFM semicontact images of isolated particles collected from different flames (left), and corresponding height profiles along the continuous green line (right): (a) Φ = 1.85; (b) Φ = 1.89; (c) Φ = 1.95; (d) Φ = 2.16; (e) Φ = 2.58.
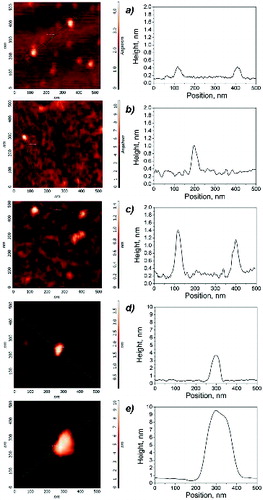
Topographic images were used to measure the maximum height Hmax and the base diameter Dbase of the particles, which were used to estimate the particle volume by assuming a cone shape for the impacted particle with a base diameter corresponding to Dbase and a height corresponding to Hmax. AFM images are measured along vertical axes with a large resolution, of the order of 0.1 nm, as compared to the lateral resolution which is limited by tip convolution effects. To improve the lateral resolution, tip artifacts have been minimized by using a supersharp tip. Nevertheless, the measured images are always a convolution of the probe geometry and the shape of the features being imaged, thus resulting in an overestimation of the sample size. This effect might be corrected if the shape of the probe and apex are known, but this procedure does not take into account the manufacturing defects and damaged probes, so that the base diameter can never be determined with a precision better than a few nanometers. We therefore considered that base diameter was overestimated by about two tip radii and subtracted this value in the evaluation of the base diameter of the measured objects. Even so, particle height is always much lower than particle base diameter showing that the shape of the particles collected on the sampling plate is not spherical. In order to obtain results that may be compared to the diameter of the particles measured in aerosol phase by scanning mobility particle sizer, the particle volume equivalent diameter was therefore calculated from the measured particle volume, under the hypothesis of a spherical shape (Minutolo et al. 2014).
Particles sampled in flames with equivalence ratios ranging from 1.85 to 1.95 have a volume-equivalent diameter in the range of 2.3–5 nm. Richer flames, namely those with Φ = 2.16 and 2.58, clearly show a bimodal size distribution function with the first mode centered at about 2.5 nm and the second particle mode which moves from 11 to 25 nm as flame richness increases. These results are consistent with the size distribution of the particles in aerosol phase measured by SMPS and reported in literature (). Such agreement confirms that the sampling procedure allows collecting the same particles which are formed in flame and that the flat shape measured by AFM is the result of particle deformation caused by their impact on the substrate during the sampling and by adhesion forces on the mica.
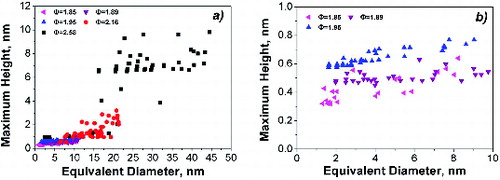
reports the measured maximum particle height Hmax as a function of the estimated particle equivalent diameter. For the larger-size particles, the height reaches values of about 0.4 times the equivalent diameter, whereas for the smaller ones, the height is of the order of 0.05–0.1 times the particle-equivalent diameter, i.e., few angstroms (). As discussed earlier, the reasons why they have an almost atomic-thick and disk-like shape may be the particle molecular structure and the deposition/sampling procedure. Indeed, these compounds are probably small, defective graphene-like sheets, which have a crumbled, three-dimensional shape in the aerosol phase due to the possibility of twisting and bending around nonaromatic bonds at the high temperatures of the flame, but they assume a plane, atomic-thick morphology when they collide and deposit on the mica support (Minutolo et al. Citation2014). It is worth noting that moving from the less rich flames (Φ = 1.85 and 1.89) where the particles typically have a height of about 0.45 nm, i.e., they are atomically thick, to the flames with Φ = 1.95, the particle height increases to 0.70 nm, thus indicating the formation of stacked molecular clusters.
FIG. 3. Distributions of particle maximum height as a function of equivalent diameter (a). Magnification of the plot (a) in the range Hmax = 0–1 nm for flames at Φ = 1.85, Φ = 1.89, and Φ = 1.95 (b).
3.2. Attractive and Adhesive Forces
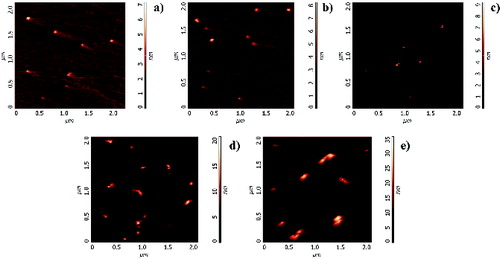
To perform force–distance spectroscopy measurements, thermophoretic sampling was carried out inserting up to five times the substrate in the flame keeping constant the residence time at 30 ms. This procedure was used to accumulate more material, in order to have a thickness of the material deposited on the substrate high enough to avoid that interaction forces between the AFM tip and the mica muscovite substrate may affect the measurement of the interaction between the AFM tip and sampled particles. Furthermore, as explained in the experimental section, force spectroscopy is a two-step procedure since a preliminary topographic imaging is needed to locate the particles on which force measurements are performed in the second step. With a multiple-insertion sampling, the accumulation of larger quantities of particles on the substrate allows a more accurate positioning of the tip on the selected portion of material for force measurements. It is worth noting that this sampling procedure induces agglomeration and aggregation of the particles on the substrate and hence it is used only for retrieving surface properties of the sampled material and not morphological and size properties. shows contact-mode AFM topographic images of particles collected from different flame conditions. The entire ensemble of particles clearly has higher base diameter and height with respect to those estimated from semicontact images.
FIG. 4. AFM contact images of particles collected from flames with different equivalence ratio: (a) Φ = 1.85; (b) Φ = 1.89; (c) Φ = 1.95; (d) Φ = 2.16; (e) Φ = 2.58.
The experimental force–distance curves measured during the approach phase on two particles collected, respectively, from flame Φ = 1.85 and flame Φ = 2.58 are reported in as representative of the two extreme experimental flame conditions. For both conditions, the “Jump-to-contact” phenomenon is observed. The values of the attractive forces between the particle and the probe-tip, as derived from the curves, are indicated by arrows.
FIG. 5. Experimental force–distance approach curves measured for a particle collected at Φ = 1.85 (dots, blue) and a particle collected at Φ = 2.58 (squares, black). Arrows indicate the values of the attractive forces.
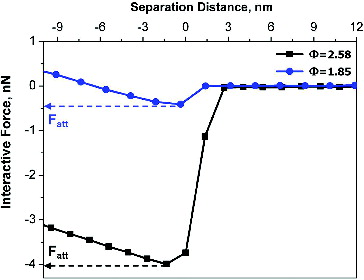
Attractive forces have also been measured by collecting different amounts of the aggregated material deposited on the mica substrates for all the experimental flame conditions by varying the total residence time of the substrate in flame. The measured attractive forces clearly show that forces are independent on the amount of the collected material, i.e., the volume of the sampled material under investigation, while they are sensitive only to particle nature.
reports the attractive forces measured for all the investigated experimental conditions as a function of the flame equivalence ratio. Attractive forces were measured also for both freshly cleaved mica disk and highly ordered pyrolytic graphite (HOPG) samples, and are reported in the same figure for comparison. Cleaved mica is the material on which the particles are deposited whereas HOPG is a high-purity graphitic structure and can be considered as a reference in the analysis of the properties of mature soot.
FIG. 6. Attractive forces between particle and probe-tip measured on various particles as a function of flame equivalence ratio. The average values measured on mica and HOPG are also reported by the lower horizontal (green) and the higher horizontal (grey) line, respectively.
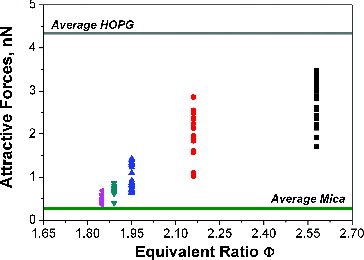
As discussed earlier, particles produced in flames with equivalence ratios, Φ, less than 2 possess a very narrow distribution of diameter well below 10 nm. In these conditions, the attractive forces measured at different points of each sample are distributed around the value of 0.5 ± 0.2 nN for Φ = 1.85, and 0.6 ± 0.2 for Φ = 1.89. These values are slightly higher than the average attractive force measured on the mica, which is of the order of 0.3 ± 0.1 nN (lower horizontal line in ). The flame with Φ = 1.95 shows a broader distribution of diameters, with a mean size of 5 nm (as derived from semicontact measurements) and the attractive force of the order of 1.0 ± 0.4 nN. Particles generated in flames with Φ = 2.16 and Φ = 2.58, which comprise both nanoparticles and soot particles, have a very broad distribution of attractive forces, 2.0 ± 0.9 nN for Φ = 2.16 and 2.6 ± 0.9 nN for Φ = 2.58. The highest measured values are, however, lower than the average value measured for HOPG, which is of the order of 4.3 ± 0.4 nN (higher horizontal line in ).
The adhesive forces measured for the investigated experimental conditions are reported in as a function of the flame equivalence ratio, together with the average measured values of adhesive force for HOPG (33 ± 3 nN) and mica (1.9 ± 0.6 nN). The distribution of Fadh shows a very similar trend to that of Fatt, with an increase of measured force as equivalence ratio of investigated flame increases. For flame conditions Φ = 1.85 and Φ = 1.89, Fadh are of the order of 4 ± 2 nN. Slightly higher values of Fadh are measured at Φ = 1.95, in the range of 5 ± 2 nN. Finally, at Φ = 2.16 and Φ = 2.58, the value of Fadh is 11 ± 3 nN and 13 ± 5 nN, respectively.
FIG. 7. Adhesive forces between particle and probe-tip measured on various particles as a function of flame equivalence ratio. The average values measured on mica and HOPG are also reported by the lower horizontal (green) and the higher horizontal (grey) line, respectively.
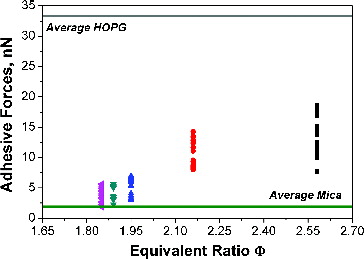
For each flame condition, the adhesive force is typically six to eight times greater than the attractive force. This occurs in all the force–distance curves acquired and is evidenced by the presence of a hysteresis as shown in . The larger Fadh is due to the formation of adhesive bonds between tip and particle surface during contact in addition to a possible deformation of the particle around the tip, which may be responsible for an increase in contact area (Burnham et al. Citation1990; Weisenhorn et al. Citation1992). In force–distance measurements, the presence of hysteresis can also be attributed to the interactions of capillary fluids covering both the tip and the sample due to ambient humidity (Hashemi et al. Citation2008). In order to exclude any interference due to capillary forces during measurements, the experiments were repeated using a flow of nitrogen in the AFM protective hood to keep relative humidity below 5%. No differences in the curves acquired in air and pure nitrogen atmosphere were noticed.
3.3. Hamaker Constant of Flame-Formed Nanoparticles
From the measurement of attractive forces between the particle and the probe-tip, the Hamaker constant of carbon nanoparticles in the different experimental flame conditions was derived. The main assumption made is that van der Waals force FvdW is the major contribution to the interaction forces acting between tip and particles during approach phase. Indeed, since the interactions are measured at small separation distances (less than 30 nm), electrostatic forces can be considered negligible (Gady et al. Citation1996). The method used to derive the Hamaker constant is based on the fitting of the curve of the attractive force measured by AFM as the cantilever approaches the surface (), at small separation distance, with the expression for the van der Waals forces between a sphere and a flat plane in the Derjaguin approximation (Hamaker Citation1937; Israelachvili Citation2011), which is given by:[2] where Rtip is the radius of the tip, D is the tip–particle separation distance, and Atip–particle is the Hamaker constant corresponding to the system tip–particle. The Hamaker constant for the sole particles, Aparticle, was obtained from the following equation (Eichenlaub et al. Citation2002):
[3] where Atip is the Hamaker constant of titanium nitride TiN, 1.57 × 10⁻¹⁹ J, (Bergstrom Citation1997).
The method was first tested by using EquationEquation (2)[2] to fit the measured approach force–distance curves of freshly cleaved mica disks and HOPG. The resulting Hamaker constant was 0.90 ± 0.03 × 10⁻¹⁹ J for mica and 4.6 ± 0.5 × 10⁻¹⁹ J for HOPG. These values are in good agreement with the Hamaker constants reported in the literature, which are of the order of 0.99 ± 0.01 × 10⁻¹⁹ J and 4.7 ± 0.3 × 10⁻¹⁹ J, respectively, for muscovite mica (Hamaker Citation1937; Hashemi et al. Citation2008) and HOPG (Lee et al. 2002; Israelachvili Citation2011).
The same procedure was applied to all the force–distance curves acquired for the investigated particles, and an average value of the Hamaker constant for each of the five experimental conditions was calculated. The results are summarized in . For comparison, the table also reports the Hamaker constant for HOPG, benzene, and aliphatic hydrocarbons as reported in the literature. Hydrocarbon combustion-generated particles of 2–4 nm are often considered to be comprised of few aromatic rings linked by aliphatic bonds, so the Hamaker constant of benzene and aliphatic hydrocarbons represents a lower limit given by the smallest building blocks of the particles. By contrast, the Hamaker constant of HOPG can be considered as an upper limit given by a perfect graphitized structure.
TABLE 2 Average Hamaker constants
Soot particles produced in very fuel-rich flames (Φ = 2.16 and Φ = 2.58) have the Hamaker constant slightly lower than that of HOPG. These particles and graphitic materials exert similar interaction forces as confirmed by the attractive force values reported in . On the other hand, carbon nanoparticles formed below the soot limit appearance, i.e., Φ = 1.85–1.95, have a value of the Hamaker constant much lower than that of the soot particles, consistently with a lower graphitization due to smaller aromatic domains and probably the lack of staked aromatic domains. Compared to the values of benzene and HOPG, the trend of the Hamaker constants, as well as of both attractive and adhesive forces, with flame-equivalent ratio, indicate a continuous increase of particle aromatic domains and three-dimensional order by increasing the flame-equivalent ratios.
4. CONCLUSIONS
The analysis of AFM topographic measurements, performed in semicontact mode, has shown that particles formed in the flames with equivalence ratios less than 2 have a monomodal size distribution with the mean particle size moving from 3.7 to 5 nm as the equivalence ratio increases. The size distribution of particles sampled in richer flames is clearly bimodal with the first mode centered at about 2.5 nm and the second one which moves from 10 to 50 nm as flame richness increases. The height of the particles deposited on a mica plate is always much lower than particle base diameter, in whichever flame condition the particles were collected, showing that the shape of the particles collected on a sampling plate is never spherical. Moreover, increasing the flame richness, particle shape moves from an almost atomically thick disk-like object, with height of about 0.40 nm, to thicker compounds which may be characteristic of stacked molecular layers. These results are in agreement with the observation of the formation of aromatic plane stacks in coagulated primary particles obtained recently by using off-line cyclic voltammetry, Raman spectroscopy, and light absorption (Commodo et al. Citation2015).
In this work, we have employed AFM force-spectroscopy technique for the first time to follow the graphitization trajectories of carbon nanoparticles in fuel-rich flames as the flame richness increases. The reported results show that this is a reliable and powerful tool to investigate soot formation.
Soot particles produced in very fuel-rich flames exhibit adhesive and attractive forces lower, but comparable, to that of highly ordered pyrolytic graphite. Whereas, carbon nanoparticles formed below the soot limit appearance have attractive and adhesive forces much lower than those of the soot particles and more similar to those characteristic of aromatic molecules. From force versus distance measurements, we have determined the Hamaker constant of the particles in each flame. The trend of the Hamaker constant with flame-equivalent ratio, compared to values of benzene and HOPG, confirms a continuous increase of particle graphitization by increasing the size of the aromatic domains and/or the three-dimensional internal ordering by increasing the flame-equivalent ratios.
REFERENCES
- Abid, A. D., Heinz, N., Tolmachoff, E. D., Phares, D. J., Campbell, C. S., and Wang, H. (2008). Combust. Flame, 154(4):775–788.
- Barone, A. C., D’Alessio, A., and D’Anna, A. (2003). Morphological Characterization of the Early Process of Soot Formation by Atomic Force Microscopy. Combust. Flame, 132(1–2):181–187.
- Bergstrom, L. (1997). Hamaker Constants of Inorganic Materials. Adv. Colloid Interface Sci., 70:125–169.
- Binnig, G., Quate, C. E., and Gerber, C. (1986). Atomic Force Microscope. Phys. Rev. Lett., 56:930–933.
- Bockhorn, H. (1994). Soot Formation in Combustion: Mechanisms and Models. Springer Verlag, Berlin.
- Burnham, N. A., Dominguez, D. D., Mowery, R. L., and Colton, R. J. (1990). Probing the Surface Forces of Monolayer Films with an Atomic-Force Microscope. Phys. Rev. Lett., 64(16):1931–1934.
- Butt, H. J., Cappella, B., and Kappl, M. (2005). Force Measurements with the Atomic Force Microscope: Technique, Interpretation and Applications. Surf. Sci. Rep., 59:1–152.
- Cappella, B., and Dietler, G. (1999). Force–Distance Curves by Atomic Force Microscopy. Surf. Sci. Rep., 34:1–104.
- Commodo, M., Sgro, L. A., Minutolo, P., and D’Anna, A. (2013). Characterization of Combustion-Generated Carbonaceous Nanoparticles by Size-Dependent Ultraviolet Laser Photoionization. J. Phys. Chem. A, 117:3980–3989.
- Commodo, M., Tessitore, G., De Falco, G., Bruno, A., Minutolo, P., and D’Anna, A. (2015). Further Details on Particle Inception and Growth in Premixed Flames. Proc. Combust. Inst., 35:1795–1802.
- D’Alessio, A., Barone, A. C., Cau, R., D’Anna, A., and Minutolo, P. (2005). Surface Deposition and Coagulation Efficiency of Combustion Generated Nanoparticles in the Size Range from 1 to 10 nm. Proc. Combust. Inst., 30:2595–2603.
- D’Anna, A. (2009). Combustion-Formed Nanoparticles. Proc. Combust. Inst., 32:593–613.
- Dobbins, R. A. (2007). Hydrocarbon Nanoparticles Formed in Flames and Diesel Engines. Aerosol Sci. Technol., 41(5):485–496.
- Ducker, W. A., Senden, T. J., and Pashley, R. M. (1992). Measurement of Forces in Liquids Using a Force Microscopy. Langmuir, 8:1831–1836.
- Echavarria, C. A., Sarofim, A. F., Lighty, J. S., and D’Anna, A. (2009). Evolution of Soot Size Distribution in Premixed Ethylene/Air and Ethylene/Benzene/Air Flames: Experimental and Modeling Study. Proc. Combust. Inst., 32:705–711.
- Eichenlaub, S., Chan, C., and Beaudoin, S. P. (2002). Hamaker Constants in Integrated Circuit Metallization. J. Colloid Interface Sci., 248:389–397.
- Gady, B., Schleef, D., Reifenberger, R., Rimai, D., and DeMejo, L. P. (1996). Identification of Electrostatic and van der Waals Interaction Forces Between a Micrometer-Size Sphere and a Flat Substrate. Phys. Rev. B., 53(12):8065–8070.
- Hamaker, H. C. (1937). The London–van der Waals Attraction Between Spherical Particles. Physica, 4(10):1058–1072.
- Hashemi, N., Paul, M. R., Dankowicz, H., Lee, M., and Jhe, W. (2008). The Dissipated Power in Atomic Force Microscopy Due to Interactions with a Capillary Fluid Layer. J. Appl. Phys., 104:063518, 5 pp.
- Howard, J. B. (1990). Carbon Addition and Oxidation Reactions in Heterogeneous Combustion and Soot Formation. Proc. Combust. Inst., 23:1107–1127.
- Israelachvili, J. N. (2011). Intermolecular and Surface Forces, 3rd ed. Academic Press, London.
- Jander, H., and Wagner, H. Gg. (Eds.). (1990). Soot Formation in Combustion: An International Round Table Discussion. Vandenhoeck and Ruprecht, Gottingen.
- Koch, W., and Friedlander, S. (1990). The Effect of Particle Coalescence on the Surface Area of a Coagulating Aerosol. J. Colloid Interface Sci., 140(2):419–427.
- Lee, S. I., Howell, S. W., Raman, A., and Reifenberger, R. (2002). Nonlinear Dynamics of Microcantilevers in Tapping Mode Atomic Force Microscopy: A Comparison Between Theory and Experiment. Phys. Rev. B, 66:115409, 10 pp.
- Lomboy, G., Sundararajan, S., Wang, K., and Subramaniam, S. (2001). A Test Method for Determining Adhesion Forces and Hamaker Constants of Cementitious Materials Using Atomic Force Microscopy. Cem. Concr. Res., 41:1157–1166.
- Maricq, M. M. (2004). Size and Charge of Soot Particles in Rich Premixed Ethylene Flames. Combust. Flame, 137:340–350.
- Maricq, M. M. (2005). The Dynamics of Electrically Charged Soot Particles in a Premixed Ethylene Flame. Combust. Flame, 141:406–416.
- Minutolo, P., Commodo, M., Santamaria, A., De Falco, G., and D’Anna, A. (2014). Characterization of Flame-Generated 2-D Carbon Nano-Disks. Carbon, 68:138–148.
- Minutolo, P., Gambi, G., D’Alessio, A., and Carlucci, S. (1999). Spectroscopic Characterization of Carbonaceous Nanoparticles in Premixed Flames. Atmos. Environ., 33:2725–2732.
- Narsimhan, G., and Ruckenstein, E. (1985). The Brownian Coagulation of Aerosols over the Entire Range of Knudsen Numbers: Connection Between the Sticking Probability and the Interaction Forces. J. Colloid Interface Sci., 104(2):344–369.
- Richter, H., Granata, S., Green, W. H., and Howard, J. B. (2005). Detailed Modeling of PAH and Soot Formation in a Laminar Premixed Benzene/Oxygen/Argon Low-Pressure Flame. Proc. Combust. Inst., 30:1397–1405.
- Sader, J. E., Chon, J. W. M., and Mulvaney, P. (1999) Calibration of Rectangular Atomic Force Microscope Cantilevers. Rev. Sci. Instrum., 70:3967–3969.
- Senden, T. J. (2001). Force Microscopy and Surface Interactions. Curr. Opin. Colloid Interface Sci., 6:95–101.
- Sirignano, M., and D’Anna, A. (2013). Coagulation of Combustion Generated Nanoparticles in Low and Intermediate Temperature Regimes: An Experimental Study. Proc. Combust. Inst., 34:1877–1884.
- Sgro, L. A., Basile, G., Barone, A. C., D’Anna, A., Minutolo, P., Borghese, A., and D’Alessio, A. (2003). Detection of Combustion Formed Nanoparticles. Chemosphere, 51:1079–1090.
- Sgro, L. A., D’Anna, A., and Minutolo, P. (2011). Charge Fraction Distribution of Nucleation Mode Particles: New Insight on the Particle Formation Mechanism. Combust. Flame, 158(7):1418–1425.
- Touhami, A., Nysten, B., and Dufre, Y. F. (2003). Nanoscale Mapping of the Elasticity of Microbial Cells by Atomic Force Microscopy. Langmuir, 19:4539–4543.
- Vander Wal, R. L., and Tomasek, A. J. (2004). Soot Nanostructure: Dependence upon Synthesis Conditions. Combust. Flame 136(1–2):129–140.
- Wang, H. (2011). Formation of Nascent Soot and other Condensed-Phase Materials in Flames. Proc. Combust. Inst., 33:41–67.
- Wang, H. C., and Kasper, G. (1991). Filtration Efficiency of Nanometer-Size Aerosol Particles. J. Aerosol Sci., 22:31–41.
- Weisenhorn, A., Maivald, P., Butt, H. J., and Hansma, P. (1992) Measuring Adhesion, Attraction, and Repulsion Between Surfaces in Liquids with an Atomic-Force Microscope. Phys. Rev. B, 45(19):11226–11232.