
Abstract
A series of smoke experiments were carried out in the Microgravity Science Glovebox on the International Space Station (ISS) Facility to assess the impact of low-gravity conditions on the properties of the smoke aerosol. The smokes were generated by heating five different materials commonly used in space vehicles. This study focuses on the effects of flow and heating temperature for low-gravity conditions on the pyrolysis rate, the smoke plume structure, the smoke yield, the average particle size, and particle structure. Low-gravity conditions allowed a unique opportunity to study the smoke plume for zero external flow without the complication of buoyancy. The diameter of average mass increased on average by a factor of 1.9 and the morphology of the smoke changed from agglomerate with flow to spherical at no flow for one material. The no flow case is an important scenario in spacecraft where smoke could be generated by the overheating of electronic components in confined spaces. From electron microcopy of samples returned to earth, it was found that the smoke can form an agglomerate shape as well as a spherical shape, which had previously been the assumed shape. A possible explanation for the shape of the smoke generated by each material is presented.
Copyright 2015 American Association for Aerosol Research
1. INTRODUCTION
This study focuses on the properties of smoke generated under low-gravity conditions by heating without a flame present. Throughout this article, the term “low-gravity” will be used to refer to any conditions lower than 0.0098 m/s2 or one thousandth of terrestrial gravity levels, “normal gravity” will be used to refer to terrestrial gravity levels or approximately 9.8 m/s2. With the absence of gravity, the buoyancy induced flow characteristic of smoke plumes at normal gravity is not present. The formation of smoke particles from the vapor released by a heated material is affected by the flow as the vapor leaves the material, cools, forms nuclei, which grow via condensation and coagulation to form a smoke aerosol. For the case of no external flow, the heat and mass transport would be controlled by conduction, diffusion, and thermal expansion at low gravity, while in normal gravity, convective heat and mass transport from buoyancy would play a major role in the growth of the smoke aerosol. The slower mixing at low-gravity is expected to result in larger particles being produced with less loss to the walls because of no gravitational settling.
A series of smoke experiments were carried out in the Microgravity Science Glovebox on the International Space Station (ISS) Facility to assess the impact of low-gravity conditions on properties of the smoke aerosol produced. The information obtained in this study is being used by NASA in designing improved smoke detectors for low-gravity applications (Urban et al. Citation2005, Citation2008). In this article, we primarily focus on the effects of flow and temperature on the pyrolysis rate, the smoke plume characteristics, the smoke yield, the particle size, and particle structure at low-gravity conditions. A companion article (Meyer et al. Citation2015) focuses on the overall measurement system termed Smoke Aerosol Measurement Experiment (SAME), the moment method for characterizing the size distribution, and TEM analysis for characterizing the size distribution of the smokes generated at low-gravity and normal gravity. Differential mobility measurements were also used for characterizing the size distributions of the smokes at normal gravity.
2. EXPERIMENTAL METHOD
2.1. Instrumentation
The key aerosol-related measurements in this article are the number concentration and the mass concentration. The number concentration is measured with a condensation nuclei counter P-TrakFootnote
(TSI Inc.). The P-Trak was calibrated with a primary standard condensation particle counter at NIST (Fletcher et al. Citation2008). The mass concentration measurement is based on light scattering (DustTrak, TSI Inc.) by the smoke aerosol. The device uses a 90º light scattering signal to quantify the aerosol mass concentration. The DustTrak is calibrated on ground-based measurements using a tapered element oscillating microbalance (TEOM). Some dilution is required for both of these instruments. The diameter of average mass dm is determined from the mass and number concentrations (M, N) together with the particle density ρ (Hinds Citation1999)(1)
More details about the instrument design and calibration are given in Meyer et al. (Citation2015). Additional information on specific modification for flight use is given by Urban et al. (Citation2008).
A schematic of the assembled hardware appears in . The system was installed in the Microgravity Science Glovebox (MSG), an International Space Station Facility. Smoke was generated by heating a small sample of material in the smoke generation duct for 60 s. During this interval, controlled flow was induced by a moving piston, which drew the smoke into a six-liter cylinder. A fan in the base of the cylinder mixed the smoke for a fixed time and then the smoke was moved by the piston into the diagnostics duct where the instruments made their measurements. As the smoke was monitored by the instruments, samples of the smoke particles were deposited on a transmission electron microscope (TEM) grid mounted inside a seven-port Thermal Precipitator. After the mission, the grids were removed from the assembly and examined in a TEM to obtain an independent determination of the particle size and morphology.
FIG. 1. Schematic of the smoke generation, collection, and measurement system. The piston is within a six-liter cylinder.
2.2. Materials Studied and Heating System
The five materials studied are widely used in spacecraft applications. These are lamp wick, a cotton (cellulosic) material with a bulk density of about 0.3 g/cm3; KaptonTM, a polyimide used as an insulating film; TeflonTM, polytetraflu-oroethylene used as wire insulation; silicone rubber; and PyrellTM, a fire-retardant modified polyester polyurethane foam with a bulk density of about 0.03 g/cm.
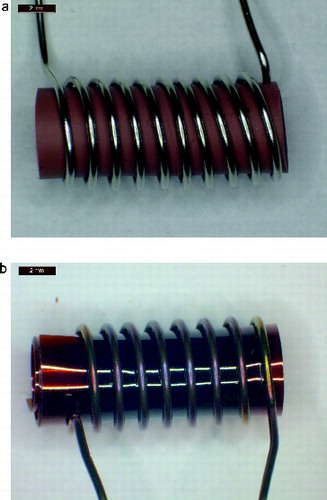
The smokes were generated from cylindrically shaped samples about 5 mm in diameter and 11 mm long. The samples were heated with 0.5 mm diameter stainless steel safety wire wrapped around the sample about nine times as shown in for silicone rubber and Kapton. The Kapton sample was cut from a 0.13 mm thick sheet of Kapton and formed into a hollow cylinder with three layers of Kapton at the outer surface. The sample masses for Teflon and silicone rubber were 0.43 g, for the lower density lamp wick and Pyrell were 0.10 g and 0.026 g, respectively, and for the three layers of Kapton was 0.12 g. The sample to sample mass variability was less than 5% except for the humidity sensitive lamp wick with a variability of less than 10%. The heating temperature of the sample was increased until signals from analog light scattering and ionization detector were above the background level. This generally corresponded to the onset of visible smoke being produced by the sample. This was used as a baseline setting. Measurements were also carried out with slightly higher and lower temperatures (about a 30°C temperature range). As discussed later, the pyrolysis rate is sensitive to the wire temperature. An increase of about 30°C often resulted in a factor of 2 increase in the pyrolysis rate. For lamp wick and Pyrell, the range of temperature increase was limited by the onset of flaming combustion. The percent of mass loss over the 60 s heating was 5% or less.
FIG. 2. Photograph of heating wire with silicone rubber (upper) and Kapton samples after heating. The samples are about 11 mm long with a 5 mm diameter.
Significant features of the heater was its ability to provide a rapid heating time of about 3 s to reach a steady state and then to maintain a constant temperature over a 60 s interval. This was done by applying a fixed voltage at a frequency of a few thousand Hertz. After powering the heater for an adjustable time of about 100 ms, the power was turned off and the resistance of the wire was measured. The control circuitry adjusted the next power-on period to achieve the desired resistance. A constant resistance was maintained over the 60 s heating period by adjusting the duty cycle of the pulsating power. The temperature was obtained from the resistance measurement based on calibration data for resistance versus temperature. The relative temperature uncertainty, ΔT/T, is about ± 0.007 for temperatures in the range 230°C to 550°C. In the previous glove box experiments in low-gravity (Urban et al. Citation1997), the heater temperature was not controlled. Instead, there was a constant heating rate based on a fixed voltage. The pyrolysis rate likely changed between normal gravity and low-gravity conditions and from low flow to high flow conditions. In the current study, the temperature is fixed for both flow and no-flow conditions and for normal gravity and low-gravity conditions, and the pyrolysis rate is measured. This is important for assessing whether the change in the smoke properties is a result of the difference in the flow/gravity conditions or whether it is a result of a change in the pyrolysis rate. Ideally, one would like the pyrolysis rate to be constant as one varies the other conditions.
3. RESULTS AND DISCUSSION
3.1. Pyrolysis
Each material responds differently to heating. The Teflon melts and forms an expanded gel, while silicone rubber swells and becomes brittle. Lamp wick and Pyrell undergo charring as a result of oxidation. Kapton darkens and bubbles in a nonuniform manner. For each material, the total mass loss, mL, was determined from microbalance measurements on earth before and after the experiment. The relative standard measurement uncertainty, ur(mL), ranged from 0.018 for Teflon to 0.072 for Pyrell as shown in , which contains the uncertainties for all the mass and particle-size-related uncertainties. The online supplemental information (SI) contains a detailed uncertainty analysis.
TABLE 1 Uncertainty for measured smoke properties mL, Mc, Y, ρ, and dm
As indicated in , Teflon, Lamp wick, and silicone rubber experienced large increases in mass loss by factors of 3–10 as the temperature increased by about 30°C. For Teflon and Kapton, there is a large variability in the data. For these samples, the heating temperature is 100–300°C higher than the other samples. It may be that the melting of the Teflon and the bubbling observed for the Kapton are responsible for these effects. Measurements were carried out with a convective flow of 8 cm/s and under a no flow condition. shows that the mass losses are independent of air flow for fixed temperature within the range of the measurement uncertainty. That is, the solid symbols and the open symbols in mostly overlap. The overlap range is within about 25% for Pyrell, lamp wick, and silicone rubber except one outlier for silicone rubber. For Teflon and Kapton, the large variability up to a factor of 5 for nearly identical measurements limits the confidence in the statement about the independence of pyrolysis to flow. The normal gravity mass loss data for Kapton and Teflon exceed the low-gravity results for most of the data points. This is likely in part a result of the large variability in the Teflon and Kapton data.
FIG. 3. Mass loss vs. wire temperature: low-gravity, flow—open symbols; low-gravity, no flow—black symbols; normal gravity, flow—gray symbols. Pyrell—diamond, lamp wick—square, silicone rubber—triangle, Kapton— inverted triangle, Teflon—circle.
While there is a substantial change in the polymer appearance resulting from the heating, the mass loss is small corresponding to less than 5% of the mass for all of the samples. This indicates the very early stage of pyrolysis. The minimum temperatures for our samples are within 35°C of the onset temperature for mass loss obtained by thermogravimetric analysis (TGA) with the exception of Kapton (Abbott and Berger Citation2013). The scan rate for the TGA was 20°C/min. In our case, the wire temperature was constant over almost all of the 60 s heating intervals. The mass loss measured during TGA measurements is controlled by chemical kinetics. The closeness of our minimum sample temperatures and the onset temperature of mass loss via TGA indicates that the mass loss rate for our heated samples is also likely controlled by chemical kinetics. The constancy of the pyrolysis rate as measured by mass loss for a fixed temperature allows us to study the effects of flow on the formation and growth of the smoke without the complication of a varying pyrolysis rate.
3.2. Smoke Generation
The pyrolysis of these polymers have been shown to result in a wide range of condensable species including polymer chains down to the size of the monomer from which the polymer was synthesized and a wide range of molecular structures resulting from the breaking of bonds in the polymer (lamp wick—Schwenker and Pacsu 1956, Ohlemiller et al. Citation1985; Schauer et al. Citation2001; Teflon—Seidel et al. Citation1991; silicone rubber—Buch et al. Citation1998; Caminoa et al. Citation2001; Kumagai and Yoshimura 2001; Kapton—Hatori et al. Citation1996; Pyrell—Ingham and Rapp Citation1964, Woolley Citation1972). For perhaps the most widely studied of these materials, lamp wick (cellulose), more than 150 products have been identified (Schauer et al. Citation2001). The condensable gases are collected by a combination of cooling and filtration.
The condensable gases with a low-enough saturation vapor pressure homogeneously nucleate into molecular clusters as the gas cools and also condense on the growing clusters to form a smoke aerosol. The condensation onto the growing particles occurs within a few seconds as the smoke flows down the tube. Additional growth occurs as a result of coagulation as the particles undergoing Brownian motion collide and stick together. As shown in TEM (transmission electron microscopy) images in and 5 (Meyer et al. 2015), the smokes from Teflon and Pyrell are made up of low-density clusters of 20–50 nm spherules. Lamp wick and Kapton are primarily spherical droplet type particles, but there is a small fraction of doublets. These results indicate that the smoke particles formed by pyrolysis can be solid-like. Previously, Mulholland (Citation1995) described the smoke particles by non-flaming pyrolysis as droplets. Our current study indicates that the particles can form fractal type clusters and doublets as well as droplets. A possible explanation for these two morphologies is presented in Section 3.4.
FIG. 4. TEM images of smoke particles generated by Teflon, Pyrell, lamp wick, and Kapton. The reference length scale is 2 μm in length.
The total mass of the aerosol is computed as the product of the volume of the aging chamber, about 6 × 10⁻³ m3, and the mass concentration of the smoke, which ranged from 2 mg/m3 to 350 mg/m3. By dividing the total mass of the aerosol by the mass loss of the sample, the smoke yield is determined. As indicated in , the smoke yields range from about 0.01 to a value of about 2.0. The standard relative uncertainty in the yield, urc(Yavg), ranges from about 0.27 for Pyrell to about 0.13 (). As shown in the SI, the major source of the uncertainty in the yield is the calibration of the DustTrak. The calibration factors of the DustTrak, defined as the mass measured by the TEOM to the mass indicated by the DustTrak, are 0.45 for Kapton, 0.28 for lamp wick. 0.48 for Pyrell, 0.55 for silicone rubber, and 2.26 for Teflon.
FIG. 5. TEM images of the residue of the smoke particles generated by silicone rubber. The reference length scale at bottom of the image is 2 μm in length.
FIG. 6. Smoke yield versus wire temperature: low-gravity, flow—open symbols; normal gravity, flow (8 cm/s)—solid symbols. Same symbol identification as .
For lamp wick, the yield can be compared with previous measurements. The average of the results for lamp wick (cellulose) is 0.16 compared to a value of about 0.15 for cellulose in a cocurrent smolder reactor (Mulholland and Ohlemiller Citation1982). The yield factor is a key parameter in the characterization of smoke. It can be used in estimating the response time of a smoke detector or the visibility range resulting from the generation of pyrolysis smoke (Mulholland Citation1995).
If the fraction of the condensable vapor were independent of sample temperature, then one would obtain a constant yield. Qualitatively, this seems to be the case for our sample materials as seen in , though for Kapton and Teflon there is a large variability in the results. also contains results obtained for normal gravity conditions. For the four materials studied, the results for normal gravity and low-gravity are close for the smoke yield. This result together with near equality of the mass losses shows that the amount of condensable vapor is qualitatively the same for both normal gravity and low-gravity conditions.
A yield approaching 1 is expected for Pyrell, since polyurethane regenerates the monomers when it decomposes at low temperatures as explained in Section 3.4. However, the yield values for Pyrell are unphysically large and exceed a value of 1. The average of 10 measured yields for Pyrell is 1.41, which exceeds the maximum value of 1 by a factor of 1.5 times the uncertainty in the smoke yield measurement. The cause of the large bias is not known though the uncertainty in yield for Pyrell is significantly larger than for the other materials.
3.3. Effect of Flow on the Growth and Structure of Smoke
A series of tests were carried out with no external flow. For no flow at low-gravity conditions, the transport of heat and vapor are controlled by conduction/diffusion and thermal expansion. Under normal gravity conditions, convection plays a major role in the transport of vapor, heat, and smoke aerosol with or without external flow because of buoyancy.
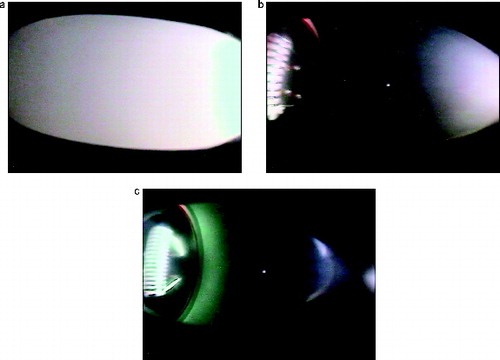
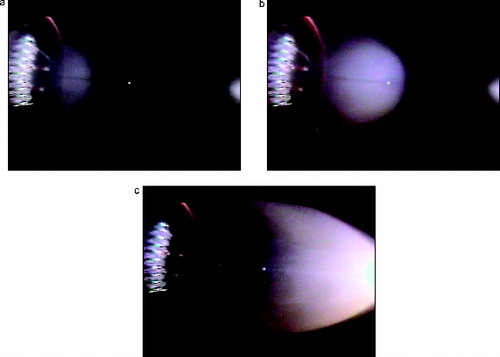
The hardware design included the capability of visualizing the smoke plume, which is recorded on approximately 70 s of video for each sample. A camera with a wide viewing angle of 120° was used to image the smoke beginning with the heated sample as shown in . The viewing area extended about 6.3 cm from the sample downstream toward the piston/cylinder. For most photos, a thermistor is visible near the center of the field of view as a white dot. The LED light source is directed toward the sample from a bend in the tubing on the downstream side of the sample. shows single frames of smoke plumes from three different materials as the samples are heated. These images are from tests with no air flow over the sample. In the left image, which is silicone rubber, one can see the bullet-shaped illumination area resulting from light scattered by the smoke from the heated sample.
FIG. 7. The smoke plume from silicone rubber, lamp wick, and Teflon for no flow. The horizontal field of view is about 6 cm. The white bullet shape and white “bat-wings” (Teflon) are light scattered by the smoke. The illumination near the wire for Teflon is likely from the reflection of high-temperature IR radiation from the wall of the aluminum tube. The white dot near the center is a thermistor located in the center of the tube. Flow is from left to right.
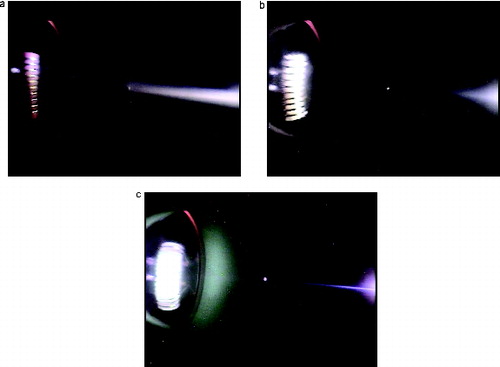
In contrast to the broad plume for the no-flow images of , narrow plumes are generated for the case 8 cm/s flow as shown in . Under this condition, the visible smoke appears about 4 cm downstream of the sample for lamp wick (center image). The smoke particles grow via homogeneous nucleation of the vapor followed by condensation over the 0.5 s time interval to a large-enough size to produce visible scattered light. For silicone rubber (left imager of ) with a much higher vapor concentration than lamp wick, a faintly visible plume appears just downstream of the source and the plume brightens downstream as a result of continued condensation. Shortly after the heater was turned on for the silicone rubber sample, the video shows that a visible smoke plume does not appear until after the thermistor. This is likely a result of a lower vapor concentration, which would increase the time for the particles to grow large enough to be visible. For Teflon, the plume starts out much narrower as indicated in (the right image) and later, not shown here, a more intense plume extending back to the source forms. For another Teflon test run at a lower wire temperature, not shown here, visible smoke appeared for only a few seconds. A similar behavior was observed for Kapton. For both of these cases, smoke particles were readily detected by the P-Trak and DustTrak even though the particles produced little scattered light. For these two materials, the wire temperatures were about 200°C higher than for the other three materials and the test repeatability was poor as shown in and .
FIG. 8. Smoke plumes from silicone rubber, lamp wick, and Teflon at a flow of 8 cm/s. The samples each have a length of about 11 mm and a diameter of about 5 mm.
The visible smoke is spread over a much broader region for the no-flow plumes as seen in . The brighter scattered light toward the right for silicone rubber is caused by the light beam being more intense near the light source. The dark zone on the left-hand side of the photo for lamp wick (center image) taken 30 s after the wire was heated may also be a result of reduced vapor generation with time. For Teflon, an intriguing “bat-wings” structure appears near the midpoint around 6 s after the heater is on and it moves to the right edge of the field of view at 10 s. This “bat-wing” structure is also seen in images of Kapton smoke (not shown). shows the transient development of the plume for a Pyrell sample as the leading edge moves downstream over a period of about 30 s. Again, a dark zone appears near the source as the plume reaches the right side, and this is likely a result of reduced vapor generation late in the test.
FIG. 9. Photographs of the Pyrell smoke plume expanding to the right at 7 s, 16 s, and 33 s after heater is turned on.
The time dependence of reduced temperature for the thermistor located 3 cm downstream of the sample is shown in . The no-flow time response, time for the reduced temperature to reach 0.9, is 11–16 s, while for the one case with flow, Kapton B, the time to reach steady state is about 6 s. The reduced temperature difference is the thermistor temperature difference from the initial value reduced by the steady state temperature minus the initial temperature. The steady state temperatures were much less than the wire temperature with values for no flow of about 90°C vs 500°C for Teflon and Kapton, about 50°C vs 290°C for lamp wick, and about 40°C vs 240°C and 390°C for Pyrell and silicone rubber. This large difference is a result of the heat transport to the sample carousel and flow tube, both of which are of aluminum. These temperature measurements are important for ongoing simulation of the mass and heat transport for the flow and no-flow case.
FIG. 10. Approach to steady state temperature for six no-flow measurements and one with a flow of 8 cm/s. The quantity Tred is the normalized temperature difference, (T – Ti)/(Tss – Ti).
A major difference in the aerosol for the no-flow case is the increased particle size shown in . The diameter of average mass is a factor of 1.9 larger for the zero flow compared to the standard flow conditions. The relative standard uncertainty in dm, ur(dm), which is computed in the online SI, is equal to about 0.07 for lamp wick and silicone rubber and about 0.12 for the other materials. The value of 1.9 is an average for all the materials which include values of 2.0, 1.7, 1.9, 2.8, and 1.3 for Pyrell, lamp wick, silicone rubber, Kapton, and Teflon. Without external flow, the vapor concentration will likely be larger and the aerosol number concentration higher leading to an increased aerosol size resulting from enhanced condensation and coagulation growth.
FIG. 11. The diameter of average mass versus temperature: low-gravity, flow—open symbols; low-gravity, no flow—solid symbols. Same symbol identification as .
A unique feature of the Pyrell smoke is the change in particle morphology from partially fused clusters with as many as 30 primary spheres for the flow case to individual spheres or doublets for the no-flow case as shown in the TEM images in . At a flow of 8 cm/s, the residence time of the smoke at a high temperature is less than a second, while at zero flow with transport controlled by thermal expansion, diffusion, and thermophoresis, the time is likely on the order of 10–20 s. This longer time and higher temperature would allow for more coalescence. This change in shape likely results from the low melting point of the diisocyanate pyrolysis product from Pyrell as discussed in the next section. The prolonged heating time at low gravity under no-flow conditions may affect the morphology of smokes produced from other materials as well.
FIG. 12. TEM images of Pyrell smoke for flow (left image) and no-flow (right image). Black scale bar in the bottom of each images is 5 μm in length.
It is important to recognize that these no-flow effects are unique to low-gravity scenarios. If one performed the same experiment at normal gravity, the buoyancy of the rising gases would greatly increase the mixing zone. The larger particle diameters observed in these no-flow conditions are important to consider in the development of improved fire detection equipment for space vehicles such as the exploratory vehicles with electronics cooled by conduction rather than a forced flow of air.
3.4. Chemical Basis for Smoke Particle Morphology
A question of interest is why some smokes are made up of clusters and others are made up of spheres. One explanation is that if the colliding particles are solid or amorphous with a long coalescence time, then it is likely that an agglomerate will form, while if the colliding particles are liquid they will retain a spherical shape as a result of coalescence of colliding droplets. The agglomerates from Teflon are likely a result of the formation of Teflon polymer fragments from the pyrolysis of Teflon. Seidel et al. (Citation1991) found that nominal 104 Dalton Teflon polymer fragments are formed from the pyrolysis of Teflon over the same temperature range as our experiments with Teflon. These fragments apparently grow through nucleation/condensation/coagulation to form nominal 30 nm solid-like spherules. These spherules then collide and agglomerate leading to the clusters shown in the TEM image. This agglomeration process is commonly observed for other solid particles including soot, flame-generated ceramic particles, and vaporized metals such as silver.
There appears to be a different reason for the agglomerate structure for the Pyrell (polyurethane-polyester) agglomerates. Ingham and Rapp (Citation1964) studied the decomposition of a toluene diisocyanate-poly-(propylene glycol) (TDI:PPG) polyurethane and found that low-temperature degradation (∼200°C) led to substantial regeneration of PPG and TDI. They found that 50% of the recovered product had the same infrared spectrum as TDI and that the remaining product with a melting range of 55–60°C was similar to TDI. Woolley (Citation1972) showed in a flowing pyrolysis system (in which volatile products are removed from the hot zone) that there was a yellow solid with needle-like crystals and a rapid and complete loss of the TDI unit in the heating range 200–300°C, which overlaps with our temperature range of 220–250°C. The melting point of TDI is near room temperature and it is likely that particles made up of TDI would form clusters, perhaps with some coalescence. Pyrell is a proprietary product and the particular diisocyanate used in making Pyrell is not known, but the widely used TDI in the formulation of polyurethane (Encyclopedia of Polymer Sci. Citation1969; Ullman's Encyclopedia of Industrial Chemistry Citation1992) is a likely component. So, it is also likely that the formation of solid particles by the condensation of diisocyanates is responsible for the agglomerate structures for Pyrell as these particles collide downstream of the heated polymer.
The TEM image of the silicone rubber smoke in shows only the nonvolatile residue of the smoke. The major component of silicone rubber is silicone, a polymer containing Si, O, C, and H. The pyrolysis of large molecular weight silicone (Buch et al. Citation1997) results in the volatilization of molecular species native to the polymer and to short-chain cyclic structures (D3, D4, D5, etc.) as well as longer cyclic structures via siloxane rearrangement (Caminoa et al. Citation2001). A study by Kumagai and Yoshimura (Citation2001) of a high-temperature vulcanizing silicone rubber (HTV-SIR) also found cyclic structures D3 to D6 using thermogravimetric/differential thermal analysis/mass spectroscopy (TG-DTA-MS) in air starting at a temperature range of 350–400°C. This is the same temperature range over which the smoke was generated in the smoke experiments with silicone rubber. It is likely for our silicone rubber sample that the smoke consists of a mixture of cyclic compounds along with the native polymer. The small cyclic structures are liquid at room temperature. The aerosol is likely in spherical form with the polymer dissolved in liquid cyclic material. The diameter of average mass of the aerosol is in the range of 0.4–1.0 μm compared to residue diameters in the range 0.05–0.25 μm. The liquid consistency of the aerosol is apparent when collecting the aerosol above the heated sample on a metal substrate. The small nonspherical shaped smoke particles observed by TEM () are likely the result of the evaporation of the cyclic siloxanes at vacuum conditions in the TEM leaving the higher molecular weight silicone polymer.
The smoke particles generated from lamp wick shown in are primarily spherical. The estimated fraction of levoglucosan in the smoke aerosol from the pyrolysis of cellulose/wood is on the order of 25% or larger based on the study by Schwenker and Pacsu (1957) for cotton cellulose heated in an oven, by Ohlemiller et al. (Citation1985) for white pine heated by a radiant source with 45 condensable species collected, and by Schauer et al. (Citation2001) for three types of wood burning in a residential fire place with more than 150 species identified. There are many other pyrolysis studies of cellulose; however, they are primarily with nitrogen rather than air. Levoglucosan is a solid material at room temperature with a melting point of 182°C. Such a material would likely form a nonspherical or agglomerate shape as the growing particles collide and stick together without coalescing into a sphere. However, the levoglucosan is likely dissolved in water. Mochida and Kawamura (Citation2004) showed that levoglucosan absorbs water even at low humidity with a 5% increase in diameter of 100 nm dry particles at a humidity of 50% and an 18% increase at an 80% humidity. The greater than 10% by mass yield of water from the cellulose pyrolysis (Scheirs et al. Citation2001; Swenker and Pacsu 1956) together with the 50% nominal humidity in the inlet air and the small aldehydes, hydroxyl aldehydes, and acids (Schauer et al. Citation2001; Ohlemiller et al. Citation1985) likely lead to the solid levoglucosan dissolving in the condensing liquid. We hypothesize that the water and volatile compounds evaporate in the air and in the TEM in such a way that the residue levoglucosan has a spherical shape. The spherical lamp wick smoke particles may be related to the “tar balls” observed in biomass burning (China et al. Citation2013).
Pyrolysis of Kapton also results in spherical particles as seen in . The volatile products obtained by TGA of Kapton film were analyzed by GC-MS by Hatori et al. (Citation1996) over a temperature range of 400°C to more than 800°C, which includes the temperature range of our experiments. These included the aromatic molecules phenol, aniline, benzol nitrile, and phthalimide found in mole percentages of 6.1, 3.8, 2.4, and 1.1. The first three molecules are liquids at room temperature while the fourth has a melting point of 233°C. The vapor pressures near room temperature vary from 5 × 10⁻⁴ Pa for phthalimide to 133 Pa for aniline. It is likely that the Kapton smoke is made up of a mixture of these aromatics and others (less than 14% of the vapor accounted for). The more volatile species will undergo evaporation as the aerosol is transported through the system and then under the high vacuum of the TEM. The spherical shape of the particles observed with the TEM is consistent with the particles starting as a liquid solution with many components.
4. CONCLUSION
The pyrolysis rate was measured for five materials with minimum onset temperatures ranging from 220°C for Pyrell to 520°C for Teflon. We find that the pyrolysis rate is controlled by chemical kinetics and is independent of the flow and acceleration of gravity for fixed temperature for Pyrell, lamp wick, and silicone rubble. The large variability in the data precludes a definite statement regarding Teflon and Kapton. In the previous glove box experiments in low-gravity (Urban et al. Citation1997), the heater temperature was not controlled so that the pyrolysis rate likely changed between normal gravity and low-gravity conditions and from low-flow to high-flow conditions.
The smoke yield for each fuel was found to be independent of temperature, the flow rate, and of gravity in this study. The yields varied from near 100% for Pyrell and 75% for silicone rubber, to about 15% for lamp wick, and about 5% for Kapton and Teflon. This constancy of yield could be important in modeling smoke detector response in low-gravity conditions.
Both visual observations and particle size measurements show that at low-gravity the smoke growth is sensitive to the flow. Convective flow results in a narrow plume while a no-flow condition results in a broad plume filling the tube. The values of dm are larger for no flow ranging from 0.29 μm to 0.96 μm versus 0.14–0.51 μm for flow for the five materials (). It is likely that a higher vapor concentration at no flow is responsible for the factor of 1.9 larger dm on average for all the materials. Numerical simulations are in progress to determine the vapor distribution as a function of flow for a fixed pyrolysis rate.
The change in particle diameter is significant and could be important with regard to the selection of the optimal smoke detector for space flight. For no flow, there is also a smoke detection entry issue because of the lack of particle transport to the smoke detector. At normal gravity, there would be a buoyant plume from the heated object in an enclosure that would enable early smoke detection even without an external flow.
Our study shows that pyrolysis of Teflon and Pyrell result in agglomerate particles, silicone rubber in small residue particles, and lamp wick and Kapton in spherical particles/droplets. These results indicate that nonflaming pyrolysis smoke particles can be solid-like, while it was previously thought such smokes would be in droplet form (Mulholland Citation1995). A hypothesis for explaining the morphology of the smoke particle is given based on the nature of the pyrolysis products—liquid, solid, or polymeric. One complicating factor is the solubility of an otherwise solid particle in a liquid, such as levoglucosan in water for lamp wick smoke, resulting in a spherical particle as the water evaporates. In the case of silicone rubber, most of the aerosol evaporates in the TEM leaving only residue from the vaporized silicone polymer. A unique feature of the Pyrell smoke is the change in particle morphology from partially fused clusters with flow to individual spheres for the case of no flow. The change is attributed to the difference in the time–temperature history for the two flow conditions together with the likely low melting point of the pyrolysis products.
SUPPLEMENTAL MATERIAL
Supplemental data for this article can be accessed on the publisher's website.
UAST_1025125_Supplemental_Information.zip
Download Zip (42.6 KB)ACKNOWLEDGMENTS
The SAME experiment team and the crews of ISS increments 10, 13, 15, and 24 are gratefully acknowledged. The SAME project was conducted through the ISS Exploration Research Project of the Exploration Technology Development Program.
Notes
1 Certain commercial equipment, instruments, or materials are identified in this article to foster understanding. Such identification does not imply recommendation or endorsement by the National Institute of Standards and Technology, nor does it imply that the materials or equipment identified are necessarily the best available for the purpose.
REFERENCES
- Abbott, A., and Berger, G. B. (2013). National Center for Space Exploration Research. Personal communication, Cleveland, OH.
- Buch, R., Austin, P. J., and Kashiwagi, T. (1998). Gasification of Silicone Fluids Under External Thermal Radiation. Part 2. Gasification Products—Characterization and Quantitation. Fire Mater., 22:239–252.
- Caminoa, G., Lomakin, S. M., and Lazzaria, M. (2001). Polydimethylsiloxane Thermal Degradation Part 1. Kinetic Aspects. Polymer, 42:2395–2402.
- China, S., Mazzoleni, C., Gorkowski, K., Aiken, A., and Dubey, M. (2013). Morphology and Mixing State of Individual Freshly Emitted Wildfire Carbonaceous Particles. Nat. Commun., 4:2122, DOI:10.1038/ncomms3122.
- Encyclopedia of Polymer Sci. (1969). Encyclopedia of Polymer Science and Technology—Plastics, Resins, Rubber, Fibers. John Wiley and Sons, New York, 11:541.
- Fletcher, R. A., Mulholland, G. W., Winchester, M. R., King, R. L., and Klinedinst, D. B. (2009). Calibration of a Condensation Particle Counter Using a NIST Traceable Method. Aerosol. Sci. Technol., 43:425–441.
- Hatori, H., Yamada, Y., Shiraishi, M., Yoshihara, M., and Kimura, T. (1996). The Mechanism of Polyimide Pyrolysis in the Early Stage. Carbon, 34:201–208.
- Hinds, W. C. (1999). Aerosol Technology, 2nd ed., Wiley Interscience, New York.
- Ingham, J. D., and RAPP, N. S. (1964). Polymer Degradation. II. Mechanism of Thermal Degradation of Polyoxypropylene Glycol-Toluene 2,P-Diisocyanate Polymer (POPG-TDI) and a Block Polyether Glycol-TDI Polymer. J. Polym. Sci., Part A, 2: 4941–4964.
- Kumagai, S., and Yoshimura, N. (2001). Tracking and Erosion of HTV Silicone Rubber and Suppression Mechanism of ATH. IEEE Trans. Dielectr. Electr. Insul., 8:203–211.
- Meyer, M., Mulholland, G. W., Bryg, V., Urban, D. L., Yuan, Z., Ruff, G. A., Cleary, T., and Yang, J. (2015). Smoke Characterization and Feasibility of the Moment Method for Spacecraft Fire Detection. Aerosol Sci. Tech., 49(5):299–309.
- Mochida, M., and Kawamura, K. (2004). Hygroscopic Properties of Levoglucosan and Related Organic Compounds Characteristic to Biomass Burning Aerosol Particles. J. Geophys. Res., 109:D21202, doi:10.1029/2004JD004962.
- Mulholland, G. W., and Ohlemiller, T. J. (1982). Aerosol Characterization of a Smoldering Source. Aerosol Sci. Technol., 1:59–71.
- Mulholland, G. W. (1995). Smoke Production and Properties, Chap. 2–15, In: SFPE Handbook of Fire Protection Engineering, 2nd ed. P. J. DiNenno, C. L. Beyler, R. L. P. Custer, W. D. Walton, J. M. Watts, D. Drysdale, and J. R. Hall, eds., Society of Fire Protection Engineers, Boston, MA, pp. 2–217–2-227.
- Ohlemiller, T. J., Kashiwagi, T., and Werner, K. (1985). Products of Wood Gasification. National Bureau of Standards Interagency Report 85-3127. National Bureau of Standards, National Engineering Laboratory, Center for Fire Research, Gaithersburg, MA, USA.
- Schauer, J. J., Kleeman, M. J., Cass, G. R., and Simoneit, B. R. T. (2001). Measurement of Emissions from Pollution Sources. 3. C1–C29 Organic Compounds from Fireplace Combustion of Wood. Environ. Sci. Technol., 35:1716–1728.
- Scheirs, J., Camino, G., and Tumiatti, W. (2001). Overview of Water Evolution during the thermal Degradation of Cellulose. Eur. Polym. J., 37:933–942.
- Schwenker, R. F., and Pacsu, E. (1956). Pyrolytic Degradation Products of Cellulose. J. Chem. Eng. Data, 2:83–88.
- Seidel W. C., Scherer, K. V. Jr., Dwain Cline, D. Jr., Olson, A. H., and Bonesteel, J. K. (1991). Chemical, Physical, and Toxicological Characterization of Fumes Produced by Heating Tetrafluoroethene Homopolymer and Its Copolymers with Hexafluoropropene and Perfluoro(propy1 vinyl ether). Chem. Res. Toxicol., 4:229–236.
- Ullman's Encyclopedia of Industrial Chemistry. (1992). Ullman's Encyclopedia of Industrial Chemistry—Plastics, Properties and Testing of Polyvinyl Compounds, eds., B. Elvers, S. Hawkins, and G. Schultz, 5th ed., A21:690.
- Urban, D. L., Griffin D., Ruff, G. A., Cleary, T., Yang, J., Mulholland, G., and Yuan, Z. G. (2005). Detection of Smoke from Microgravity Fires. 2005 International Conference on Environmental Systems. Rome Italy, Paper # 2005-01-2930 July 2005, SAE Transactions, pp. 375–384.
- Urban, D. L., Ruff, G. A., Mulholland, G. W., Cleary, T. G., Yang, J. C., and Yuan, Z. G. (2008) Measurement of Smoke Particle Size under Low-Gravity Conditions. 2008 International Conference on Environmental Systems, Chicago, IL, Paper 2008-01-2089.
- Urban, D. L., Griffin, D. W., and Gard, M. Y. (1997) Proceedings of the USML-2 and USMP-3 Joint Launch plus 1 Year Conference, National Academy of Science, Washington, DC, February.
- Woolley, W. D. (1972) Nitrogen-Containing Products from the Thermal Decomposition of Flexible Polyurethane Foams. Br. Polym. J., 4:27–43.