
Abstract
A key issue in pulmonary drug delivery is improving the medical delivery device for effective and targeted treatment. Spacers are clear plastic containers attached to inhalers aimed at delivering more drug particles to the respiratory tract. The spacer's one-way valve plays an important role in controlling and initializing the particles into the oral cavity. This article studied particle inhalation and deposition in an idealized oral airway geometry to better optimize the spacer one-way valve shape and design. Three steady flow rates were used 15, 30, and 60 l/min and a Lagrangian, one-way coupling particle tracking model with near-wall turbulence fluctuation correction was used to determine the deposition rates. For all three breathing rates, the velocity field in the midsagittal plane showed similar gross fluid dynamics characteristics, such as the separation and recirculation regions that occur after the larynx. The particle deposition rates compared reasonably well with available experiments. Most particles deposited at the larynx, where the airway has a decreasing cross-sectional area. For different particles sizes, most particles introduced at the lower region of the mouth show higher possibility to pass through upper airway and enter the trachea and lung airways. The particle deposition patterns in the airway were traced back to their initial inlet position at the oral inlet; and this information provides the background for a conceptual and optimized design of the spacer one-way valve.
Copyright 2015 American Association for Aerosol Research
INTRODUCTION
Pulmonary drug delivery has emerged as a critical method for treating respiratory disease (Dolovich Citation1995; Yang et al. Citation2014; Zhou et al. Citation2014). Nebulizers, dry powder inhalers (DPIs), and metered-dose inhalers (MDIs) are common devices that generate fine drug particles, which is an orally delivered therapy targeting the lung (Van Oort Citation1995). Among these devices, the MDI is the preferred choice by patients for treatment of asthma and COPD (Haughney et al. Citation2010; Price et al. Citation2011). However, studies have shown patients experience difficulty coordinating the timing between actuation and inhalation (Cochrane et al. Citation2000; Han et al. Citation2002; Molimard et al. Citation2003; Kofman et al. Citation2004). Additionally, large drug particles (Morén Citation1981) and high velocities (Versteeg et al. Citation2000) are produced leading to preferential particle deposition on the oropharynx, unintended side effects, and a reduction in therapeutic effectiveness. To address these issues, spacers are used to delay the time between actuation and inhalation allowing patients to inhale slower drug particles more deeply to increase lung deposition (Newman Citation2004; Kwok et al. Citation2005).
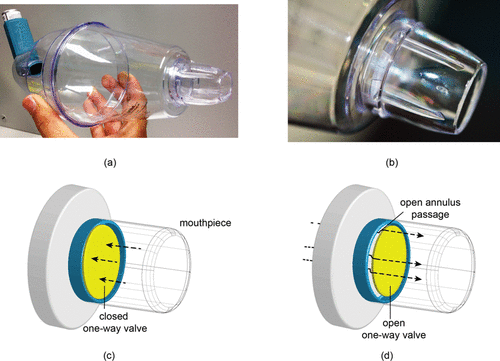
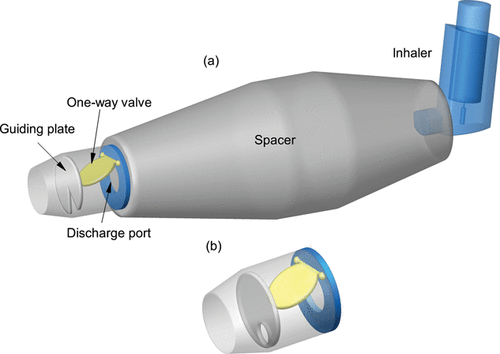
Spacers introduce a chamber of dead volume between the MDI and the patient's mouth. Near the mouthpiece. some spacers include a one-way valve (), which opens during inhalation allowing drug particles to exit the spacer, and closes if exhalation occurs, preventing a return of drug particles (Bisgaard et al. Citation2001). Studies have shown that the inclusion of a spacer can reduce oropharyngeal deposition (Keeley Citation1992; Brocklebank et al. Citation2001; Asmus et al. Citation2002; Chan et al. Citation2006) primarily due to the increased spacer volume that lowers the particle velocity and turbulence intensity (Matida et al. Citation2004b).
FIG. 1. (a) A metered-dose inhaler attached to a commercially-available spacer (Volumatic®). (b) Close-up view of the mouthpiece containing the one-valve. (c) Schematic of mouthpiece with a closed valve produced during exhalation. (d) Mouthpiece with an open valve produced during inhalation.
A number of computational fluid dynamics (CFD) studies have investigated particle deposition in the mouth–throat and/or lung geometries (Cheng et al. Citation2001; Matida et al. Citation2003; Zhang et al. Citation2006; Jin et al. Citation2007; Li et al. Citation2007; Kleinstreuer et al. Citation2008a; Inthavong et al. Citation2010a,Citationb). An early application of CFD analysis of medical devices was conducted by Versteeg et al. Citation(2000) to predict airflow through an MDI. The authors acknowledged that due to technological limitations at the time only qualitative agreement between the CFD model and experiment could be achieved. Later, computational studies include Coates et al. Citation(2004) which investigated the performance of DPIs based on design features such as air inlet size, mouth piece length, and grid size. Results showed that the amount of powder retained in the device doubled, as the air inlet grid void increased. However, the mouthpiece size was not as significant as the inhaler inlet grid size. Kleinstreuer et al. Citation(2007) included a spacer attached to a human upper airway model and simulated airflow and drug deposition. The results showed that the spacer increased drug delivery to the lungs by 30–50% in a pMDI device. The simulations however did not include the spacer one-way valve. Yazdani et al. Citation(2014) investigated drug delivery with a commercially-available MDI, coupled with three commercial spacers. They showed that different spacer shapes and also the one-way valve have a significant effect on particle deposition rate, where 45–70% of the drug deposited is wasted on the spacer wall and valve. Oliveira et al. Citation(2010) and Rebelo et al. Citation(2009) studied airflow pattern and particle trajectories inside a Volumetric spacer. They showed that the spacer geometry has a significant influence on the airflow pattern, which, in turn, can affect particles trajectories and consequently the spacer efficiency. Oliveira et al. Citation(2014) in another study investigated the airflow pattern and particle transport in four different spacers attached to a simplified model of the upper geometry. Authors concluded that most injected particles deposit on the spacer body and valve for all different spacers.
Longest and Hindle Citation(2009) evaluated the performance of an inhaler device connected to a simplified, and realistic mouth–throat geometry using CFD and in-vitro experiments. The results showed that drug delivery device geometry and patient use significantly reduces deposition in the oropharynx. Later, the authors developed a stochastic individual path (SIP) model to predict MDI and DPI drug deposition in the lung airways (Longest et al. Citation2012b) which showed that a DPI device delivered the largest dose to the mouth–throat region (˜70%) and the MDI delivered the largest dose to the alveolar airways (˜50%). The same technique was also applied to investigate the fluid–particle dynamics (Longest et al. Citation2012a) and effects of inhalation profiles (Tian et al. Citation2011) using a low Reynolds number (LRN) k–ω turbulence model with anisotropic near-wall corrections.
Controlled condensational growth provides a method to eliminate extrathoracic deposition and potentially target the region of deposition within the airways (Golshahi et al. Citation2013; Hindle and Longest Citation2010). Using this method, Tian et al. Citation(2014) studied growth and deposition characteristics of nasally administrated aerosol throughout the conducting airway including nose, mouth, and throat. They developed streamlined nasal cannula interface idea to control the particles path and growth in the human lung. Results showed that only 5% of initial dose is lost in the cannula and nasal airway which is a significant reduction in particle deposition in drug delivery through nasal cavity. Similarly Kleinstreuer et al. Citation(2008b) introduced the idea of a controlled air–particle stream for targeting drug deposition in the human respiratory system and the results were used to develop a smart inhaler.
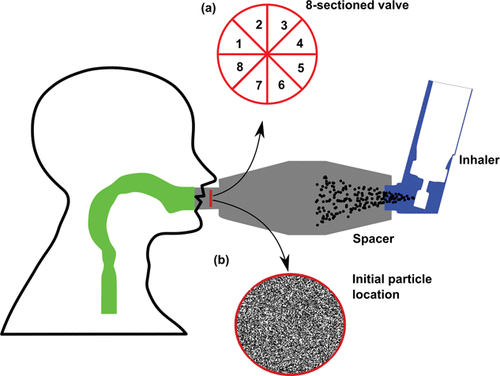
This article is aimed at improving medical devices efficiency and functionality by proposing a new spacer–valve innovation for targeted drug delivery based on computational modeling. To the best of the author's knowledge, no study has considered the spacer valve design for delivering medication effectively to the human lung. , shows a one-way valve found in a commercially-available spacer (Volumatic®) which slides forward during inhalation, creating an annular air gap and allowing drug particles through. During exhalation, the valve slides back and closes off the spacer. This mechanism introduces inherent blockages in the particle trajectories into the oral cavity. Instead, this article proposes a new innovative valve design based on 8-sections in the valve () which is aimed at reducing drug deposition waste in the spacer and valve; and provides targeted drug delivery to specific lung regions. The final valve mechanism and design is dependent on computational model predictions of inhaled particles and their deposition sites to identify regional drug deposition in an idealized mouth–throat model developed by Cheng et al. Citation(1997). By correlating the drug particle's initial location with its final deposition site, each of the 8-sections in the valve can be opened or closed to provide targeted drug delivery.
FIG. 2. Schematic diagram (a) segmentation of single-way valve into 8-ports; (b) particle uniform distribution at the model inlet.
METHOD
Computational Geometry and Mesh
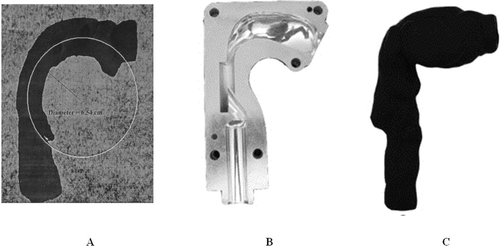
The upper airway geometry exhibits intersubject variability, and even varies in a single person with age. Despite this, there are some common geometrical features that are persistent among all human upper airways. The geometry used in this work is adopted from Cheng et al. Citation(1997). This geometry has been widely used in many investigations in the particle transport and deposition in the upper airway (Zhang et al. Citation2002; Zhang and Kleinstreuer Citation2002, Citation2004; Zhang et al. Citation2005; Kleinstreuer et al. Citation2007; Kleinstreuer et al. Citation2008b). However, there are other upper airway models like the idealized mouth–throat replica (UofA replica) developed by Stapleton (Stapleton et al. Citation2000) and LRRI cast, that also reflect similar features of the upper airway ().
FIG. 3. (a) Upper airway models. (b) Side view of the oral airway replica (Cheng et al. Citation1997). (c) Idealized mouth–throat replica (Stapleton et al. Citation2000). LRRI cast.
The model adopted in this study is that by Cheng et al. Citation(1997) which consists of a surrogate mouth–throat geometry with a variable circular cross-section to represent the oral cavity, pharynx, and larynx (). The geometry was based on hydraulic diameters measured from a replicate cast of a healthy male adult with an approximately 50% full mouth inlet that is 2 cm in diameter. A single specific model suffers from its ability to represent an entire population and indeed such a model is impossible because of the considerable intersubject variability in the upper airway geometry. This means that the findings from this study are model specific and in future it is anticipated that further studies can confirm similar predicted results that are produced by the proposed smart spacer technique.
FIG. 4. Computational model of the oral–pharynx–larynx–trachea airway adopted from (Cheng et al. Citation1997) with a block-structured mesh airway model applied to it.
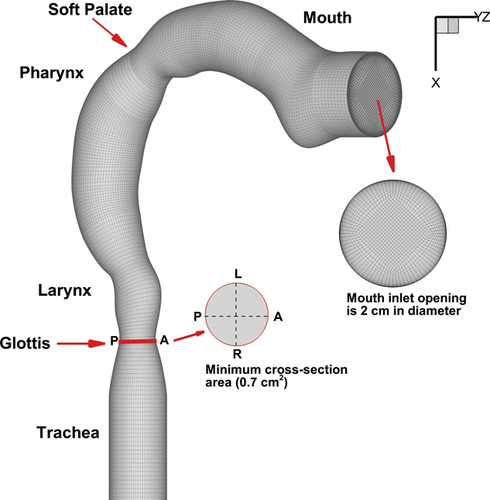
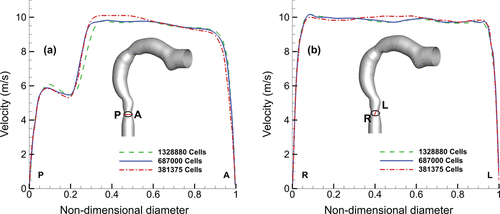
The computational mesh consisted of block-structured cells with near-wall refinements so that the first grid point was within the viscous sublayer (e.g., y+< 5). To determine the optimized number of mesh cells, a grid independence study was performed using three grid sizes of 381,000, 687,000, and 1,328,000 computational cells (). The minimum cross-sectional area (0.7 cm2) was found at the glottis region (labeled in ) and axial velocities were taken along lines R-L (right to left) and P-A (posterior to anterior) directions on the cross-section for a flow rate of 30 l/min. An increase in computational cells from 381,000 to 687,000 changed the velocity profile by 3.9% and 1.3% along the P-A and R-L line profiles, respectively. However, increasing cells from 687,000 to 1,328,000 did not have a significant effect. Similarly, the grid dependence was evaluated for particle deposition for 1–10 µm particles (also at airflow of 30 l/min) which showed negligible difference when the number of cells increased from 687,000 to 1,328,000. Thus, the model with 687,000 cells was used in this study which is approximately 13 cells/mm3 in the model.
FIG. 5. Velocity profiles taken along the minimum cross-sectional area plane (Glottis) for a flow rate of 30 l/min. (a) Velocity profile along the posterior–anterior line, P-A. (b) Velocity profile along the right–left line (R-L).
Airflow Field Equations and Assumptions
Johnstone et al. Citation(2004) measured the Reynolds number as 650–13,000 experimentally for the range of 10–120 l/min airflow rate in an idealized extra-thoracic airway. In this article, three airflow rates 15, 30, and 60 l/min were used. Although the Reynolds number may be indeed by laminar for a smooth regular internal pipe flow, the irregular and complex shape of the oral–pharyngeal airway produces flow dynamics such as separation and recirculation, which leads to earlier onset of turbulence. The flow is therefore expected to exhibit some form of transition from laminar to turbulence (Kleinstreuer and Zhang Citation2003).
The turbulence model with low Reynolds number (LRN) corrections has been used for predicting the average velocity profiles, pressure drop, and shear stresses in the multiregime flow field in human upper airway (Longest and Xi Citation2007b; Worth Longest and Vinchurkar Citation2007). The Reynolds-averaged Navier–Stokes equations for mass and momentum are presented in Equations (1) and (2)
[1]
[2] where,
is the time-averaged velocity, p the time-averaged static pressure,
the fluid specific mass, and
the kinematic viscosity. The turbulent kinematic viscosity,
, is given in Equation (3), where,
is a constant with an accepted value of 0.09, and
is a function of
(Equation (4))
[3]
[4]
k and ω are the turbulence kinetic energy and the turbulence frequency, respectively, and their model equations can be found in Wilcox Citation(1998). The initial boundary values of parameters and
are often determined using empirical correlations (Kral Citation1998) as
[5]
[6] where,
,
, and
are upstream turbulence intensity, average velocity magnitude at the relevant boundary, and hydraulic radius of the boundary, respectively.
The segregated solver in Ansys-Fluent 14.5 was used with the SIMPLEC algorithm for pressure–velocity coupling and the discretization scheme was second-order upwind. The solution was assumed converged based on a residual convergence criterion of . The fluid was air with a dynamic viscosity of
and density of
.
Particle Tracking Equations and Assumptions
The Lagrangian tracking approach is used to trace the individual particle transport taking into account inertia effects. The general form of the trajectory equations for a single particle with constant mass is given as,[7]
[8] where,
is the particle velocity and
is the position vector. The force terms on the right-hand side of Equation (7), are the gravity-buoyancy and drag forces per unit mass of the particle.
is the fluid to particle density ratio
, and
is the gravitational acceleration vector. In the drag force term,
is the particle relaxation time, defined as
[9] where,
is the fluid velocity relative to the particle, and
is the unit vector in the direction of fluid velocity relative to the particle. Since particles under investigation are in the range of 1–10 µm, the molecular slip influence on the particles can be neglected, and the Cunningham Correction factor,
is set to 1. The drag coefficient, CD is based on the model by Morsi and Alexander Citation(1972).
A one-way turbulent dispersion on the particle is performed through the Discrete Random Walk (DRW) or “eddy interaction model” inside Ansys-Fluent. This approach assumes that a particle interacts with a succession of random discrete turbulent eddies, where each eddy is defined by a lifetime, length, and velocity scale. The velocity scale is determined by a Gaussian distributed random velocity fluctuation as where
is a random Gaussian random number with mean zero and unit variance. The anisotropic turbulent behavior in the near wall (Kallio and Reeks Citation1989) is corrected by applying a damping function (Wang and James Citation1999; Matida et al. Citation2004a; Inthavong et al. Citation2006, Citation2009, Citation2011) up to a nondimensionalized wall distance of y+ of 30 as:
[10] with the eddy lifetime interaction maintained constant as
using the User-Defined-Function option in Ansys-Fluent. Aerodynamic particles (e.g., density of 1000 kg/m3) ranging from 1–10 μm were used. The particles were injected at the inlet with the same velocity as the airflow and uniformly distributed over the inlet (although in reality particles at the end of spacer and beginning of the mouth are not uniformly distributed). Particle deposition was assumed when it hit the airway surface (which is covered by a mucus layer) and hence no rebounding was considered. The number of particles tracked was checked for statistical independence since the turbulent dispersion modeling is a stochastic process. Independence was achieved for 20,000 particles where an increase of particles to 40,000 particles yielded a difference of 0.1% in the deposition efficiency.
RESULTS AND DISCUSSION
Model Validation
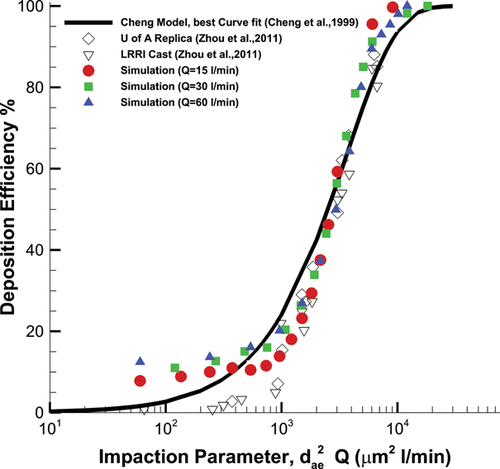
The particle deposition efficiency was compared against experimental results obtained from Cheng et al. Citation(1999) and Zhou et al. Citation(2011) shown in The deposition efficiency is the fraction of the deposited particle over the total injected particles. To account for the particle diameter and inhalation flow parameters, the set of results collapse into one dataset by using the impaction parameter. The impaction parameter is defined as , where
is the particle aerodynamic equivalent diameter in µm, and
is the airflow rate in l/min. The deposition curve follows the same trend for all three breathing levels and the deposition pattern becomes sensitive at the cutoff impaction parameter of
. The results show a reasonable comparison with the experimental data, although there is a slight overprediction for
and
. This discrepancy between the experimental results and simulation can be justified by two main reasons. First, the airway wall is considered smooth in the simulation; however, the model surface in the experiment has some roughness, which might affect particle transport and deposition. Second, heat transfer has not been considered in simulation, which might affect particles trajectories, especially small particles.
FIG. 6. Validation of particle deposition efficiency in the human oral airway models.
Airflow Field
shows the velocity contours in the midsagittal plane for the three flow rates, normalized by the local maximum velocity denoted by Vmax. The velocity remains nearly constant for a short distance from the inlet before slightly accelerating in the mouth. The presence of the tongue creates an arch in the oral cavity, which pushes the airflow superiorly, and flow separates at the back of the oral cavity. As the airflow moves from the oral cavity to the pharynx, there is a 90° bend and flow separation occurs. Flow is accelerated toward the back of the throat on the outer wall, while a low velocity recirculating region forms near the inner pharynx wall. The velocity contour at slice A-A’ shows the flow pattern from a transverse view, consisting of flow rolling into the center of the pipe from the outer radial walls, which are Dean vortices that are characteristic of pipe bend flows.
FIG. 7. Normalized velocity magnitude contours in the midplane of the mouth–throat airway.
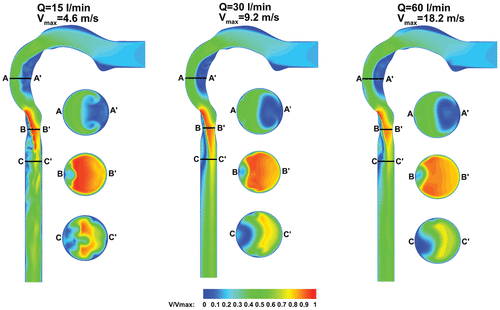
The airflow is then directed toward the inner wall at the larynx, which coincides with the end of the semicircular pharynx shape. The change of flow direction from pharynx to larynx is not as severe as the transition from mouth to pharynx. This leads to a smaller region of low velocity recirculating flow on the outer wall of the larynx compared with the recirculating region in the glottis (Slice B-B’). The velocity reaches its maximum and forms the laryngeal jet (Lin et al. Citation2007) at the minimum cross-section at the larynx, and remains in the center of the airway with a little tendency to move toward the inner wall (Slice C-C’). A recirculating region forms next to the trachea outer wall, which covers almost one-third of the trachea caused by the airway expansion from larynx to trachea that reduces the laryngeal jet.
Particle Deposition
shows the particle deposition efficiency for all three breathing patterns for 2–10 µm particles. There are two general recognizable trends in this curve. First, increasing the particle diameter is associated with increasing the deposition fraction. Inertial impaction is the most dominant factor in microparticle deposition in the upper airway (Longest and Xi Citation2007a; Shi et al. Citation2007). Larger particles suspended in the fluid have less time to adjust to sudden changes in the airflow streamlines. Thus, larger particles have more possibility to deposit on curved boundaries, proportional to . This explains the nonlinear change in deposition efficiency for successive particle diameter increase.
FIG. 8. Study of particle deposition sensitivity to flow rate and particle diameter.
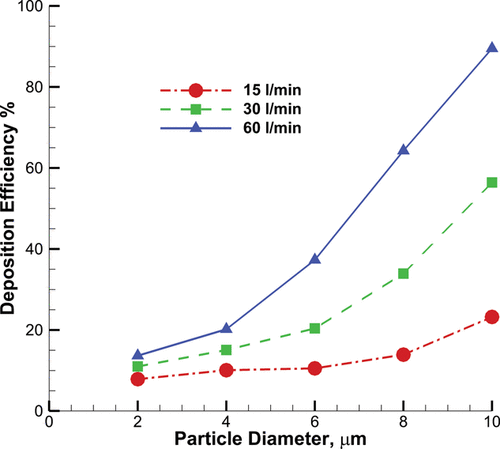
Increasing the airflow rate also increases the particle deposition. For a given particle diameter, the distance between two successive deposition curves from an increase in flow rate, is almost linear and constant. This is consistent with the impaction parameter definition that is linearly proportional to the fluid velocity. However the effect on particles with diameters <6 µm is small, for larger particles with diameters >6 µm, the deposition is very sensitive to the airflow rate. For example, more than 80% incoming of 10 µm particles deposit in the oral airway which is consistent with the results obtained by Zhang et al. Citation(2005).
shows deposition patterns for 2, 6, and 10 µm particles for flow rates of (a) 15, (b) 30, and (c) 60 l/min. The originating positions of escaped particles are shown in (i) slice D-D’ and the locations of particles that deposit in (ii) slice D-D’. The exiting particle positions are shown in (iii) slice E-E’. Particles depositing in the airway are color coded by the following regions: mouth; pharynx; larynx; and trachea.
FIG. 9. Particle distribution patterns in the upper airway for flow rates (a) 15 l/min (b) 30 l/min, and (c) 60 l/min for 2 µm, 6 µm, and 10 µm particles. In each individual image, cross-sectional slices depicting particle positions are shown for (i) inlet release positions of particles which escape the model (ii) inlet release positions of particles that deposit on the airway walls (iii) particle positions at the outlet, i.e., trachea exit.
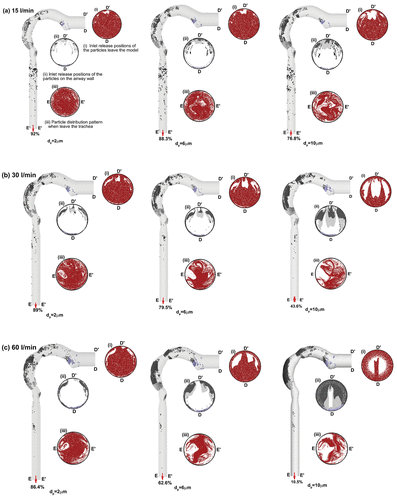
Deposition in the pharynx and larynx correspond to initial positions in the upper half of the inlet cross-section for all particles and flow rates. Particles that deposit in the trachea originate near the center of the inlet, although the amount depositing is small (˜4.2%). Although larger particles increase the deposition efficiency, the inlet release positions of 2 and 6 µm particles are similar for all flow rates. However, the distribution map changes significantly from 6 µm to 10 µm. This indicates that the deposition pattern becomes sensitive at the particle size of 6 µm. A small fraction of particles, deposit on the back of the mouth wall which originates from the lower regions on the inlet. Particle deposition is concentrated in regions corresponding to a sudden change in the geometry due to inertial impaction. The airflow is predominantly near the outer wall after exiting the oral cavity and as it enters the pharynx which increases the particle deposition along the outer pharynx wall. The abrupt reduction in airway diameter, occurring at the transition from pharynx to larynx, results in an increased airflow velocity in this region, which enhances the likelihood of particle deposition.
For pulmonary therapy, we are interested in particles that successfully pass through the oral airway and escape into the tracheobronchial airway. It was found that increasing particle diameter created a more dilute distribution at the outlet. The particle positions at the outlet (iii) slice E-E’ are traced back to their initial inlet location to determine which initial position locations are more likely to provide a successful path for particles to enter the lung airways.
Generally particles released from a lower inlet region have more chance to escape the upper airway. For a flow rate of 15 l/min, the inlet position pattern in the upper half for escaped particles (Slice E-E’) becomes dilute for 10 µm particles. This dilution becomes increasingly significant for increased inhalation (slice E-E’ for 30 l/min and 60 l/min). To investigate the viability of the proposed 8-sectioned inlet valve, summarize the fraction of particles across each inlet section for escaped particles. For all sections, increased particles size leads to decreased particle fraction. The lower sections (Sections 5–8) have higher potential to deliver particles to the lungs. For example, for 30 l/min, the results show an increasing difference between the upper and lower sections for escaped particles, as the particle size increases. For 2 µm, the escaped particles fraction changes from 41.5% to 47.5% (upper to lower section) a difference of 6%, and this difference increases to a maximum of 18.6% for 10 µm particles (12.5% for upper and 31.1% for lower). This characteristic is consistent for all flow rates. Thus, in order to improve particle deposition in the lung, the one-way valve should be designed to redirect the particles entering the mouth at lower positions represented by Sections 5–8 in the inlet valve.
TABLE 1 Fraction of particles reaches to the outlet based on the released position (%)-(airflow 15 l/min)
TABLE 2 Fraction of particles reaches to the outlet based on the released position (%) (airflow 30 l/min)
TABLE 3 Fraction of particles reaches to the outlet based on the released position (%) (airflow 60 l/min)
The inlet sectioned valve can also be used to determine the initial inlet particle position for regional particle deposition based on anatomy. summarize the fraction of particles in each of the 8-sectioned valve for the pharynx, larynx, and trachea regions, respectively. The main deposition sites are the pharynx and larynx, capturing up to 55% of 10 µm particles, while there is negligible deposition in the trachea. This suggests that particles reaching the trachea have sufficient relaxation time to navigate the geometry and escape through to the lungs. Deposition in the airway is found for particles released from the upper half of the initial inlet positions, described by Sections 1–4.
TABLE 4 Fraction of particles lands on the pharynx based on the released position (%) (airflow 30 l/min)
TABLE 5 Fraction of particles lands on the larynx based on the released position (%) (airflow 30 l/min)
TABLE 6 Fraction of particles land on the trachea based on the released position (%) (airflow 30 l/min)
Proposed One-Way Valve Design
Two important issues are considered in the new valve design. In the previous valve design, a small air passage () reduces the airflow cross-section which increases the airflow velocity. This results in increased particle velocity in the airstream. Higher velocity increases the particles relaxation time, meaning that a longer time is needed to adapt its path with the flow streamlines. To solve this problem, a new swing valve mechanism is proposed which provides more opportunity for particles to pass through the valve section with lower inertial properties. The results showed that the upper region of the valve provides greater potential for deposition in the airway while the lower region provides more opportunity for the particles to exit into the lungs. A guiding plate is proposed after the swing valve to direct the flow path to the desired region (). This guiding plate can be designed differently to target a specific area in the airway or down into the lung.
FIG. 10. Proposed spacer design with (a) segment guiding plate and (b) circular guiding plate.
CONCLUSION
CFD simulations were carried out to analyze the airflow field and trace drug particles through a simplified human upper airway model. Three flow rates of 15, 30, and 60 l/min were investigated and particles ranging from 2 to 10 µm were released from the inlet. The velocity contours showed that the flow field was similar for all three flow rates. Particle deposition mainly occurred in the pharyngeal region, precisely where the airflow streamlines changes direction. Increasing the particle size and the flow rate increased the deposition and consequently lowered the drug delivery efficiency to the lungs. Particles that did escape were found to originate in the lower sections of the spacer valve. Redesigning the spacer valve so that it re-directs particles to the lower sections provides a greater opportunity for the aerosolized medication to reach the lung. Most particles that escape the trachea exit are distributed at the central part of the outlet. A new valve design is proposed aimed at increasing the drug delivery efficiency, and decreasing unwanted side effects. The new design allows custom movement of a guiding plate to achieve specific targeted drug delivery.
This study provides potential efficiency improvements in the spacer design moving toward a smart spacer framework. It is anticipated that this reverse particle tracking technique will provide new opportunities of innovation and design to be exploited. In the context of the clinical benefit from the inhaled drugs, the increase in lung deposition may not necessarily be greater than with a standard spacer, but there would be a significant reduction in unintentional particle deposition in unintended regions. This would significantly reduce any unwanted side-effects as the particle release locations that lead to undesired deposition sites are prohibited via the modified one-way valve. Further studies are required to determine the effectiveness of re-directing particle-laden inhaled air through the different valve designs and its impact on respiratory tract deposition.
The airflow patterns in the spacer itself exhibit a complex flow field containing swirl flow and recirculation regions. The authors' earlier work showed that of circulatory flow especially downstream of the spacer entrance and also next to the spacer mouthpiece increases undesirable particle deposition (Yazdani et al. Citation2014). From these results, different spacer designs need to be investigated in a future study to determine optimal conditions needed to precondition the particle-laden flow to enter the one-way valve sufficiently. This study was aimed at providing potential efficiency improvements in the spacer design moving toward a smart spacer framework. It is anticipated that this reverse tracking technique will provide new opportunities of innovation and design to be exploited further.
In this study, an idealized specific airway model was used to implement the smart spacer idea. The inherent morphological differences of the upper airway among subjects provides a challenging task to make generalizations from the results. Instead, the use of an idealized model in this case with a smoothed curved oropharynx provides a benchmark, where future studies may confirm similar or find differences in flow features and particle in-flight dynamics in the mouth–throat geometries. Future work applying the reverse particle tracking technique among different geometries would prove invaluable to further confirm and improve the smart spacer design idea.
Related Research Data
REFERENCES
- Asmus, M. J., Liang, J., Coowanitwong, I., Vafadari, R., and Hochhaus, G. (2002). In Vitro Deposition of Fluticasone Aerosol from a Metered-Dose Inhaler with and Without Two Common Valved Holding Chambers. Ann. Allerg. Asthma. Immunol., 88:204–208.
- Bisgaard, H., Anhoj, J., and Wildhaber, J. H. (2001). Spacer Devices, in Drug Delivery to the Lung. Marcel Dekker, New York, pp. 389–420.
- Brocklebank, D., Ram, F., Wright, J., Barry, P., Cates, C., Davies, L., Douglas, G., Muers, M., Smith, D., and White, J. (2001). Comparison of the Effectiveness of Inhaler Devices in Asthma and Chronic Obstructive Airways Disease: A Systematic Review of the Literature. Health Technol. Assess., 5:1–149.
- Chan, D. S., Callahan, C. W., Hatch-Pigott, V. B., Lawless, A., Proffitt, H. L., Manning, N. E., and Schweikert, M. P. (2006). Concurrent Use of Metered-Dose and Dry Powder Inhalers by Children with Persistent Asthma Does Not Adversely Affect Spacer/Inhaler Technique. Ann. Pharmacother., 40:1743–1746.
- Cheng, K. H., Cheng, Y. S., Yeh, H. C., and Swift, D. L. (1997). Measurements of Airway Dimensions and Calculation of Mass Transfer Characteristics of the Human Oral Passage. J. Biomech. Eng., 119:476–482.
- Cheng, Y.-S., Zhou, Y., and Chen, B. T. (1999). Particle Deposition in a Cast of Human Oral Airways. Aerosol Sci. Technol., 31:286–300.
- Cheng, Y. S., Fu, C. S., Yazzie, D., and Zhou, Y. (2001). Respiratory Deposition Patterns of Salbutamol pMDI with CFC and HFA-134a Formulations in a Human Airway Replica. J. Aerosol Med., 14:255–266.
- Coates, M. S., Fletcher, D. F., Chan, H. K., and Raper, J. A. (2004). Effect of Design on the Performance of a Dry Powder Inhaler Using Computational Fluid Dynamics. Part 1: Grid Structure and Mouthpiece Length. J. Pharm. Sci., 93:2863–2876.
- Cochrane, M. G., Bala, M. V., Downs, K. E., Mauskopf, J., and Ben-Joseph, R. H. (2000). Inhaled Corticosteroids for Asthma Therapy: Patient Compliance, Devices, and Inhalation Technique. Chest, 117:542–550.
- Dolovich, M. (1995). Characterization of Medical Aerosols: Physical and Clinical Requirements for New Inhalers. Aerosol Sci. Technol., 22:392–399.
- Golshahi, L., Tian, G., Azimi, M., Son, Y.-J., Walenga, R., Longest, P. W., and Hindle, M. (2013). The Use of Condensational Growth Methods for Efficient Drug Delivery to the Lungs during Noninvasive Ventilation High Flow Therapy. Pharm. Res., 30:2917–2930.
- Han, R., Papadopoulos, G., and Greenspan, B. J. (2002). Flow Field Measurement Inside the Mouthpiece of the Spiros Inhaler Using Particle Image Velocimetry. Aerosol Sci. Technol., 36:329–341.
- Haughney, J., Price, D., Barnes, N. C., Virchow, J. C., Roche, N., and Chrystyn, H. (2010). Choosing Inhaler Devices for People with Asthma: Current Knowledge and Outstanding Research Needs. Respir. Med., 104:1237–1245.
- Hindle, M., and Longest, P. W. (2010). Evaluation of Enhanced Condensational Growth (ECG) for Controlled Respiratory Drug Delivery in a Mouth–Throat and Upper Tracheobronchial Model. Pharm. Res., 27:1800–1811.
- Inthavong, K., Choi, L. T., Tu, J. Y., Ding, S., and Thien, F. (2010a). Micron Particle Deposition in a Tracheobronchial Airway Model Under Different Breathing Conditions. Med. Eng. Phys., 32:1198–1212.
- Inthavong, K., Tian, Z. F., Li, H. F., Tu, J. Y., Yang, W., Xue, C. L., and Li, C. G. (2006). A Numerical Study of Spray Particle Deposition in a Human Nasal Cavity. Aerosol Sci. Technol., 40:1034–U1033.
- Inthavong, K., Tu, J., and Heschl, C. (2011). Micron Particle Deposition in the Nasal Cavity using the v2–f Model. Comput. Fluids, 51:184–188.
- Inthavong, K., Tu, J. Y., Ye, Y., Ding, S., Subic, A., and Thien, F. (2010b). Effects of Airway Obstruction Induced by Asthma Attack on Particle Deposition. J. Aerosol Sci., 41:587–601.
- Inthavong, K., Zhang, K., and Tu, J. Y. (2009). Modelling Submicron and Micron Particle Deposition in a Human Nasal Cavity, in Seventh International Conference on Computational Fluid Dynamics in the Minerals and Process Industries, P. Schwarz and P. Witt, Eds., CSIRO Minerals, Australia, Melbourne, Australia.
- Jin, H. H., Fan, J. R., Zeng, M. J., and Cen, K. F. (2007). Large Eddy Simulation of Inhaled Particle Deposition Within the Human Upper Respiratory Tract. J. Aerosol Sci., 38:257–268.
- Johnstone, A., Uddin, M., Pollard, A., Heenan, A., and Finlay, W. H. (2004). The Flow Inside an Idealised Form of the Human Extra-Thoracic Airway. Exp. Fluids, 37:673–689.
- Kallio, G. A., and Reeks, M. W. (1989). A Numerical Simulation of Particle Deposition in Turbulent Boundary Layers. Int. J. Multiphas. Flow, 15:433–446.
- Keeley, D. (1992). Large Volume Plastic Spacers in Asthma. BMJ (Clin. Res. ed.), 305:598–599.
- Kleinstreuer, C., Shi, H., and Zhang, Z. (2007). Computational Analyses of a Pressurized Metered Dose Inhaler and a New Drug-Aerosol Targeting Methodology. J. Aerosol Med., 20:294–309.
- Kleinstreuer, C., and Zhang, Z. (2003). Laminar-to-Turbulent Fluid-Particle Flows in a Human Airway Model. Int. J. Multiphas Flow, 29:271–289.
- Kleinstreuer, C., Zhang, Z., and Li, Z. (2008a). Modeling Airflow and Particle Transport/Deposition in Pulmonary Airways. Respir. Physiol. Neurobiol., 163:128–138.
- Kleinstreuer, C., Zhang, Z., Li, Z., Roberts, W. L., and Rojas, C. (2008b). A New Methodology for Targeting Drug-Aerosols in the Human Respiratory System. Int. J. Heat Mass Transfer, 51:5578–5589.
- Kofman, C., Berlinski, A., Zaragoza, S., and Teper, A. (2004). Aerosol Therapy for Pediatric Outpatients. RT: J. Respir. Care Practitioners, 117:26–28.
- Kral, L. D. (1998). Recent Experience with Different Turbulence Models Applied to the Calculation of Flow Over Aircraft Components. Prog. Aerosp. Sci., 34:481–541.
- Kwok, P. C., Glover, W., and Chan, H. K. (2005). Electrostatic Charge Characteristics of Aerosols Produced From Metered Dose Inhalers. J. Pharm. Sci., 94:2789–2799.
- Li, Z., Kleinstreuer, C., and Zhang, Z. (2007). Particle deposition in the Human Tracheobronchial Airways Due to Transient Inspiratory Flow Patterns. J. Aerosol Sci., 38:625–644.
- Lin, C.-L., Tawhai, M. H., McLennan, G., and Hoffman, E. A. (2007). Characteristics of the Turbulent Laryngeal Jet and Its Effect on Airflow in the Human Intra-Thoracic Airways. Respir. Physiol. Neurobiol., 157:295–309.
- Longest, P. W., Tian, G., Delvadia, R., and Hindle, M. (2012a). Development of a Stochastic Individual Path (SIP) Model for Predicting the Deposition of Pharmaceutical Aerosols: Effects of Turbulence, Polydisperse Aerosol Size, and Evaluation of Multiple Lung Lobes. Aerosol Sci. Technol., 46:1271–1285.
- Longest, P. W., Tian, G., Walenga, R. L., and Hindle, M. (2012b). Comparing MDI and DPI Aerosol Deposition using in vitro Experiments and a New Stochastic Individual Path (SIP) Model of the Conducting Airways. Pharm. Res., 29:1670–1688.
- Longest, P. W., and Xi, J. (2007a). Computational Investigation of Particle Inertia Effects on Submicron Aerosol Deposition in the Respiratory Tract. J. Aerosol Sci., 38:111–130.
- Longest, P. W., and Xi, J. (2007b). Effectiveness of Direct Lagrangian Tracking Models for Simulating Nanoparticle Deposition in the Upper Airways. Aerosol Sci. Technol., 41:380–397.
- Longest, W. P., and Hindle, M. (2009). Evaluation of the Respimat Soft Mist Inhaler using a Concurrent CFD and In Vitro Approach. J. Aerosol Med. Pulmonar. Drug Deliv., 22:99–112.
- Matida, E. A., DeHaan, W. H., Finlay, W. H., and Lange, C. F. (2003). Simulation of Particle Deposition in an Idealized Mouth with Different Small Diameter Inlets. Aerosol Sci. Technol., 37:924–932.
- Matida, E. A., Finlay, W. H., Lange, C. F., and Grgic, B. (2004a). Improved Numerical Simulation for Aerosol Deposition in an Idealized Mouth–Throat. J. Aerosol Sci., 35:1–19.
- Matida, E. A., Finlay, W. H., Rimkus, M., Grgic, B., and Lange, C. F. (2004b). A New Add-on Spacer Design Concept for Dry-Powder Inhalers. J. Aerosol Sci., 35:823–833.
- Molimard, M., Raherison, C., Lignot, S., Depont, F., Abouelfath, A., and Moore, N. (2003). Assessment of Handling of Inhaler Devices in Real Life: An Observational Study in 3811 Patients in Primary Care. J. Aerosol Med., 16:249–254.
- Morén, F. (1981). Pressurized Aerosols for Oral Inhalation. Int. J. Pharmaceut., 8:1–10.
- Morsi, S., and Alexander, A. (1972). An Investigation of Particle Trajectories in Two-Phase Flow Systems. J. Fluid Mech., 55:193–208.
- Newman, S. P. (2004). Spacer Devices for Metered Dose Inhalers. Clin. Pharmacokinet, 43:349–360.
- Oliveira, R. F., Teixeira, S., Marques, H. C., and Teixeira, J. C. (2014). Efficiency Evaluation of VHC: A CFD Comparison Study at Constant Flow, in International Conference on Mechanics, Fluid Mechanics, Heat and Mass Transfer.
- Oliveira, R. F., Teixeira, S., Silva, L. F., Teixeira, J. C., and Antunes, H. (2010). CFD Study of the Volumetric Spacer: A Realistic Approach, in Vth European Conference on Computational Fluid Dynamics, J. C. F. Pereira and A. Sequeira, eds., Lisbon, Portugal.
- Price, D., Roche, N., Christian Virchow, J., Burden, A., Ali, M., Chisholm, A., Lee, A. J., Hillyer, E. V., and von Ziegenweidt, J. (2011). Device Type and Real-World Effectiveness of Asthma Combination Therapy: An Observational Study. Respir. Med., 105:1457–1466.
- Rebelo, R., Oliveira, R. F., Silva, L. F., Teixeira, S., Teixeira, J. C., and Antunes, H. (2009). Further Development on the CFD Flow Analysis Inside the Volmumetric Spacer, in XIII Congreso International de Ingenieria de Proyectos, Badajoz.
- Shi, H., Kleinstreuer, C., and Zhang, Z. (2007). Modeling of Inertial Particle Transport and Deposition in Human Nasal Cavities with Wall Roughness. J. Aerosol Sci., 38:398–419.
- Stapleton, K.-W., Guentsch, E., Hoskinson, M., and Finlay, W. (2000). On the Suitability of k–ϵ Turbulence Modeling for Aerosol Deposition in the Mouth and Throat: A Comparison with Experiment. J. Aerosol Sci., 31:739–749.
- Tian, G., Hindle, M., and Longest, P. W. (2014). Targeted Lung Delivery of Nasally Administered Aerosols. Aerosol Sci. Technol. 48:434–449.
- Tian, G., Longest, P. W., Su, G., Walenga, R. L., and Hindle, M. (2011). Development of a Stochastic Individual Path (SIP) Model for Predicting the Tracheobronchial Deposition of Pharmaceutical Aerosols: Effects of Transient Inhalation and Sampling the Airways. J. Aerosol Sci., 42:781–799.
- Van Oort, M. (1995). In Vitro Testing of Dry Powder Inhalers. Aerosol Sci. Technol., 22:364–373.
- Versteeg, H. K., Hargrave, G., Harrington, L., Shrubb, I., and Hodson, D. (2000). The Use of Computational Fluid Dynamics (CFD) to Predict pMD Air Flows and Aerosol Plume Formation, in Respiratory Drug Delivery VII, Raleigh Serentec Press, Inc., 257–264.
- Wang, Y., and James, P. W. (1999). On the Effect of Anisotropy on the Turbulent Dispersion and Deposition of Small Particles. Int. J. Multiphase Flows, 25:551–558.
- Wilcox, D. C. (1998). Turbulence Modeling for CFD. DCW Industries, Inc.
- Worth Longest, P., and Vinchurkar, S. (2007). Validating CFD Predictions of Respiratory Aerosol Deposition: Effects of Upstream Transition and Turbulence. J. Biomech., 40:305–316.
- Yang, M. Y., Chan, J. G., and Chan, H. K. (2014). Pulmonary Drug Delivery by Powder Aerosols. J. Control. Release, 193c:228–240.
- Yazdani, A., Normandie, M., Yousefi, M., Saidi, M. S., and Ahmadi, G. (2014). Transport and Deposition of Pharmaceutical Particles in Three Commercial Spacer–MDI Combinations. Comput. Biol. Med., 54:145–155.
- Zhang, Y., Chia, T. L., and Finlay, W. H. (2006). Experimental Measurement and Numerical Study of Particle Deposition in Highly Idealized Mouth–Throat Models. Aerosol Sci. Technol., 40:361–372.
- Zhang, Z., and Kleinstreuer, C. (2002). Transient Airflow Structures and Particle Transport in a Sequentially Branching Lung Airway Model. Phys. Fluid., 14:862–880.
- Zhang, Z., and Kleinstreuer, C. (2004). Airflow Structures and Nano-Particle Deposition in a Human Upper Airway Model. J. Comput. Phys., 198:178–210.
- Zhang, Z., Kleinstreuer, C., Donohue, J. F., and Kim, C. S. (2005). Comparison of Micro- and Nano-Size Particle Depositions in a Human Upper Airway Model. J. Aerosol Sci., 36:211–233.
- Zhang, Z., Kleinstreuer, C., and Kim, C. S. (2002). Micro-Particle Transport and Deposition in a Human Oral Airway Model. J. Aerosol Sci., 33:1635–1652.
- Zhou, Q. T., Tang, P., Leung, S. S., Chan, J. G., and Chan, H. K. (2014). Emerging Inhalation Aerosol Devices and Strategies: Where Are We Headed? Adv. Drug Deliv. Rev., 75:3–17.
- Zhou, Y., Sun, J., and Cheng, Y. S. (2011). Comparison of Deposition in the USP and Physical Mouth-Throat Models with Solid and Liquid Particles. J. Aerosol Med. Pulmonar. Drug Deliv., 24:8.